Yasser Abidnoor Jebbar*![]() | Fadhil Khaddam Fluiful
| Fadhil Khaddam Fluiful![]() | Wisam J. Khudhayer
| Wisam J. Khudhayer![]() | Nasser Ali Hasson
| Nasser Ali Hasson![]() | Ali Jaber Abdulhamed
| Ali Jaber Abdulhamed![]()
© 2024 The authors. This article is published by IIETA and is licensed under the CC BY 4.0 license (http://creativecommons.org/licenses/by/4.0/).
OPEN ACCESS
The thermal performance of a parabolic trough receiver (PTR) with hollow cylindrical inserts (HCIs) is numerically investigated. The HCIs are coupled in an axial manner and also radially joined to the interior of the PTR. Totally, eleven different internally hollow cylindrical receivers are examined and compared with the plain tube (PT). The lengths, thicknesses, and numbers of HCIs are tested at varied values, and all these tubes are examined under a constant inlet temperature of 300 K and mass flow rates in the range of 0.6-1.0 kg/s. ANSYS Fluent is the simulation software in this work. The developed model is validated with experimental correlations for PT case. The simulation findings demonstrated that the addition of HCIs may greatly enhance the uniformity of the temperature gradient between the wall of the PTR and the water. The optimum case of the HCIs has a length of 40 mm, a thickness of 2 mm, and a number of 15 inserts. This model recoded the higher ranges of Nusselt number (132-296), fraction factor (0.301-0.064), and thermal efficiency (41-79%). Also, the outlet temperatures of the PT and modified tube are increased from 300 K to 325.5 K and 339.7 K, respectively. As a result, this approach provides advantages over the utilization of interior fins, as it can be applied on the parabolic trough collector (PTC) without requiring any modifications to the PTR, which are associated with numerous operational challenges.
inserts, parabolic trough collector, heat exchanges, heat transfer enhancement, CFD
Improving the thermal conductivity between a heat transfer fluid (HTF) and a parabolic trough receiver (PTR) is important for many uses, such as making energy [1], desalination [2], cooling [3], and more. Generally, three techniques are used to improve heat transfer between the HTF and the PTR: active, passive, and compound techniques (active and passive). Furthermore, these techniques are designed to minimize the temperature variation inside the PTR to mitigate thermal stresses and, subsequently, decrease the likelihood of failure. An active technique is needed for an external energy source to enhance heat transfer in a PTR. In contrast, a passive technique involves altering the configuration of thermal systems in order to enhance their thermal performance without requiring the use of external energy sources. The compound techniques mix two first techniques: active-active, active-passive, or passive-passive [4].
Broadly, passive techniques are the most commonly used techniques for enhancing the heat transfer rate (Nusselt number) and pressure drop (fraction factor) inside the PTR. Therefore, numerous researchers have extensively studied these techniques to comprehend their mechanisms.
Several experts have conducted numerical studies on the twisted-tape inserts. Ghadirijafarbeigloo et al. [5] investigated the effect of introducing louvered twisted-tape inside a PTR. The results revealed that, in comparison to the plain tube (PT) case, the Nusselt number (Nu) and friction factor (f) factors are 3.5 and 4.1, respectively, while the thermal enhancement factor (TEF) reaches 2.26. Chang et al. [6] analyzed the effect of varying clearness ratios and twisted ratios of twisted-tapes on (Nu) and (f) inside the PTR. The results showed that the maximum factors of the Nu and f can be 2.9 and 2.5 times greater than in the PT. Abbas et al. [7] used twisted-tapes with six different inclination angles inside the PTR. They found the thermal performance increased, especially when the inclination angle was 50°.
Also, a wide group of researchers has also studied the use of the fins inside the PTR to enhance thermal performance. Bellos et al. [8] examined how the length and thickness of longitudinal fins affect the increase of Nu and f within the PTR. In the optimal case, the thermal efficiency reached 68.8%, and the enhancements in Nu and f are 1.652 and 2.00, respectively, compared with the PT case. Laaraba and Mebraki [9] carried out a numerical calculation to ascertain the optimal number, length, and thickness of fins attached to the lower half of the PTR wall. The purpose of this is to enhance the thermal performance of the parabolic trough collector (PTC). They found that at a length of 15 mm and a thickness of 6 mm, the thermal efficiency increased by a maximum of 8.45%. In their paper, Fatouh et al. [10] described in detail a thermal model of adding fins (also known as base rounding) to PTR in order to find the Nu, f, thermal efficiency, and TEF for each model. The thermal model showed an increase in thermal efficiency, reaching 1.363%, and the maximum TEF is 1.644. Al-Aloosi et al. [11] numerically found that the value of Nu in the PTR with inserted fins increased by 51% compared with its value in the PT.
Moreover, various studies have been published to demonstrate the impact of several inserts on the hydraulic-thermal performance within the PTR. Bellos et al. [12] employed several cylindrical longitudinal inserts in the PTR to investigate fifteen scenarios and their impact on the transfer of heat using a CFD tool. The results showed a thermal efficiency improvement when using a higher number of inserts. Chang et al. [13] used a concentric rod and an eccentric rod to study the enhancement in Nu and f compared the PT. In the PTR with a concentric rod, the Nu increased from 1.10 to 7.42, and the value of TEF increased from 1.12 to 3.38 as the dimensionless diameter increased from 0.1 to 0.9. Jafar Kutbudeen et al. [14] experimentally worked to insert the conical strip inside the PTR to study the thermal performance of the PTC. The experimental results indicated that the maximum enhancement values of Nu (2.23%) and f (1.89%) happening in a PTR with a conical strip insert have a twisted ratio of 3. Allam et al. [15] have conducted an experimental investigation on enhancements in Nu and thermal efficiency inside the PTR using rotational helical shift. Their findings revealed that the maximum enhancements in the Nu and thermal efficiency are 2.42 and 46.5%, respectively, and the TEF is 1.24. Said et al. [16] evaluated the thermal performance of an evacuated tube of a PTC with a helical coil and using water as the HTF. They designed a PTC in the Parabolic Calculator 2.0 software and found that the modified tube had the highest value of thermal efficiency (72%).
Additional studies about using rings were presented by Chasemi and Ranjbar [17] and Ahmed and Natarajan [18]. The first group numerically tested the behavior of convective heat transfer in PTR by inserting porous rings at different distances and sizes. The results indicated that the Nu and f increase as the distance between the porous rings decreases and the size of the porous rings increases. The author group presented an investigation into the use of toroidal rings inside the PTR. They found the increase in thermal efficiency to be 3.74%, and the factors of the Nu and f are found to be 2.33 and 1.49, respectively.
The current state of the literature reveals that several studies have been published to evaluate improved heat transfer between PTR walls and HTF using multiple types of inserts. It was noted that there is an improvement in heat transfer by increasing the size or number of these inserts, but at the expense of pressure. Therefore, the primary objective of this work is to develop novel model inserts that can improve the transfer of heat while still ensuring optimal pressure within the PTR. These inserts are hollow cylindrical inserts (HCI) that contain a cross-shaped intersection to allow the HTF to pass through them. Thus, the HTF molecules collide with the inner walls of those inserts, and the cross-shaped shape increases the swirling movement, which also enhances the heat transfer process. To better understand heat transfer techniques, this study provides a numerical simulation of the fluid structure and thermal processes in PTC tubes fitted with inset turbulators using ANSYS Fluent 2020 R2.
An imaging-concentrating collector that projects a particular specific of the sun over the receiver is called a parabolic trough collector (PTC). The concentrator, a parabolic-shaped metallic surface, and the PTR, a stainless steel tube, comprise the majority of this collector. Figure 1 depicts the LS-1 PTC module, the solar collector under study.
The primary information concerning the PTC under examination that was entered into the ANSYS Fluent and Parabola Calculator software is contained in Table 1.
Figure 1. PTC geometry design in the CFD tool
Table 1. Characteristics of parts specifications of the PTC
|
Item |
Value / Type |
|
L [cm] |
200 |
|
$W_a$ [cm] |
100 |
|
$f_L$ [cm] |
25 |
|
$A_a$ [m2] |
2 |
|
Reflector material |
Aluminium |
|
$d_o$ [cm] |
5.1 |
|
$d_i$ [cm] |
4.7 |
|
Receiver material |
Stainless steel |
It is important to mention that the aperture area is 2 m² and the concentration ratio is 18.6. The reflectance of the reflector mirror surface is 83%, the absorbance of the stainless steel PTR is 96%, whereas the emittance of the PTR is given as [19]:
$\varepsilon=0.05599+1.039 \times 10^{-4} T_r+2.249 \times 10^{-7} T_r^2$ (1)
The HCI with different lengths (l), different thicknesses (t), and different numbers is inserted inside the PTR. The length takes the values (10, 20, 30, and 40 mm), the thickness is examined for the values (1, 2, 3, and 4 mm), and the numbers of HCI inside the PTR are (5, 10, and 15). The objective of this study is to examine the influence of these HCIs on the rate of heat transfer between the inner surfaces of the PTR and the HTF, which in this case is water, in addition to the amount of pressure inside the PTR after inserting the HCIs compared to the case of PT. Figure 2 shows the overall scenario of the HCIs, while Figure 3 showcases all the analyzed HCIs and PT examples.
Figure 2. The general case of the HCIs
Figure 3. All the examined HCIs cases and the PT case
The Navier-Stockes equations regulate the phenomena under investigation, and the model of k-ε realizable is the suitable turbulence model since it has been selected in several analogous investigations and was created by Patankar and Spalding [20]:
The continuity:
$\frac{\partial\left(\rho \bar{u}_i\right)}{\partial x_i}=0$ (2)
The momentum:
$\begin{gathered}\frac{\partial\left(\rho \bar{u}_i \bar{u}_j\right)}{\partial x_i} =\frac{\partial}{\partial x_j}\left[\mu\left(\frac{\partial \bar{u}_i}{\partial x_j}+\frac{\partial \bar{u}_j}{\partial x_i}\right)-\frac{2}{3} \mu \frac{\partial \bar{u}_i}{\partial x_i} \delta_{i j}-\rho \bar{u}_i \bar{u}_j\right]-\frac{\partial \bar{P}}{\partial x_i}\end{gathered}$ (3)
The energy:
$\begin{gathered}\frac{\partial\left(\rho \bar{u}_j c_p \bar{T}\right)}{\partial x_j}=\frac{\partial}{\partial x_j}\left(\lambda \frac{\partial \bar{T}}{\partial x_j}+\frac{\mu_T}{\delta_{h, T}} \frac{\partial\left(c_p \bar{T}\right)}{\partial x_j}\right)+ {\left[\bar{\mu}_j \frac{\partial P}{\partial x_j}+\mu\left(\frac{\partial \bar{u}_i}{\partial x_j}+\frac{\partial \bar{u}_j}{\partial x_i}\right)-\frac{2}{3} \mu \frac{\partial \bar{u}_i}{\partial x_i} \delta_{i, j}-\rho \bar{u}_i \bar{u}_j\right] \frac{\partial \bar{u}_i}{\partial x_j}}\end{gathered}$ (4)
The incident solar radiation on the reflector of a PTC is determined by multiplying the aperture area of the collector by the beam solar radiation [8, 10, 16]:
$Q_{ {inc }}=A_a I_b$ (5)
The area of the aperture ($A_a$) is calculated from [21]:
$A_a=\left(W_a-d_o\right) L$ (6)
The useful energy for heating the HTF will be calculated from the average outlet temperature of the HTF that is obtained from the CFD tool; hence, the useful energy is [12, 22]:
$Q_{u s e}=\dot{m} c_p\left(T_{f 0}-T_{f i}\right)$ (7)
The heat transfer coefficient between the PTR and the HTF can be estimated from [10]:
$h=\frac{Q_{ {use }}}{A_a\left(\bar{T}_w-T_b\right)}$ (8)
The balk temperature ($T_b$) of the HTF in Eq. (8) can be calculated from [10]:
$T_b=\frac{T_{f o}-T_{f i}}{2}$ (9)
Then, we can calculate the Nusselt number by [1, 10, 23]:
$N u=\frac{h}{k} d_i$ (10)
For circular tubes, the Reynolds number is given as [24]:
$\mathrm{Re}=\frac{4 \dot{m}}{\pi \mu d_i}$ (11)
The friction factor can be obtained from [23, 25]:
$f=\left(\frac{2 d_i}{L \rho u^2}\right) \Delta p$ (12)
The efficiency of PTC is defined as the amount of useful energy divided by the incident solar energy; it can be calculated from [9, 10, 21]:
$\eta=\frac{Q_{ {use }}}{Q_{ {inc }}}$ (13)
Hence,
$\eta=\frac{\dot{m} c_p\left(T_{f o}-T_{f i}\right)}{A_a I_b}$ (14)
The theoretical Nusselt number ($N u_{t h}$) and the theoretical friction factor ($f_{t h}$) to valid the PT can be estimated using the empirically measured correlation of Dittus-Boelter for a smooth-surfaced tube with turbulent flow [26]:
$N u_{\text {th }}=0.023 \mathrm{Re}^{0.8} \mathrm{Pr}^{0.4}$ (15)
$f_{\text {th }}=\frac{0.184}{\operatorname{Re}^{0.2}}$ (16)
Finally, a common method for determining the thermal enhancement factor (TEF), which is also a performance evaluation criteria (PEC), is by comparing the heat transfer coefficient between each tube and the PT. However, this method fails to account for the critical pressure drops that are essential to the system's sustainability when calculating this parameter directly. So, this factor is modified in order to compare the newly designed tubes with the PT under the identical operating conditions. The TEF is given as [22, 24]:
$T E F=\frac{\left[N u / N u_0\right]}{\left[f / f_0\right]^{1/ 3}}$ (17)
In this work, the investigated PTC models (the eleven HCI models and the PT model) were created in Solidworks and simulated in ANSYS Fluent (a CFD tool). These instruments can do optical, flow, and thermal analyses all at once. It is crucial to note that the present simulation tool has been utilized in several literature studies, mostly focusing on PTC [6-9, 17, 27, 28].
The following assumptions were made in the current investigation:
Table 2. Thermophysical proprieties of the HTF [17]
|
Properties |
Values |
|
$\rho$ [kg/m3] |
$=863+1.21 T_b-0.00257 T_b^2$ |
|
$\mu$ [N.s/m2] |
$=0.0007\left(\frac{315}{T_b}\right)^{5.5}$ |
|
$k$ [W/m.K] |
$=0.375+\left(8.84 \times 10^{-4}\right) T_b$ |
Table 3. Thermophysical proprieties of the PTR and the HCIs [18]
|
Properties |
Values |
|
$\rho$ [kg/m3] |
8030 |
|
$\mathrm{c}_p$ [J/kg.K] |
502.48 |
|
$k$ [W/m.K] |
16.27 |
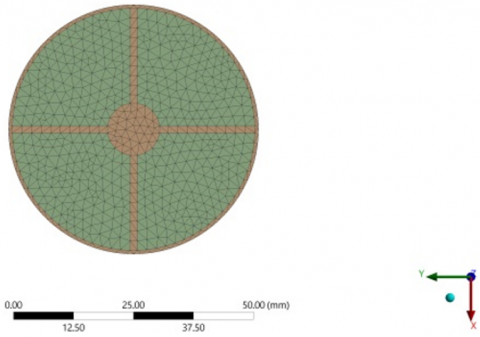
CFD tools are also used to construct the computational mesh. To construct an appropriate mesh, several criteria, such as the number of starting cells and the amount of refinement in solid, partial, and fluid cells, are appropriately adjusted. A variety of meshes are evaluated, and Table 4 provides a detailed report of the test findings. For the PT, five distinct mesh instances are looked at. The mass flow rate (MFR) was selected at 0.7 kg/s, and the input temperature was set at 300 K in these scenarios. Mesh 4, which contains approximately 1.2 million cells, due to its clear convergence of the output fluid. All of the HCI tubes have undergone grid independence tests (GIT), and each time a mesh consisting of around 1.5-1.9 million cells was found to be sufficient. The meshes for the PT (Figure 4(a)) and HCI case (Figure 4(b)), measure 40 mm in length, 4 mm in thickness, and 15 HCIs, are evaluated.
Table 4. Grid independence tests
|
Properties |
Mesh 1 |
Mesh 2 |
Mesh 3 |
Mesh 4 |
Mesh 5 |
|
Million cells |
0.215 |
0.423 |
0.605 |
1.212 |
1.532 |
|
$T_{f o}$ [K] |
308 |
316 |
322 |
325.5 |
325.6 |
|
Errore [%] |
- |
2.5 |
1.9 |
1.1 |
0.03 |
(a) Plain tube
(b) Hollow cylindrical inserts tube
Figure 4. Mesh in a cross section for PT and HCI’s tube
In this study, succinct convergence is achieved when the scaling residuals of energy, momentum, and continuity remain constant after an estimated 216 iterations. The scaled residuals' minimum values following these iterations equal (106), for the energy, continuity equation, and velocity quantities.
This section showcases the accuracy of the model, which underwent a validation test. More precisely, this work compares the model findings to the experimental correlations established by Dittus and Boelter in 1985. The model results are analysed for different Reynolds numbers by evaluating various mass flow rates ranging from 0.6 kg/s to 1.0 kg/s, while maintaining an input temperature of 300 K.
The results of the Nu of the PT case showed a mean deviation of -2.2% from the results of Eq. (15), as shown in Figure 5, whereas the results of the fraction factor of the PT case showed a mean deviation of 1.3% from the results of Eq. (16), as shown in Figure 6.
The observed variances were found to be negligible, suggesting that the data obtained from the PT exhibits a high level of dependability. Hence, the collected data may be used as a point of reference for assessing the performance of the tube when including the HCI.
Figure 5. Validation of Nusselt number for various Reynolds numbers
Figure 6. Validation of the fraction factor for various Reynolds numbers
It was made to install HCIs inside the PTR in order to e The design included the installation of HCIs inside the PTR to improve the thermal efficiency of the PTC. The purpose of including these HCIs is to enhance the heat transfer rate between the HTF and the PTR. By enhancing the mobility of the HTF and promoting collisions between it and the PTR's inner surface, we optimize the PTR's losses. The obtained results include the Nusselt number, friction factor, thermal efficiency, and temperature distributions.
The HTFs’ thermal properties, which are calculated by the equations in Table 2 at a temperature $T_{f i}=300 \mathrm{~K}$, are presented in Table 5.
Table 5. The thermal properties of water at $T_{f i}=300 \mathrm{~K}$
|
$\rho$ [kg/m3] |
$c_p$ [J/kg.K] |
$\mu$ [N.s/m2] |
$\boldsymbol{k}$ [W/m.K] |
|
994.7 |
4182 [18] |
0.000915 |
0.602 |
6.1 Effect of HCI’s length
To examine the impact of the length (l) of the HCIs on the Nu and f, its values varied from 10 mm to 40 mm with constant thickness (t = 2 mm) and number (N = 15).
Figure 7 displays the values of the $N u$ corresponding to various mass flow rates for varying lengths of HCIs while keeping the thicknesses and numbers of HCIs constant. As the mass flow rate increases, so does the $N u$. The $N u$ grows consistently as the lengths of the HCIs increase, which is a result of the larger surface area available for heat transfer between the PTR and the HTF. The $N u$ experiences the highest growth within the range of 132 to 296, specifically at a length of 40 mm. When the mass flow rate is 1 kg/s, the $N u$ reaches its maximum factor of 1.63.
Figure 7. Nusselt number with mass flow rates for different HCI’s lengths (t = 2 mm, and N = 15)
Figure 8 displays the values of f for various HCI lengths at a constant thickness and HCI number. It is noted that as MFR increases, f decreases, but at the same MFR, f increases as HCI’s length increases. At l = 40 mm, the greatest decrease in f is between 0.301 and 0.064. It indicates that the insertion of HCI has increased the pressure drop across the PTR's input and outflow.
Figure 8. Fraction factor with mass flow rates for different HCI’s lengths (t = 2 mm, and N = 15)
Figure 9 displays the thermal efficiency values corresponding to various MFRs for varied lengths of HCIs while maintaining constant thicknesses and numbers of HCIs. It has been noticed that there is a progressive rise in thermal efficiency as the MFR increases. Inserting HCIs at a MFR of 0.6 kg/s results in a 26.7% increase in thermal efficiency. Similarly, increasing the lengths of HCIs leads to a thermal efficiency boost ranging from 25% to 34.9%. Furthermore, the thermal efficiency and thermal efficiency factor reach up to 79% and 1.55, respectively, when the MFR is 1.0 kg/s.
Figure 9. Thermal efficiency with mass flow rates for different HCI’s lengths (t = 2 mm, and N = 15)
6.2 Effect of HCI’s thickness
The thickness (t) of HCIs was varied in the range (1-4 mm) to investigate its impact on the Nu and f inside the PTR for a constant number (N =15) and a constant length (l =40 mm).
Figure 10 illustrates the changes in the Nu as MFRs vary, taking into account the varied thickness values of HCI. The inclusion of HCIs has been seen to increase Nu due to enhanced heat exchange occurring between the HTF and the PTR. The enhanced heat exchange between the HTF and the PTR causes the inclusion of HCIs to increase Nu. Inserting the HCIs at a MFR of 0.6 kg/s increases the Nu by 5.6%. This increase becomes greater as the MFR increases, reaching up to 48.4% at a MFR of 1.0 kg/s.
Figure 10. Nusselt number with mass flow rates for different HCI’s thickness (l = 40 mm, and N = 15)
On the other hand, as the thickness of the HCI gradually increases, the Nu steadily rises. The highest enhancement values in the Nu (at a MFR of 1.0 kg/s) are 9.6%, 0.68%, and 0.03% for t = 2, 3, and 4 mm, respectively. The results indicate that the thickness has a negligible effect, particularly after t = 2 mm.
Figure 11 shows the variations of the f with MFRs for various HCI thicknesses at a constant number (N = 15) and a fixed length (l = 40 mm). It has been noted that the f increases by ten times compared with the PT case. An increment in the thicknesses of the HCIs leads to a progressive rise in the f. The increase in the f reaches up to 8.8% by comparing the PTR with the maximum and minimum thickness of HCI, whereas the increase in the f reaches up to 91.5% by comparing the PTR with t = 2 mm and the PT case at a MFR of 0.6 kg/s. Furthermore, when comparing the PTR with thicknesses of t= 2, and 4 mm at all tested MFRs, the average increase in the f is found to be less than 1%. Therefore, after t = 2 mm, the impact of the HCI's thickness will be insignificant.
Figure 11. Fraction factor with mass flow rates for different HCI’s thickness (l = 40 mm, and N = 15)
The changes in the PTC's thermal efficiency with the MFRs of the HTF for different HCI thicknesses are shown in Figure 12. This figure indicates that increasing the thickness of the HCI leads to a mean increase in thermal efficiency of about 18%, while inserting the HCIs inside the PTR enhances the thermal efficiency by 35% when compared to the PT case. The maximum value of thermal efficiency recorded is 79% at t = 2 mm. After this value of HCI’s thickness, the effect of increasing thickness becomes less important.
Figure 12. Thermal efficiency with mass flow rates for different HCI’s thickness (l = 40 mm, and N = 15)
6.3 Effect of HCI’s number
The number of HCIs was changed from 5 to 15 to show its impact on the heat transfer rate and pressure drop inside the PTR at a fixed length (l =40 mm) and a fixed thickness (t =2 mm).
For a range of HCI numbers, Figure 13 illustrates how the Nu varies with MFRs. The addition of HCIs to the PTR raises the Nu due to increased heat exchange between the HTF and the PTR, and this Nu rises steadily as the number of HCIs increases. The increasing number of HCIs from 5 to 15 results in a 4% increase in the Nu.
Figure 13. Nusselt number with mass flow rates for different HCI’s number (l = 40 mm, and t = 2 mm)
Figure 14 illustrates the relationship between the f and MFRs for various numbers of HCIs. The inclusion of HCIs in the PTR results in a substantial enhancement of the f, which reached up to 87.3% at a MFR of 0.6 kg/s. By increasing the MFR of the HTF, this difference gradually decreases to approximately 54% in the same case, as an increase in MFR leads to a decrease in the f.
Figure 14. Fraction factor with mass flow rates for different HCI’s number (l = 40 mm, and t = 2 mm)
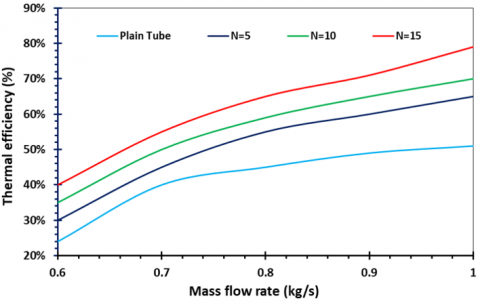
Figure 15. Thermal efficiency with mass flow rates for different HCI’s thickness (l = 40 mm, and t = 2 mm)
Figure 15 depicts the changes in the PTC’s thermal efficiency as the mass flow rates of the HTF vary, with varied numbers of HCI. Based on the data presented, when the number of HCIs is increased from 5 to 15, the thermal efficiency factor reaches 1.22.
6.4 Outlet temperature distributions of the HTF
Figure 16 displays the PT's temperature contour; the HTF's outlet temperature is 325.5 K. As seen, when the HTF flows into the PTR, it will initially begin to heat slowly from the PTR’s upper surface due to the beam solar radiation and the PTR’s lower surface due to the concentrated solar radiation, but the temperature of the HTF is not uniformly distributed. The maximum temperature of the HTF outlet surface was observed to be close to the wall temperature because there is no active or passive technology that can improve the heat transfer of fluid inside the PTC tube.
Figure 16. CFD result of temperature contour of the first model tube (PT)
Figure 17. CFD of temperature contour for: (a) tube with l = 40 mm, t = 2 mm, N = 5, (b) tube with l = 40 mm, t = 2 mm, N = 10, and (c) tube with l = 40 mm, t = 2 mm, N = 1
Figure 17(a) displays the tube's temperature contour with l = 40 mm, t = 2 mm, and N = 5. The outlet temperature has been observed to be slightly increasing compared with the PT, which recorded 330.6 K. Figure 17(b) shows the tube's temperature contour with l = 40 mm, t = 2 mm, and N = 10. The outlet temperature increased compared with the previous tubes, reaching 337.5 K. Figure 17(c) demonstrates the temperature contour of the tube with l = 40 mm, t = 2 mm, and N = 15. The outlet temperature recorded the best value from the previous models (339.7 K).
This work investigates the use of hollow cylindrical inserts inside the PTR. In addition to the PT, a total of eleven modified PTRs have been constructed and subjected to simulation. The study is conducted utilizing the Nusselt number (heat transfer rate), the fraction factor (pressure drop), and the thermal efficiency. The key findings of this study are outlined below:
The hollow cylindrical inserts inside the PTR can dramatically improve the hydraulic-thermal system and increase the temperature field's uniformity.
Based on the simulated results, the studied parameters have an effect on the heat transfer rate, pressure drop, and thermal efficiency, especially the length and number of hollow cylindrical inserts.
The optimal tube has 15 hollow cylindrical inserts with a 40 mm length and a 2 mm thickness. In this tube, the maximum enhancement in the Nusselt number and fraction factor are 1.63 and 1.33 times compared with the PT. Also, the thermal enhancement factor is calculated to be 1.73, and the increase in thermal efficiency is 54%.
As a result, inserts have comparable results in improving the collector's thermal efficiency. This method offers benefits in comparison to the utilization of interior fins since it can be implemented on the current PTC without any alterations to the PTR, which are linked to several operational difficulties. In future investigations, it would be beneficial to compare this study with experimental research to validate and explore additional factors that improve heat transport within the PTR.
The authors thank Dr. Aws Al-Akam from the University of Babylon for providing the computer simulator.
[1] Gharzi, M., Kermani, A.M., Shamsabadi, H.T. (2023). Experimental investigation of a parabolic trough collector-thermoelectric generator (PTC-TEG) hybrid solar system with a pressurized heat transfer fluid. Renewable Energy, 202: 270-279. https://doi.org/10.1016/j.renene.2022.11.110
[2] Madiouli, J., Lashin, A., Shigidi, I., Badruddin, I.A., Kessentini, A. (2020). Experimental study and evaluation of single slope solar still combined with flat plate collector, parabolic trough and packed bed. Solar Energy, 196: 358-366. https://doi.org/10.1016/j.solener.2019.12.027
[3] Abdulhamed, A.J., Adam, N.M., Ab-Kadir, M.Z.A., Hairuddin, A.A. (2018). Review of solar parabolic-trough collector geometrical and thermal analyses, performance, and applications. Renewable and Sustainable Energy Reviews, 91: 822-831. https://doi.org/10.1016/j.rser.2018.04.085
[4] Mousavi Ajarostaghi, S.S., Zaboli, M., Javadi, H., Badenes, B., Urchueguia, J.F. (2022). A review of recent passive heat transfer enhancement methods. Energies, 15(3): 986. https://doi.org/10.3390/en15030986
[5] Ghadirijafarbeigloo, S., Zamzamian, A., Yaghoubi, M. (2014). 3-D numerical simulation of heat transfer and turbulent flow in a receiver tube of solar parabolic trough concentrator with louvered twisted-tape inserts. Energy Procedia, 49: 373-380. https://doi.org/10.1016/j.egypro.2014.03.040
[6] Chang, C., Xu, C., Wu, Z., Li, X., Zhang, Q., Wang, Z. (2015). Heat transfer enhancement and performance of solar thermal absorber tubes with circumferentially non-uniform heat flux. Energy Procedia, 69: 320-327. https://doi.org/10.1016/j.egypro.2015.03.036
[7] Abbas, M.F., Ibrahim, K., Aljanabi, A.F.K. (2021). Modeling and simulation to investigate the thermal efficiency of a parabolic solar trough collector with absorber tube inserted twisted tape system. AURUM Journal of Engineering Systems and Architecture, 5(1): 65-88. https://doi.org/10.53600/ajesa.925830
[8] Bellos, E., Tzivanidis, C., Tsimpoukis, D. (2017). Multi-criteria evaluation of parabolic trough collector with internally finned absorbers. Applied Energy, 205: 540-561. https://doi.org/10.1016/j.apenergy.2017.07.141
[9] Laaraba, A., Mebarki, G. (2020). Enhancing thermal performance of a parabolic trough collector with inserting longitudinal fins in the down half of the receiver tube. Journal of Thermal Science, 29(5): 1309-1321. https://doi.org/10.1007/s11630-020-1256-8
[10] Fatouh, M., Saad, N., Abdala, A.M. (2022). Effects of fins base rounding on heat transfer characteristics of absorber tube of parabolic trough collector. Arabian Journal for Science and Engineering, 48(3): 2851-2871. https://doi.org/10.1007/s13369-022-06948-6
[11] Al-Aloosi, W., Alaiwi, Y., Hamzah, H. (2023). Thermal performance analysis in a parabolic trough solar collector with a novel design of inserted fins. Case Studies in Thermal Engineering, 49: 103378. https://doi.org/10.1016/j.csite.2023.103378
[12] Bellos, E., Daniil, I., Tzivanidis, C. (2018). Multiple cylindrical inserts for parabolic trough solar collector. Applied Thermal Engineering, 143: 80-89. https://doi.org/10.1016/j.applthermaleng.2018.07.086
[13] Chang, C., Sciacovelli, A., Wu, Z., Li, X., Li, Y., Zhao, M., Deng, J., Wang, Z., Ding, Y. (2018). Enhanced heat transfer in a parabolic trough solar receiver by inserting rods and using molten salt as heat transfer fluid. Applied Energy, 220: 337-350. https://doi.org/10.1016/j.apenergy.2018.03.091
[14] Jafar Kutbudeen, S., Arulprakasajothi, M., Beemkumar, N., Elangovan, K. (2019). Effect of conical strip inserts in a parabolic trough solar collector under turbulent flow. Energy Sources, Part A: Recovery, Utilization, and Environmental Effects, 44(1): 2556-2568. https://doi.org/10.1080/15567036.2019.1650850
[15] Allam, M., Tawfik, M., Bekheit, M., El-Negiry, E. (2022). Experimental investigation on performance enhancement of parabolic trough concentrator with helical rotating shaft insert. Sustainability, 14(22): 14667. https://doi.org/10.3390/su142214667
[16] Said, S., Mellouli, S., Alqahtani, T., Algarni, S., Ajjel, R. (2023). New evacuated tube solar collector with parabolic trough collector and helical coil heat exchanger for usage in domestic water heating. Sustainability, 15(15): 11497. https://doi.org/10.3390/su151511497
[17] Ghasemi, S.E., Ranjbar, A.A. (2017). Numerical thermal study on effect of porous rings on performance of solar parabolic trough collector. Applied Thermal Engineering, 118: 807-816. https://doi.org/10.1016/j.applthermaleng.2017.03.021
[18] Ahmed, K.A., Natarajan, E. (2019). Thermal performance enhancement in a parabolic trough receiver tube with internal toroidal rings: A numerical investigation. Applied Thermal Engineering, 162: 114224. https://doi.org/10.1016/j.applthermaleng.2019.114224
[19] Behar, O., Khellaf, A., Mohammedi, K. (2015). A novel parabolic trough solar collector model-validation with experimental data and comparison to Engineering Equation Solver (EES). Energy Conversion and Management, 106: 268-281. https://doi.org/10.1016/j.enconman.2015.09.045
[20] Patankar, S.V., Spalding, D.B. (1972). A calculation procedure for heat, mass and momentum transfer in three-dimensional parabolic flows. International Journal of Heat and Mass Transfer, 15: 1787-1806. https://doi.org/10.1016/B978-0-08-030937-8.50013-1
[21] Duffie, J. A., Beckman, W.A., Blair, N. (2020). Solar Engineering of Thermal Processes, Photovoltaics and Wind (5th ed.). New Jersey: John Wiley & Sons.
[22] Stanek, B., Ochmann, J., Węcel, D., Bartela, Ł. (2023). Study of twisted tape inserts segmental application in low-concentrated solar parabolic trough collectors. Energies, 16(9): 3716. https://doi.org/10.3390/en16093716
[23] Roohi, R., Arya, A., Akbari, M., Amiri, M.J. (2023). Performance evaluation of an absorber tube of a parabolic trough collector fitted with helical screw tape inserts using cuo/industrial-oil nanofluid: A computational study. Sustainability, 15(13): 10637. https://doi.org/10.3390/su151310637
[24] Singh, R.K., Chandra, P. (2023). Parabolic trough solar collector: A review on geometrical interpretation, mathematical model, and thermal performance augmentation. Engineering Research Express, 5(1): 012003. https://doi.org/10.1088/2631-8695/acc00a
[25] Taha, M.J., Kibret, F.B., Ramayya, V., Zeru, B.A. (2021). Design and evaluation of solar parabolic trough collector system integrated with conventional oil boiler. Archives of Electrical Engineering, 70(3): 657-673. https://doi.org/10.24425/aee.2021.137580
[26] Dittus, F.W., Boelter, L.M.K. (1985). Heat transfer in automobile radiators of the tubular type. International Communications in Heat and Mass Transfer, 12(1): 3-22. https://doi.org/10.1016/0735-1933(85)90003-X
[27] Shaker, B., Gholinia, M., Pourfallah, M., Ganji, D.D. (2022). CFD analysis of Al2O3-syltherm oil Nanofluid on parabolic trough solar collector with a new flange-shaped turbulator model. Theoretical and Applied Mechanics Letters, 12(2): 100323. https://doi.org/10.1016/j.taml.2022.100323
[28] Samiezadeh, S., Khodaverdian, R., Doranehgard, M.H., Chehrmonavari, H., Xiong, Q. (2022). CFD simulation of thermal performance of hybrid oil-Cu-Al2O3 nanofluid flowing through the porous receiver tube inside a finned parabolic trough solar collector. Sustainable Energy Technologies and Assessments, 50: 101888. https://doi.org/10.1016/j.seta.2021.101888