Zhijie Xia![]() | Mengjun Huang*
| Mengjun Huang*![]()
© 2024 The authors. This article is published by IIETA and is licensed under the CC BY 4.0 license (http://creativecommons.org/licenses/by/4.0/).
OPEN ACCESS
Under the impetus of national energy-saving and emission-reduction policies, electric vehicles (EVs) are increasingly entering the mainstream automotive market, signaling the gradual decline of the internal combustion engine era. However, the challenge of extending the range of EVs remains substantial. Addressing this core obstacle necessitates a dual approach: advancing battery technology and optimizing aerodynamic performance through streamlined design to reduce drag and enhance driving stability. This approach is crucial for enhancing the competitiveness of car manufacturers, expanding the market penetration of EVs, and supporting environmental sustainability. This study concentrates on pure EVs, employing three-dimensional, steady-state, incompressible fluid mechanics principles alongside advanced FLUENT simulation tools to systematically evaluate the external flow characteristics and overall aerodynamic efficiency of the vehicle. The research integrates streamlined design concepts, implementing micro-level aerodynamic modifications to the vehicle body structure to maximize driving efficiency. By combining precise computational fluid dynamics (CFD) simulations with empirical wind tunnel testing, the direct impact of design changes on the vehicle's aerodynamic performance is meticulously analyzed. Highlights of the research include the utilization of a 1:25 scale accurately scaled 3D printed vehicle model and comprehensive aerodynamic evaluations conducted in a low-speed wind tunnel laboratory using a direct-current suction-type wind tunnel device. This methodology robustly verifies the accuracy of simulation predictions, providing scientific evidence and practical guidance for further exploring the application of streamlined design in enhancing the aerodynamic performance of EVs. Consequently, this research is expected to accelerate advancements at the technological frontier of the field.
electric vehicles (EVs), aerodynamic performance, streamlined design, battery technology, computational fluid dynamics (CFD)
As living standards continue to improve and advanced technologies such as the internet and artificial intelligence develop rapidly, higher demands are being placed on the performance of automotive products. Aerodynamic performance, one of the most critical aspects of vehicle performance, directly influences overall power efficiency, fuel consumption, driving comfort, and the stability of chassis-related handling [1]. In this context, aerodynamic optimization becomes crucial in automotive design. The European Union aims to ban the sale of all ICE vehicles by 2035 to meet the low emission targets outlined in the European Green Deal [2]. The European Green Deal sets a limit on future global temperature increases. In the transportation sector, the emergence of EVs is the most significant indicator of progress towards achieving these goals [3].
Aerodynamics studies the interactions between air and objects. When applied to automotive design, it primarily involves reducing air resistance and optimizing airflow. Through meticulous design of the vehicle's shape and structure, the aerodynamic drag coefficient can be significantly reduced during driving, thereby decreasing fuel consumption and emissions [4]. Good aerodynamic design not only improves fuel economy but also enhances vehicle stability and safety during driving. Streamlined design helps reduce turbulence and vortex formation around the vehicle body, enhancing stability and handling at high speeds [5]. Additionally, aerodynamic optimization can reduce wind noise, thereby improving driving comfort.
There have been some interesting studies on the energy performance of EVs over the past decade, with a particular focus on increasing their driving range. Mruzek et al. identified vehicle weight, motor size, and aerodynamic drag coefficient as key factors influencing EV performance [6]. The authors concluded that vehicle weight contributes to the largest energy loss, although driving style also plays an important role. Szumska and Jurecki pointed out that the distance a vehicle can travel is directly related to the vehicle's design, the operator's driving style, and the surrounding conditions [7]. Vehicle design includes factors such as aerodynamic drag coefficient and rolling resistance coefficient [8].
With the deepening implementation of energy-saving and emission-reduction policies, air resistance at high speeds has become a focal point of concern. Traditional vehicles overcome driving resistance and propel forward by converting the thermal energy from combustion into mechanical energy [9]. Vehicle driving resistance is primarily divided into four components: rolling resistance, acceleration resistance, gradient resistance, and air resistance [10]. When driving at a constant speed on flat roads, vehicles mainly overcome rolling resistance from the ground and air resistance generated by airflow. During uphill conditions, vehicles need to overcome gradient resistance caused by gravity in the direction of the slope. During acceleration, they must also overcome acceleration resistance. The classification of vehicle driving resistance is illustrated in Figure 1.
Figure 1. Vehicle driving resistance classification diagram
Air resistance is the largest component of resistance encountered by vehicles during driving. For cars traveling at high speeds, when the speed exceeds 60 km/h, approximately 30-40% of energy is consumed in overcoming air resistance. The process of airflow separation attached to the vehicle's surface is slow, and the airflow speed decreases at the rear, resulting in increased pressure. This reduces the pressure differential between the front and rear of the vehicle, thereby achieving a reduction in drag [11]. The distribution of the speed flow field around the entire vehicle is shown in Figure 2. Previous studies have shown that the energy consumed by the vehicle is proportional to the cube of its speed [12, 13]. Numerous experiments have also revealed that at a driving speed of 80 km/h, air resistance accounts for about 60% of the total resistance, and when the speed reaches 200 km/h, the proportion of air resistance exceeds 85%.
Due to the limitations of battery performance, EVs are even more sensitive to air resistance. To fully promote EVs, it is essential not only to master more advanced battery technology but also to design vehicles with shapes that are more aerodynamic [14]. According to BMW's data, nearly 40% of the resistance is generated by the shape and proportions of the vehicle body, 30% by the wheel wells, 20% by the underbody, and the remaining 10% is due to the air intake needed for cooling the engine and other components. Many of the latest EVs on the market have eliminated the front grille to reduce this 10% internal resistance [15]. Therefore, further optimization of air resistance can start with the vehicle body shape, which is the main focus of most current research. Researchers have identified aerodynamic drag force, tire rolling resistance force, and gradient resistance force as crucial parameters related to vehicle energy consumption. The study further highlights that the force due to aerodynamic drag is one of the most significant factors when considering energy loss, as vehicle speed and aerodynamic drag coefficient substantially influence this force. The impact of speed is particularly notable because it increases exponentially [16]. Another critical factor affecting vehicle energy consumption is its rolling resistance. Calculating this force is complex due to the challenges in measuring the rolling resistance coefficient. Edjerment and Ockzalzac pointed out this issue, noting that numerous factors, such as different road surfaces and temperatures experienced by the tires, can affect this coefficient.
Figure 2. Vehicle speed flow field distribution cloud diagram
Designing EVs with excellent shapes and low drag coefficients is not only crucial for energy conservation and emission reduction but also fosters the development of the EV industry and helps establish a leading global position for the automotive industry. Current research primarily utilizes numerical simulations and wind tunnel experiments to study aerodynamic performance. Although wind tunnel experiments are theoretically the most accurate and closest to real-world conditions, they require substantial time and financial investment for initial setup and have lengthy testing cycles, which are not conducive to the rapid design and production cycles of modern enterprises.
Since the turn of the century, the rapid advancement of computer technology has led to the widespread adoption of CFD in automotive design, development, verification, and maintenance. CFD has become the mainstream method in the automotive industry. Combining CFD technology with wind tunnel experiments allows for cross-verification, timely problem detection, and significantly shorter design and improvement cycles, thereby reducing research and development costs. This combined approach provides a more efficient and economical solution for the design of EVs.
2.1 Streamlined design
Animals in nature, such as birds flying in the air, fish swimming in water, and mammals running swiftly on land, have developed exceptionally streamlined shapes and excellent aerodynamic characteristics through millions of years of evolution. Automobiles, as fast-moving land vehicles, share significant similarities in shape and aesthetic expression with these natural creatures. Consequently, automotive design often draws inspiration from these natural forms.
Streamlined design refers to a design methodology aimed at optimizing the shape of an object to minimize resistance when it moves through a fluid (usually air or water) [17]. The core objective of streamlined design is to reduce fluid resistance, lower energy consumption, and thereby improve movement efficiency. This design approach is widely applied in the design of vehicles such as cars, airplanes, trains, and ships to enhance speed, save fuel, and improve stability [18]. After World War II, the prominence of streamlined design in automobile manufacturing seemed to decline, with fewer manufacturers adopting this style. However, the influence of streamlined design persisted, as the integration of automotive body shapes remains a design standard derived from streamlined design principles [19]. To this day, all automotive designers benefit greatly from the pioneers who developed streamlined designs. Automotive drag reduction technology based on morphological biomimicry directly borrows from natural organisms. By analyzing the shapes of bionic prototypes and understanding their fluid dynamics characteristics and low drag coefficients, similar shape trends can be applied to automotive design. This approach effectively reduces aerodynamic drag in vehicles [20].
2.2 Research on drag reduction in automotive aerodynamics
Automobile aerodynamics, which is derived from the broader field of aerodynamics, is a significant segment of aerodynamic theory. It comprehensively explores the patterns of interaction and forces between a vehicle and the surrounding airflow, falling within the domain of fluid dynamics [21]. This area of study primarily focuses on the aerodynamic performance (drag reduction) of various vehicles, including passenger cars, SUVs, and race cars. It also examines vehicle aerodynamic noise, sunroof wind vibration, external surface pollutant control, rainwater management, wading performance, headlight fogging, crosswind stability, and brake cooling performance [22].
As early as 2005, Mercedes-Benz introduced a bionic concept car inspired by the boxfish from the ocean, as shown in Figure 3. This car became a classic example of bionic drag reduction design in automotive form the study [23]. The boxfish, which inhabits the tropical coral reefs, has a box-like shape but boasts a remarkably low drag coefficient of just 0.06. The unique living environment of the boxfish necessitates minimal energy expenditure during movement, resulting in robust muscles and a streamlined body. Its frequent navigation and collisions within coral reefs have led to a highly rigid body surface capable of withstanding significant pressure. Most importantly, the Boxfish’s box-like body cross-section is very similar to that of a car, providing advantageous conditions for bionic automotive design.
Additionally, the Mercedes-Benz research team discovered that the boxfish's skin is composed of numerous small hexagonal bony plates. This structure imparts high surface hardness and protection from injury, a characteristic that was fully utilized in the later structural design of the car.
Figure 3. Mercedes-Benz concept bionic design
Following numerical simulations and wind tunnel tests on the simplified model of the boxfish, the Mercedes-Benz design team identified the structure of its external flow field and the fundamental reasons for its low drag coefficient. Guided by these findings, they completed the design of a simplified car model and experimentally determined its drag coefficient to be 0.095. This further validated the feasibility of incorporating the overall shape of the boxfish into bionic automotive design. Due to the similar proportions and smooth, flowing lines of both models, the concept car effectively retained and conveyed the characteristics of the bionic prototype while achieving excellent aerodynamic performance [24].
In the early stages of new vehicle development projects, optimizing the external shape of the entire vehicle to reduce overall drag is the most economical and effective means of saving energy and reducing consumption. By observing, capturing, and analyzing the surface structures of animals and plants, researchers can understand their textures and specific functional effects. This knowledge can be fully utilized in real-life and production practices by leveraging the organizational structure and tactile textures of natural materials. This approach aims to create artificial materials that visually and tactilely evoke similar functional effects and associations with natural objects [25]. Research on drag reduction using non-smooth surfaces is a crucial aspect of this field. Various theories on non-smooth surface drag reduction have been proposed, and non-smooth surfaces have begun to be applied in automotive design. The primary research method involves designing the shapes and structures of non-smooth surfaces to control the boundary layer structure near the wall, ultimately achieving drag reduction. Based on bionic theory, researchers such as Song and Zhou proposed a model with variant ovoid dimple structures. This model is geometrically defined by three size parameters: radius, semi-axis, and pit depth. Using a parametric construction approach, they studied the impact of the variant ovoid structure parameters on the frictional resistance of the vehicle surface [26].
Scholars have conducted various studies using numerical simulations and wind tunnel experiments. Bonnet and Fritz [27] utilized wind tunnel and road tests to determine the aerodynamic drag coefficient changes of two trucks driving in a convoy, both unloaded and fully loaded, as the distance between the two vehicles increased. They also calculated the impact on fuel economy. Watkins and Vino [28] used the Ahmed model to measure the aerodynamic drag coefficient through wind tunnel tests, with spacing variations between 0 and 4 times the model length. They demonstrated the airflow states under different conditions using smoke flow visualization. Davila et al. [29] studied the aerodynamic characteristics of two trucks and three cars driving in a convoy with distances of 3 m, 6 m, and 15 m between them.
Aerodynamic performance development spans the entire automotive R&D process. The simulation of aerodynamic performance begins at the conceptual design stage, during which participants participate in discussions to ensure that the vehicle design meets low-drag performance constraints. Combining CFD simulations, wind tunnel tests, and road tests ensures that the aerodynamic performance goals of the vehicle are achieved.
2.3 Aerodynamic design of EVs
The automotive industry's diverse development and competition among numerous manufacturers are inevitable outcomes of technological progress, with car design representing the fusion of contemporary advanced science and art. While artistic factors may vary among different countries' standards, technological factors are objective and visible. Therefore, in car body design, technical factors often have a decisive influence, with more advanced technology leading to more rational and aesthetically pleasing designs.
Looking back at the evolution of combustion engine vehicles' designs, from the earliest carriage-like automobiles to the common wedge-shaped cars of today, each period's design changes reflect people's understanding of aerodynamics research results. The outcome has been a significant reduction in vehicle drag, but it has not yet reached an ideal state. Although EVs have undergone considerable internal structural changes compared to traditional combustion engine vehicles, their body designs still largely follow tradition, and aerodynamics research theories are equally applicable to EVs. Due to the limitations of battery technology, reducing drag is more urgent for EVs than for conventional fuel vehicles. Electric vehicle design must adhere to aerodynamic requirements, primarily manifested in the following aspects:
(1) EVs' front faces are ideally designed using biomimicry, such as mimicking the streamlined structure of fish, which can effectively reduce resistance [30]. However, in practical design, vehicles cannot be shaped like fish with an overall streamlined curve. They must be equipped with various functional components, such as headlights, windshield wipers, etc. Although this partially affects the magnitude of resistance and cannot achieve the ideal design entirely, it provides people with an optimized design concept. That is, efforts should be made to avoid protrusions in small areas and the impact of unnecessary accessories on EVs [31]. The best confirmation of this design concept is that most of the new EVs on the market have eliminated door handles and air intakes to pursue lower aerodynamic drag.
(2) In aerodynamics theory, there are three main factors that influence the aerodynamic characteristics between the windshield and the front of the vehicle: the angle between the engine hood and the windshield, the curvature and structure of the front end, and the curvature and structure of the windshield. As EVs eliminate the need for an engine, their redesign significantly affects the entire vehicle and interior space, posing a challenge to designers. However, overall, the front end can be designed to be relatively shorter with a greater inclination angle. This allows for an increased angle between the windshield and the front, thereby reducing resistance. Additionally, it can expand the field of vision of the front end, enhancing safety during driving [32].
(3) The shape of the roof has a significant impact on aerodynamic characteristics. Designing the roof with a gradually upward-curving shape is not only for passenger convenience but also to allow smooth airflow over the roof. However, the degree of curvature of the roof should not be too large. This is because the aerodynamic drag of a vehicle is directly proportional to the projected frontal area. Excessive curvature of the roof can increase the frontal projected area and may also lead to airflow separation phenomena on the roof, which not only fail to reduce drag but may even increase it [33]. Therefore, in the design process, it is necessary to consider the curvature of the roof, aiming to minimize drag while ensuring aesthetics and practicality.
Electric vehicle manufacturers have adopted various cutting-edge technologies and methods in aerodynamic optimization, including biomimetic design, optimization of the front end and windshield, roof shape design, CFD, active aerodynamics systems, as well as new materials and surface treatment technologies. These innovative technologies, when combined, significantly enhance the range, performance, and user experience of EVs, providing ample opportunities for future automotive design.
3.1 CFD simulation
Benefiting from the rapid development of computers, fluid dynamics has witnessed a breakthrough, with fluid models becoming increasingly complex and precise, leading to the emergence of a new discipline - CFD [34]. CFD has established various control equations suitable for different characteristics of fluids, which have been widely applied, especially in the automotive industry. By analyzing the aerodynamic characteristics of vehicles under airflow using the principles and methodologies of fluid dynamics, the impact of airflow on vehicle dynamics, fuel efficiency, and driving comfort can be determined, thus identifying methods to improve overall vehicle performance. Currently, three main methods are employed for the development and research of vehicle aerodynamics [35]: theoretical analysis, numerical computation, and experimental validation, which provide robust technical support for the scientific optimization of vehicle aerodynamics.
Fluid dynamics adheres to fundamental conservation laws, namely the laws of conservation of mass, momentum, and energy. These three basic physical laws are expressed mathematically through the mass equation, the momentum equation, and the energy equation [36].
(1) Mass Equation in Fluid Mechanics
The mass equation is one of the fundamental principles in fluid mechanics, representing the transformation of the law of conservation of mass in physics into fluid mechanics, primarily due to the continuous nature of fluids typically dealt with in early fluid mechanics. The form of the mass equation for incompressible fluids is as follows:
$\frac{\partial u}{\partial x}+\frac{\partial v}{\partial y}+\frac{\partial w}{\partial z}=0$
The momentum equation in fluid mechanics stands as one of the most pivotal equations governing fluid flow. Applying Newton's second law to fluid mechanics problem-solving, it is often referred to as the "equation of motion" or "dynamics equation." The principle guiding the momentum equation is that the sum of the volume forces and surface forces acting on a control volume is equal to the time rate of change of total momentum. In the absence of fluid viscosity considerations, the differential form of the momentum equation, known as the Navier-Stokes equation, is expressed as follows:
$\begin{aligned} & \rho \frac{\partial u}{\partial t}+\rho \cdot \operatorname{div}(u U)=\operatorname{div}(\mu \cdot \operatorname{grad} u)-\frac{\partial \rho}{\partial x}+S_{M x} \\ & \rho \frac{\partial v}{\partial t}+\rho \cdot \operatorname{div}(v U)=\operatorname{div}(\mu \cdot \operatorname{grad} v)-\frac{\partial \rho}{\partial y}+S_{M y} \\ & \rho \frac{\partial w}{\partial t}+\rho \cdot \operatorname{div}(w U)=\operatorname{div}(\mu \cdot \operatorname{grad} w)-\frac{\partial \rho}{\partial z}+S_{M z}\end{aligned}$
The energy equation in fluid mechanics represents the transformation of the first law of thermodynamics, namely the conservation of energy law, into fluid processes. When fluids flow and there is heat exchange between fluids or between fluids and solids, the thermal effects cannot be ignored. Therefore, fluid flow must not only satisfy the mass equation and the momentum equation but also adhere to the principle of energy conservation.
In this study, the variation of energy in the airflow over time is equivalent to the sum of the time rate of change of forces and the total heat transfer during this process. Thus, for incompressible fluid mechanics, the energy equation is expressed as:
$\begin{gathered}\rho \frac{\partial e}{\partial t}+\rho \frac{\partial\left(u_j h\right)}{\partial x_j}=\operatorname{div}(k \cdot \operatorname{grad} T)+\frac{\partial u_j t_{j j}}{\partial x_j} \\ h=e+\frac{1}{2}\left(u_1^2+u_2^2+u_3^2\right)+\frac{P}{\rho}\end{gathered}$
During the design phase, numerical calculation methods are typically employed to optimize the overall drag coefficient of the vehicle. Subsequently, in conjunction with clay models, aerodynamic performance optimization is conducted in automotive wind tunnels [37]. Throughout this process, it is crucial to assess the impact of local variations in the vehicle's body shape on drag through extensive simulation calculations and wind tunnel tests. The accuracy of simulation results and the effectiveness of drag reduction optimization strategies largely rely on past engineering experience [38].
Today, due to cost constraints and the significant influence of traditional gasoline vehicle design principles, a considerable portion of EVs available on the market are modifications of conventional vehicles. As a result, they may not fully exploit the advantages of EVs over traditional gasoline vehicles. Moreover, even new designs tend to be relatively conservative in their styling, often failing to break away from conventional design paradigms.
Based on fluid dynamics equations, the geometric model of the entire vehicle is established, and surface and volume meshing are performed. Boundary conditions are set, and the overall drag coefficient of the vehicle is calculated. Fluid simulation calculations must adhere to the principles of mass conservation, momentum conservation, and energy conservation. The main focus is on optimizing the body surfaces, summarizing the patterns of surface variations, and exploring the aerodynamic performance of the vehicle.
To simplify calculations and save simulation time, the following basic assumptions are made:
a). The chassis has a flat bottom. In reality, vehicle chassis are highly complex, with features such as exhaust systems and the uneven structure of the body panels.
b). The front grille is blocked. In reality, the front grille of a vehicle is open, allowing some airflow to enter the engine compartment.
c). The engine compartment is sealed. All components within the engine compartment, including the engine, transmission, cooling system, and braking system, are removed.
The aerodynamic development process of the entire vehicle is illustrated in Figure 4.
Figure 4. Vehicle aerodynamics simulation analysis flow chart
3.2 Wind tunnel testing
The primary tool for automotive aerodynamics experiments is the automotive wind tunnel, which evolved from aircraft wind tunnels originally used for testing and researching the aerodynamic characteristics of airplanes [39]. During experimental testing, models or actual vehicles are typically fixed at the center of the six-component balance system in the test section of the wind tunnel. Unlike in real environments where airflow is complex and uncontrollable, the flow characteristics in a wind tunnel can be controlled, providing repeatable and economical experimental data [40]. Since CFD simulations are conducted on computers, their results must be validated under real-world conditions, a role that wind tunnel testing fulfills.
Automotive wind tunnel testing addresses several core issues in vehicle aerodynamics, including but not limited to the measurement of the vehicle’s drag coefficient, analysis of lift coefficients, control of aerodynamic noise, study of pollutant distribution on the vehicle body, and the vehicle’s performance under different climatic conditions [41]. As a critical technology platform for enhancing vehicle aerodynamic performance, automotive wind tunnels are categorized into two main types: full-scale wind tunnels and model wind tunnels. Each is suited to different stages and requirements of aerodynamic development [42].
During the initial phase of this study, we focused on selecting wind tunnel facilities for collaboration. We examined two types of wind tunnel facilities: first, scale model wind tunnels, including the Pan Asia scale model wind tunnel established by SAIC General Motors in China in 2018, which marked the first corporate automotive model wind tunnel center in the country [43]. Second, considering the importance of full-scale wind tunnels, the automotive aerodynamics wind tunnel at BMW’s headquarters in Munich, Germany, stands out as a benchmark. This facility, costing over 170 million euros and taking three years to build, has been in operation since 2009 and remains a leading global center for automotive aerodynamics research [44].
The wind tunnel utilized in this experiment is equipped with professional aerodynamic testing conditions, offering significant advantages such as convenient acquisition of test parameters, controlled experimental environment, and immunity from external disturbances [45]. This makes it an ideal laboratory setting for current automotive aerodynamic research. Wind tunnels can be classified based on airflow speed into categories such as low-speed, subsonic, transonic, supersonic, and hypersonic; structurally, they are divided into open-circuit and closed-circuit wind tunnels [46].
To accurately simulate the dynamic performance of vehicles under real road conditions, it is crucial to establish an accurate full-vehicle motion model. This helps reflect the actual state of the vehicle during driving, ensuring the accuracy of the initial conditions for simulation analysis, thereby determining the real-time changes in the drag coefficient during vehicle operation.
In actual testing conditions, there is currently no comprehensive road spectrum database. In most cases, the road spectrum is compiled based on specific test projects within the automobile manufacturer, resulting in multiple types of road spectra. During the design and development testing process, the road models used are virtually generated. For ease of calculation and result processing, this study selects a typical sinusoidal road spectrum to conduct simulation tests in the full-vehicle road wind tunnel experiment, analyzing the differences between road conditions and wind tunnel laboratory test results, as illustrated in Figure 5.
Figure 5. The sine line formed by the sine function y=sin(x)
The sine function reflects the longitudinal and directional changes of the entire vehicle on the road. Depending on the amplitude, the pitch angle, or phase angle, of the vehicle varies. In this study, the test speed is set to 120 km/h, which necessitates selecting appropriate amplitudes and travel distances to obtain a relatively reasonable test road spectrum.
The road spectrum parameters of the entire vehicle are obtained using Carsim software. The study of the vehicle motion model is based on the multi-body dynamics theory of the entire vehicle. The system is divided into basic vehicle parameters, aerodynamic characteristics, transmission system, tires, suspension system, and braking system subsystems. Specific characteristic parameters or test curves for each subsystem are imported into the software, the test road spectrum is set, and the vehicle's operating state under different driving conditions is simulated. The simulation allows observation of the vehicle's operating state through animations, enabling an early visual assessment of whether the vehicle's operational state is reasonable.
Figure 6. 3D body model
The primary focus of this experiment is on force measurement. The small car model is installed as shown in the figure below. When the wind tunnel is activated, the model experiences force. This force is detected by the six-component balance system, which is fixed to the vehicle model. The balance system sends signals via data acquisition lines to the collection equipment, and the data is ultimately consolidated on a computer, where it is processed and output by the ATIDAQF software.
Since the vehicle model uses real-world data during simulation, its actual length far exceeds the dimensions of the wind tunnel. For convenience, the vehicle model is scaled down to a 1:25 ratio. The scaled-down model measures approximately 175 mm in length, 75 mm in width, and 65 mm in height, meeting the wind tunnel blockage ratio requirement of less than 15%. The vehicle body is made of white resin and produced using 3D printing, as shown in Figure 6.
3.3 Data collection and analysis
The fundamental principle of an automotive wind tunnel is to generate a controllable airflow using a driving power device, allowing this airflow to move through a specially designed flow channel. When this controlled airflow passes over a stationary vehicle model or a model with moving wheels placed in the test section, it approximates the vehicle's motion in a real environment where natural wind speed is zero. Precision instruments measure the aerodynamic drag acting on the vehicle. The smoke method is used to observe airflow patterns on and around the vehicle, aiding in the design and optimization of the vehicle's aerodynamic performance. Using similarity theory, the test results are processed to produce parameters applicable to the vehicle's actual aerodynamic characteristics.
The following testing methods were used during the wind tunnel experiments:
a). Force Measurement Method: This method involves using a six-component balance to measure the forces and moments acting on the test model or vehicle along the three axes of a Cartesian coordinate system.
b). Pressure Distribution Measurement Method: Pressure sensors are placed on the vehicle's surface to measure the pressure distribution across the body of the vehicle.
c). Flow Visualization Method: This method employs physical adhesives or chemical reagents to visually display the airflow patterns on the vehicle's surface. It provides a deep, intuitive understanding of the flow characteristics, aiding in the analysis of the vehicle's surface flow properties and identifying key areas that impact aerodynamic drag.
d). Flow Measurement Method: This includes measuring parameters such as flow velocity, direction, pressure, and temperature. These measurements are used to verify the stability of the wind tunnel and facilitate the investigation of the mechanisms underlying the vehicle's aerodynamic characteristics.
$\frac{F^{\prime}}{F}=\frac{\rho^{\prime} V^{\prime d v^{\prime}} / d t}{\rho V^{d v} / d t}$
If geometric similarity and dynamic similarity are maintained, the proportionality of the forces can be expressed as follows:
$\frac{K_F}{K_\rho K_1^2 K_V^2}=1$
In this context, kF represents the dynamic scale ratio, kρ represents the density scale ratio, kl represents the length scale ratio, and kv represents the velocity scale ratio. Based on similarity theory, and by combining the above equations, we can derive that:
$\frac{F^{\prime}}{\rho^{\prime} l^{\prime 2} v^{\prime 2}}=\frac{F}{\rho l^2 v^2}$
Furthermore, $\frac{F \prime}{\rho^{\prime} l^{\prime 2} v^2}=N e$, the Newton number (Ne) is defined as the ratio of applied force to inertial force, which is dimensionless. The principle is that as long as dynamic similarity exists in both flow fields, any flow will satisfy the Newton similarity criterion.
(1) Gravity Similarity Criterion: Since the formula for dynamic scale ratio is given by $K_F=\frac{\rho^{\prime} v \prime g^{\prime}}{p v g}=K_\rho k_1^3 k_g$, by substituting the Newtonian similarity criterion, we can obtain:
$\frac{V^{\prime}}{\left(q^{\prime} l^{\prime}\right)^{1 / 2}}=\frac{V}{(q l)^{1 / 2}}$
Therefore:
$\frac{V}{(g l)^{1 / 2}}=F r$
Let Fr denote the Froude number, which is the ratio of inertial force to gravitational force. For any two fluid flows, as long as they satisfy the similarity of gravity effects, their Froude numbers are the same, i.e., F'r = Fr. Through analysis, it can be concluded that as long as two fluid flows satisfy the similarity of gravity effects, the relevant physical properties of these two fluids are constrained by the Froude similarity criterion, and cannot be altered or replaced arbitrarily.
(2) Viscous Force Similarity Criterion: Viscosity is related to the Reynolds number, so it is also called the Reynolds similarity criterion, that is $\operatorname{Re}=\frac{\rho \mathrm{vl}}{\mu}=\frac{\mathrm{vl}}{v}$, where μ is the viscosity coefficient and v is the kinematic viscosity coefficient. It represents the ratio of inertial force to viscous force. When the viscous forces acting on the model and the prototype flow are similar, their Reynolds numbers must be equal, i.e., Re’=Re. Through analysis, it can be concluded that if the viscous forces generated in two flow fields are similar, then the physical properties of these two flow fields will be constrained by the Reynolds similarity criterion, and this constraint will be reflected in the setup. The Reynolds similarity criterion can be expressed as:
$\frac{v^{\prime} l^{\prime}}{v^{\prime}}=\frac{v l}{v}$
(3) The pressure similarity criterion, also known as the Euler similarity criterion, defines the ratio of pressure to inertial force as the Euler number Eu. According to the aforementioned criteria, if the flow of two fluids satisfies the pressure similarity criterion, then the Euler numbers of these two fluids will be the same, i.e., Eu’=Eu. Thus, we have:
$\frac{\Delta p^{\prime}}{p^{\prime} v^{\prime 2}}=\frac{\Delta p}{p v^2}$
The investigation aims to analyze the impact of body yaw angle on the aerodynamic characteristics of the vehicle and the degree of optimization of the modified body model compared to the original one. Six yaw angle schemes, namely 0°, 6°, 12°, 18°, 24°, and 30°, were set to measure the aerodynamic forces and moments exerted on the vehicle at different angles while maintaining a speed of 30 m/s.
The experiment primarily explores the influence of different yaw angles on the aerodynamic forces acting on the vehicle and the variations in the drag coefficient of the model before and after optimization under headwind conditions. Simulation results and wind tunnel experimental data are presented in Tables 1 and 2. From Table 1, it can be observed that there is a certain discrepancy between the simulation results and the corrected experimental results, possibly due to errors in the correction of the underbody support plates and supports. However, overall trends indicate that both simulation and experimental results demonstrate an increase in drag coefficient with increasing yaw angle, validating the conclusion from Chapter 4 that "the aerodynamic forces and coefficients of the vehicle increase with increasing yaw angle," as shown in Figures 7 and 8.
Table 1. Comparison between simulation and experiment
|
Β(°) |
Simulation of the Original Model |
Wind Tunnel Experiment of the Original Model |
||||||
|
Drag Coefficient |
Coefficient of Lift |
Drag/N |
Lift/N |
Drag Coefficient |
Coefficient of Lift |
Drag/N |
Lift/N |
|
|
0° |
0.3216 |
0.1058 |
530.49 |
174.49 |
0.3235 |
0.1267 |
0.8528 |
0.3342 |
|
6° |
0.3009 |
0.2122 |
616.49 |
423.40 |
0.3130 |
0.1999 |
0.9977 |
0.6349 |
|
12° |
0.3377 |
0.2209 |
778.05 |
550.82 |
0.3313 |
0.2006 |
1.1213 |
0.7988 |
|
18° |
0.3535 |
0.2990 |
1008.21 |
837.19 |
0.3600 |
0.2335 |
1.6663 |
1.2345 |
|
24° |
0.3898 |
0.4509 |
1262.55 |
1305.05 |
0.4233 |
0.3678 |
2.0006 |
2.0221 |
|
30° |
0.4189 |
0.5101 |
1651.26 |
1949.32 |
0.4445 |
0.4567 |
2.7877 |
3.0441 |
Table 2. Wind tunnel test comparison
|
Β(°) |
Original Mode |
Optimized Model |
||||||
|
Drag Coefficient |
Coefficient of Lift |
Drag/N |
Lift/N |
Drag Coefficient |
Coefficient of Lift |
Drag |
Lift |
|
|
0° |
0.3235 |
0.1267 |
0.8528 |
0.3342 |
0.2635 |
-0.0167 |
0.7728 |
-0.0342 |
|
6° |
0.3130 |
0.1999 |
0.9977 |
0.6349 |
0.2770 |
0.0510 |
0.877 |
0.1369 |
|
12° |
0.3313 |
0.2006 |
1.1213 |
0.7988 |
0.2913 |
0.0995 |
1.1213 |
0.2788 |
|
18° |
0.3600 |
0.2335 |
1.6663 |
1.2345 |
0.3709 |
0.1982 |
1.8309 |
0.6745 |
|
24° |
0.4933 |
0.3678 |
2.0006 |
2.0221 |
0.5009 |
0.3489 |
1.9688 |
1.5621 |
|
30° |
0.4745 |
0.4567 |
2.7877 |
3.0441 |
0.4658 |
0.4009 |
2.3867 |
2.0478 |
Figure 7. Simulation and experimental drag coefficient diagrams
Figure 8. Simulation and experimental lift coefficient diagrams
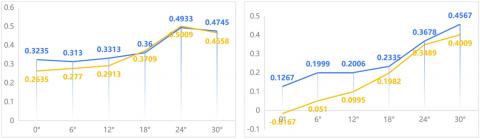
According to Table 2, as well as the data presented in Figures 9 and 10, the optimized vehicle body model shows improvements in both aerodynamic resistance and lift compared to the original model. Specifically, the maximum difference in resistance is 0.2788N, while the maximum difference in lift is 0.6686N. Under headwind conditions, the resistance coefficient has improved by approximately 10.68%, with the lift coefficient decreasing from 0.1267 to -0.0167, closely aligning with the simulation results. Under crosswind conditions, the optimized resistance coefficient improved by up to approximately 11.06%, with the maximum lift coefficient decreasing from 0.1999 to 0.0510. This demonstrates that by adopting the optimal aerodynamic lift solution, there is a greater reduction in lift, further validating the effectiveness of the optimization method.
Figure 9. Aerodynamic comparison chart
Figure 10. Comparison chart of aerodynamic coefficients
This chapter first introduces the experimental procedures and specific methods employed. A comparison is made between the wind tunnel test results of the orthogonally optimized model and the original model, ultimately confirming the accuracy of the simulation results presented in this study.
The physical model of the vehicle body was created by scaling down the dimensions at a ratio of 1:25 and fabricated using 3D printing technology. The experiments on the aerodynamic characteristics of the vehicle body were conducted in a low-speed wind tunnel facility, complemented by a direct current suction-type educational wind tunnel. The results indicate that the aerodynamic forces on the vehicle body increase to varying degrees with the increase in yaw angle. Both the resistance coefficient and the lift coefficient of the orthogonally optimized model were reduced to different extents. As the optimal lift coefficient solution was utilized, the lift coefficient underwent the most significant optimization. Despite the inevitable errors in the experimental process, after error correction, it was observed that the experimental data were in good agreement with the simulation results, with overall trends remaining consistent.
This study focuses on EVs and employs comprehensive CFD simulations to reveal the intrinsic relationship between vehicle body structural modifications and their overall aerodynamic performance. It provides valuable theoretical insights and practical guidance for optimizing vehicle design and effectively reducing aerodynamic drag and lift.
Firstly, this study provides a comprehensive overview of the current market status of electric vehicle styling design, clearly identifying several key design parameters that have potential impacts on vehicle body shape. It also predicts future trends in electric vehicle design. Based on these forward-looking design guidelines, we utilized advanced 3D modeling tools such as CATIA to precisely construct a digital model of a pure electric sedan, starting from conceptual sketches.
Continuing, using the FLUENT software and its standard k-ε turbulence model, we conducted precise simulation calculations of the flow field characteristics under forward wind conditions. Utilizing professional plotting software Origin, and flow field post-processing techniques, we generated intuitively visualized data charts to deeply analyze influencing factors. By introducing a steady-state crosswind simulation strategy, we systematically investigated the flow field variation characteristics of the model at 0-30° yaw angles, further refining our understanding of the flow state around and over the vehicle surface.
In this study, we employed the controlled variable method to systematically investigate the influence of key factors such as rear wing design, vehicle ground clearance, and the radius of the front lower edge on the aerodynamic characteristics of the vehicle. Specifically, increasing the rear wing angle and width significantly reduced aerodynamic drag and lift, while decreasing ground clearance also effectively reduced aerodynamic drag. To ensure the broad applicability of our research, we integrated orthogonal experimental design and range analysis methods to identify and achieve the optimal parameter configuration for the original vehicle model. This optimization scheme not only effectively reduced aerodynamic drag and lift but also significantly improved the vehicle's energy efficiency, enhancing both fuel economy and electrical energy consumption.
To further deepen the discussion on our results, we analyzed actual engineering cases. For instance, in optimizing the rear wing design, we drew on the high-efficiency rear wing design concepts from F1 racing. By adjusting the angle and shape of the rear wing, we significantly enhanced the low-pressure area at the rear of the vehicle, effectively reducing the wake and aerodynamic drag. This strategy parallels the innovative rear wing design introduced by Mercedes-Benz on the F1 W08 in 2017, which, through precise aerodynamic tuning, substantially increased the car's downforce without adding extra drag [47].
Regarding the adjustment of vehicle ground clearance, our study referenced the redesign strategies of the Tesla Model S. By reducing the ground clearance, we optimized the airflow between the vehicle's underbody and the ground, reducing underbody turbulence. This change aligns with Tesla's official claims of improved range [48]. Simulation and experimental data show that even minor adjustments in height can significantly impact overall aerodynamic performance, offering new insights into energy consumption management for EVs. Furthermore, the optimization of the front lower edge radius drew inspiration from the front-end design of the Audi e-tron. By reducing the sharpness of the front bumper edges for smoother airflow transitions, we effectively suppressed airflow separation around the front wheels, reducing frontal pressure drag. This design concept was validated in our simulations and corresponds to the low drag characteristics observed in the Audi e-tron's real-world road tests [49]. Through the combined analysis of these examples, we not only validated the effectiveness of our simulation results but also revealed the underlying physical principles of the design improvements and their potential applications in real-world engineering. This provides electric vehicle designers with practical, impactful optimization strategies. This in-depth exploration not only enhances the understanding of the factors influencing aerodynamic design but also opens new avenues for innovation and performance improvement in vehicle design.
Ultimately, the research team employed advanced 3D printing technology to create a 1:25 scale model of the vehicle, which was then used in wind tunnel tests to validate the prior simulation results. These tests confirmed the high accuracy and practicality of the simulation analysis. The experimental results not only demonstrated the reliability of the simulation predictions but also showcased the practical benefits of our optimized designs. By integrating numerical simulations with actual wind tunnel tests, we established a solid foundation for subsequent real-world applications. This comprehensive series of studies not only deepened our understanding of the aerodynamic characteristics of EVs but also provided scientific evidence for enhancing the design efficiency and performance of future models.
(1) Numerical Simulation Analysis: The aerodynamic characteristics of a car driving under headwind conditions differ significantly from those under crosswind conditions. When subjected to crosswinds, the largest vortex region forms on the leeward side of the vehicle and expands with increasing yaw angle. This leads to more severe energy losses compared to headwind driving, significantly increasing aerodynamic forces in all three directions. Analysis suggests that the projected area of the vehicle increases under crosswind conditions, directly resulting in higher drag and lift. Under headwind conditions, the drag is relatively low, not only because of the smaller projected frontal area, but also due to the long-term optimization of vehicle shapes into streamlined or wedge forms to minimize drag. The expansion of vortex regions and increased energy losses under crosswinds are similar to the wingtip vortex formation mechanism in aircraft during sideslip. In aircraft design, strategies such as using wingtip devices or endplates to reduce vortex-induced losses provide insights for future electric vehicle designs. Innovative structural designs may potentially reduce leeward vortex regions and, consequently, energy consumption. Additionally, comparing the classic wedge-shaped design of sports cars like the Lamborghini Countach with the side profiles of modern SUVs shows that effective airflow management technologies, such as active aerodynamic components, can control airflow separation and maintain stability and comfort, even in non-optimal streamlined designs. However, due to various considerations, vehicle sides cannot be designed similarly, leading to premature airflow separation, large vortex formations, and negative impacts on vehicle stability, comfort, and efficiency.
(2) Rear Wing and Body Optimization Factors: This study explored the impact of factors such as rear wing installation position, wing width, wing angle, ground clearance, and the radius of curvature of the lower front surface on the vehicle's aerodynamic characteristics, providing clear directions for body optimization. The analysis results indicate that appropriately increasing the rear wing angle and width, as well as reducing the ground clearance, can enhance the aerodynamic properties of the vehicle. Specifically, the installation position of the rear wing and ground clearance have the most significant impact on drag, while the wing angle and width have the greatest effect on lift. The radius of curvature of the lower front surface has a relatively minor influence on both drag and lift. Incorporating real-world engineering cases, the principles of rear wing design optimization we identified align closely with the dynamic rear wing adjustment systems widely used in Formula 1 (F1) racing. F1 cars significantly improve their aerodynamic balance by dynamically adjusting the wing angle and width to suit different track conditions and speed requirements, increasing downforce while reducing drag. This example further validates the engineering feasibility and effectiveness of our proposed rear wing design strategies. Similarly, the low-profile design and meticulously optimized underbody of the Porsche Taycan demonstrate the importance of reducing ground clearance to lower aerodynamic drag and enhance vehicle stability. The careful treatment of the Taycan's lower front surface also substantiates our analysis of the impact of the lower front surface's radius of curvature.
(3) Wind Tunnel Experiment Validation: To validate the numerical simulation results, a 1:25 scale model of the vehicle body was created using 3D printing. The aerodynamic characteristics of the vehicle were tested in a low-speed wind tunnel laboratory, utilizing a direct-current suction-type wind tunnel. The results showed that the aerodynamic forces on the vehicle increased to varying degrees with the increase in yaw angle, and the orthogonal optimization scheme proved feasible. The final experimental results indicated that, compared to the original model, the drag coefficient in headwind conditions was optimized by approximately 10.68%, and the lift coefficient was reduced from 0.1267 to -0.0167. In crosswind conditions, the maximum optimization of the drag coefficient was about 11.06%, and the lift coefficient decreased from 0.1999 to 0.0510. Although there were some discrepancies between the experimental data and the simulation results, the overall trend remained consistent, and the results were largely in agreement. Therefore, the experimental results verified the reliability of the numerical simulation method presented in this paper, providing experimental evidence for optimizing vehicle body structure to reduce aerodynamic drag and lift.
In the current trend of pursuing personalized and differentiated vehicle body designs in the electric vehicle market, the optimization design of vehicle body shapes demonstrates significant potential for development and holds crucial significance for improving research on vehicle aerodynamics. This study focuses on the analysis of aerodynamic characteristics and the structural optimization design of EVs. Despite achieving preliminary results, several limitations are identified, which point to future research directions:
(1) During the wind tunnel experiment phase, the use of a fixed bottom plate and exposed ground force axis to ensure the stable connection of the model, while meeting the experimental conditions, inevitably introduces measurement errors. The interference from these external factors requires rigorous correction during the data analysis stage to eliminate the influence of non-aerodynamic factors. Additionally, due to the reduced model size and corresponding decrease in forces, the measurement errors of the six-component balance are relatively magnified, resulting in some degree of deviation in the experimental results. Future research should consider employing higher-precision measurement techniques and methods to reduce such influences.
(2) In the optimization of vehicle body design, the comparative analysis of the aerodynamic performance of the rear wing is limited to three parameters, failing to fully explore the complexity of rear wing design. Future work could consider expanding the scope of research to include more design variables, such as rear wing section shapes and end geometry, to deeply analyze their finely controllable effects on vehicle drag and lift. Moreover, the current investigation only considers four levels of five parameters, indicating the preliminary exploration of model optimization. Future research should increase the levels of parameters, refine the study, and further explore the potential performance improvement space.
(3) Vehicle body modeling follows the principle of proportionality, aiming to simplify the model and accelerate the calculation process, therefore omitting local refinement operations in the grid division process. Although this speeds up the calculation process, it may overlook the influence of certain details on aerodynamic characteristics. Future research should consider implementing grid refinement in key areas to improve the accuracy of simulations. While this may increase the demand for computational resources, obtaining aerodynamic performance data closer to real-world conditions is crucial.
In summary, this study reveals the importance of vehicle body optimization design and the limitations of current practices, laying the foundation for further exploration in more detailed parameter settings, high-precision experimental techniques, and increased model complexity.
This work was supported by Service science and technology innovation projects of Wenzhou Science and Technology Association (Grant No.: jczc124); The third phase of the Ministry of Education's supply and demand matching employment and education project (Grant No.: 2023122896921); 2024 Zhejiang Province College Student Innovation and Entrepreneurship Incubation Project (Grant No.: 2024R470B014); 2023 Wenzhou Polytechinc Higher Vocational Education Special Research Topic (Grant No.: WZYGJzd202303); 2023 Wenzhou Doctoral Innovation Station-Wenzhou Ouhai Glasses Co., Ltd.
[1] Wollschläger, D. (2014). Das vernetzte Fahrzeug Voraussetzungen, Anforderungen und Perspektiven. ATZelektronik, 9(4): 10-15. https://doi.org/10.1365/s35658-014-0442-4
[2] European Parliament. (2023). EU ban on the sale of new petrol and diesel cars from 2035 explained. https://www.europarl.europa.eu/news/en/headlines/economy/20221019STO44572/eu-ban-on-sale-of-new-petrol-and-diesel-cars-from-2035-explained/, accessed on Feb. 18, 2023.
[3] European Parliament. (2023). Green deal: Key to a climate-neutral and sustainable EU. https://www.europarl.europa.eu/news/en/headlines/society/20200618STO81513/green-deal-key-to-a-climate-neutral-and-sustainable-eu/, accessed on Feb. 18, 2023.
[4] Wong, J.H., Png, E.K. (2009). Numerical investigation of wing-body junction vortex using various LES turbulence models. In 39th AIAA Fluid Dynamics Conference, 4159. https://doi.org/10.2514/6.2009-4159
[5] Shur, M.L., Spalart, P.R., Strelets, M.K., Travin, A.K. (2008). A hybrid RANS-LES approach with delayed-DES and wall-modelled LES capabilities. International Journal of Heat and Fluid Flow, 29(6): 1638-1649. https://doi.org/10.1016/j.ijheatfluidflow.2008.07.001
[6] Mruzek, M., Gajdáč, I., Kučera, Ľ., Barta, D. (2016). Analysis of parameters influencing electric vehicle range. Procedia Engineering, 134: 165-174. https://doi.org/10.1016/j.proeng.2016.01.056
[7] Szumska, E.M., Jurecki, R. S. (2021). Parameters influencing on electric vehicle range. Energies, 14(16): 4821. https://doi.org/10.3390/en14164821
[8] Hariharan, C., Gunadevan, D., Prakash, S.A., Latha, K., Raj, V.A.A., Velraj, R. (2022). Simulation of battery energy consumption in an electric car with traction and HVAC model for a given source and destination for reducing the range anxiety of the driver. Energy, 249: 123657. https://doi.org/10.1016/j.energy.2022.123657
[9] Kuthada, T., Schröck, D., Potthoff, J., Wiedemann, J. (2009). The effect of center belt roughness on vehicle aerodynamics. SAE International Journal of Passenger Cars-Mechanical Systems, 2(2009-01-0776): 841-848. https://doi.org/10.4271/2009-01-0776
[10] Landström, C., Walker, T., Löfdahl, L. (2010). Effects of ground simulation on the aerodynamic coefficients of a production car in yaw conditions (No. 2010-01-0755). SAE Technical Paper. https://doi.org/10.4271/2010-01-0755
[11] Kelly, D., Batty, J., Carrel-Billiard, T., et al. (2018). Computational-based aerodynamic design for a formula SAE vehicle. SAE International Journal of Passenger Cars-Mechanical Systems, 11(06-11-01-0003): 35-44. https://doi.org/10.4271/06-11-01-0003
[12] Cheng, S.Y., Chin, K.Y., Mansor, S. (2019). Experimental study of yaw angle effect on the aerodynamic characteristics of a road vehicle fitted with a rear spoiler. Journal of Wind Engineering and Industrial Aerodynamics, 184: 305-312. https://doi.org/10.1016/j.jweia.2018.11.033
[13] Ahmed, S. R., Ramm, G., Faltin, G. (1984). Some salient features of the time-averaged ground vehicle wake. SAE Transactions, 473-503. https://www.jstor.org/stable/44434262
[14] Kurec, K., Remer, M., Piechna, J. (2019). The influence of different aerodynamic setups on enhancing a sports car's braking. International Journal of Mechanical Sciences, 164: 105140. https://doi.org/10.1016/j.ijmecsci.2019.105140
[15] Palanivendhan, M., Chandradass, J., Saravanan, C., Philip, J., Sharan, R. (2021). Reduction in aerodynamic drag acting on a commercial vehicle by using a dimpled surface. Materials Today: Proceedings, 45: 7072-7078. https://doi.org/10.1016/j.matpr.2021.01.884
[16] Berney, A. (2001). Streamlining breasts: The exaltation of form and disguise of function in 1930s’ ideals. Journal of Design History, 14(4): 327-342. https://doi.org/10.1093/jdh/14.4.327
[17] Ejsmont, J., Owczarzak, W. (2019). Engineering method of tire rolling resistance evaluation. Measurement, 145: 144-149. https://doi.org/10.1016/j.measurement.2019.05.071
[18] Maffei, N.P. (2009). Both natural and mechanical: The streamlined designs of Norman Bel Geddes. The Journal of Transport History, 30(2): 141-167. https://doi.org/10.7227/TJTH.30.2.3
[19] Cogdell, C. (2003). Products or bodies? Streamline design and eugenics as applied biology. Design Issues, 19(1): 36-53. https://doi.org/10.1162/074793603762667683
[20] Plocher, J., Panesar, A. (2019). Review on design and structural optimisation in additive manufacturing: Towards next-generation lightweight structures. Materials & Design, 183: 108164. https://doi.org/10.1016/j.matdes.2019.108164
[21] Kobayashi, T., Kitoh, K. (1992). A review of CFD methods and their application to automobile aerodynamics. https://doi.org/10.4271/920338
[22] Takagi, M. (1990). Application of computers to automobile aerodynamics. Journal of Wind Engineering and Industrial Aerodynamics, 33(1-2): 419-428. https://doi.org/10.1016/0167-6105(90)90057-J
[23] Chemendy, N. (2018). An evaluation of demand and capacity planning processes–A qualitative case study on completely-knocked-down vehicles at Mercedes-Benz Cars. Doctoral dissertation, Stellenbosch: Stellenbosch University. http://hdl.handle.net/10019.1/103797
[24] Chowdhury, H., Loganathan, B. (2022). Biomimetics of boxfish: Designing an aerodynamically efficient passenger car. In Biomimicry for Aerospace, Elsevier, pp. 211-235. https://doi.org/10.1016/B978-0-12-821074-1.00007-4
[25] Hu, X., Yang, B., Lei, Y., Wang, J., Li, X., Liao, L., Xu, T. (2016). Automotive shape optimization using the radial basis function model based on a parametric surface grid. Proceedings of the Institution of Mechanical Engineers, Part D: Journal of Automobile Engineering, 230(13): 1808-1821. https://doi.org/10.1177/09544070156240
[26] Song, X.W., Lin, P.Z., Liu, R., Zhou, P. (2017). Skin friction reduction characteristics of variable ovoid non-smooth surfaces. Journal of Zhejiang University-SCIENCE A, 18(1): 59-66. https://doi.org/10.1631/jzus.A1500324
[27] Bonnet, C., Fritz, H. (2000). Fuel consumption reduction in a platoon: Experimental results with two electronically coupled trucks at close spacing (No. 2000-01-3056). SAE Technical Paper. https://doi.org/10.4271/2000-01-3056
[28] Watkins, S., Vino, G. (2008). The effect of vehicle spacing on the aerodynamics of a representative car shape. Journal of Wind Engineering and Industrial Aerodynamics, 96(6-7): 1232-1239. https://doi.org/10.1016/j.jweia.2007.06.042
[29] Davila, A., Aramburu, E., Freixas, A. (2013). Making the best out of aerodynamics: Platoons (No. 2013-01-0767). SAE Technical Paper. https://doi.org/10.4271/2013-01-0767
[30] Zhou, B., Yao, F., Littler, T., Zhang, H. (2016). An electric vehicle dispatch module for demand-side energy participation. Applied Energy, 177: 464-474. https://doi.org/10.1016/j.apenergy.2016.05.120
[31] Lin, C., Dong, A., Shi, J. (2016). Dynamic smoothness control for dual-motor-independent-drive electric vehicles based on Kalman filter. Energy Procedia, 88: 1005-1012. https://doi.org/10.1016/j.egypro.2016.06.126
[32] Koirala, B.P., Koliou, E., Friege, J., Hakvoort, R.A., Herder, P.M. (2016). Energetic communities for community energy: A review of key issues and trends shaping integrated community energy systems. Renewable and Sustainable Energy Reviews, 56: 722-744. https://doi.org/10.1016/j.rser.2015.11.080
[33] Makowski, F.T., Kim, S.E. (2000). Advances in external-aero simulation of ground vehicles using the steady RANS equations (No. 2000-01-0484). SAE Technical Paper. https://doi.org/10.4271/2000-01-0484
[34] Joshi, J.B., Nandakumar, K., Patwardhan, A.W., et al. (2019). Computational fluid dynamics. In Advances of Computational Fluid Dynamics in Nuclear Reactor Design and Safety Assessment, Woodhead Publishing, pp. 21-238. https://doi.org/10.1016/B978-0-08-102337-2.00002-X
[35] Khairi, D.M., Abas, M.A., Said, M.F.M., Salim, W.S.I.W. (2017). Fuel consumption mathematical models for road vehicle–A review. Progress in Energy and Environment, 59-71. https://doi.org/10.15282/jmes.11.4.2017.1.0267
[36] Jeon, S., Heinz, U. (2015). Introduction to hydrodynamics. International Journal of Modern Physics E, 24(10): 1530010. https://doi.org/10.1142/S0218301315300106
[37] Palin, R., Johnston, V., Johnson, S., D'Hooge, A., Duncan, B., Gargoloff, J.I. (2012). The aerodynamic development of the Tesla model S-part 1: Overview (No. 2012-01-0177). SAE Technical Paper. https://doi.org/10.4271/2012-01-0177
[38] D'Hooge, A., Palin, R.B., Johnson, S., Duncan, B., Gargoloff, J.I. (2012). The aerodynamic development of the Tesla model S-part 2: wheel design optimization (No. 2012-01-0178). SAE Technical Paper. https://doi.org/10.4271/2012-01-0178
[39] Sternéus, J., Walker, T., Bender, T. (2007). Upgrade of the Volvo cars aerodynamic wind tunnel. SAE Transactions, 1089-1099. https://www.jstor.org/stable/44687874.
[40] Olander, M. (2011). CFD simulation of the Volvo cars slotted walls wind tunnel. https://hdl.handle.net/20.500.12380/143242.
[41] Blocken, B., Toparlar, Y. (2015). A following car influences cyclist drag: CFD simulations and wind tunnel measurements. Journal of Wind Engineering and Industrial Aerodynamics, 145: 178-186. https://doi.org/10.1016/j.jweia.2015.06.015
[42] Blocken, B., Gillmeier, S., Malizia, F., van Druenen, T. (2023). Impact of a nearby car on the drag of a cyclist. Journal of Wind Engineering and Industrial Aerodynamics, 234: 105353. https://doi.org/10.1016/j.jweia.2023.105353
[43] Leitl, B.M., Meroney, R.N. (1997). Car exhaust dispersion in a street canyon. Numerical critique of a wind tunnel experiment. Journal of Wind Engineering and Industrial Aerodynamics, 67: 293-304. https://doi.org/10.1016/S0167-6105(97)00080-9
[44] Cyr, S., Ih, K.D., Park, S.H. (2011). Accurate reproduction of wind-tunnel results with CFD (No. 2011-01-0158). SAE Technical Paper. https://doi.org/10.4271/2011-01-0158
[45] Kwon, H.B., Park, Y.W., Lee, D.H., Kim, M.S. (2001). Wind tunnel experiments on Korean high-speed trains using various ground simulation techniques. Journal of Wind Engineering and Industrial Aerodynamics, 89(13): 1179-1195. https://doi.org/10.1016/S0167-6105(01)00107-6
[46] Ljungskog, E., Sebben, S., Broniewicz, A. (2020). Inclusion of the physical wind tunnel in vehicle CFD simulations for improved prediction quality. Journal of Wind Engineering and Industrial Aerodynamics, 197: 104055. https://doi.org/10.1016/j.jweia.2019.104055
[47] Frömmig, L. (2023). Driving dynamics basics. In Basic Course in Race Car Technology: Introduction to the Interaction of Tires, Chassis, Aerodynamics, Differential Locks and Frame, Springer Fachmedien Wiesbaden, pp. 89-140. https://doi.org/10.1007/978-3-658-38470-8_5
[48] Kraft, T., Alagesan, S., Shah, J. (2024). Kraft, Tim and Alagesan, Suriyaprakash and Shah, Jimit, The New War of the Currents: The Race to Win the Electric Vehicle Market. Darden Case No. UVA-OM-1709. http://doi.org/10.2139/ssrn.3771785
[49] Zhu, Y. (2024). Research on the whole life cycle energy consumption and pollution emission of new energy vehicles and traditional fuel vehicles based on the perspective of single vehicle currency of the same vehicle model. In E3S Web of Conferences, EDP Sciences, 528: 03018. https://doi.org/10.1051/e3sconf/202452803018