Nibal Fadel Alhialy![]()
© 2024 The author. This article is published by IIETA and is licensed under the CC BY 4.0 license (http://creativecommons.org/licenses/by/4.0/).
OPEN ACCESS
Due to the shortage of electricity with abundant solar radiation in Iraq especially in summer, increasing temperatures with higher cooling demand. This concerns the all-life sector, especially agriculture, industrial, medical, and air purification. By utilizing solar radiation as the primary energy source, adsorption chillers are a potential technology to reduce the strain on the demand for renewable power. The kinetics of the adsorbent, the refrigerant selected, the adsorber's design, and the temperatures chosen all affect how well they work. The primary objective of this work is to optimize the cylindrical bed dimensions with specific cooling power (SCP) and performance (COP) of adsorbent bed reactors by optimizing the geometrical design parameters and the influencing cooling time. These geometric design criteria included the reactor bed's mass, shape, and thickness. This study explores the design and operational parameters' impact factors' effects upon COP & SCP of an adsorptive refrigerator machine, as well as the influence of the thickness of the activated carbon bed at bed's heat transfer performance. Using ethanol and 16 kg of activated carbon as the working pair, a transient one-dimensional modeling simulation was used to build and examine the performance of the cylindrical two-bed adsorber chiller, measuring 0.048 m in thickness and 0.5 kW in cooling power. By investigating the connections between cooling efficiency, ethanol adsorption, bed thicknesses, and desorption temperature. The (EES) program was used to carry out the simulation technique. The results of this investigation demonstrated that the ideal layer thickness for refrigeration power of 359 W, COP of around 0.702, SCP of 11.22 W/kg, and ideal chilling time of roughly (50) min was found to be 0.048 m. The conclusion is that although a greater input temperature would result in a comparatively longer cycle time, it may also provide a higher cooling power. SCP will, however, drop for cylindrical bed thicknesses greater than (0.048) m. SCP is 9.6 W/kg at thickness (0.0625) m; this value decreases by approximately 15% as thickness increases from (0.048-0.0625) m, and this increase is progressive. The cylindrical bed designs were discovered to have thickness and cooling time optimization superior to the flat plane with the same specifications. 95℃ was the generating temperature at the 5 °C evaporator, and the cooling time was around 40 minutes less than with the flat plate design. In contrast, the cooling period in this instance, 0.048 meter long cylindrical bed was (58) minutes. SCP = 9 W/kg for the flatbed design, a 20% decrease from the existing research design.
solar refrigerator, the thickness of the solar adsorptive bed, equilibrium uptake, cooling time, specific cooling power, performance
In Iraq in particular, renewable energy and nuclear energy are gaining popularity as a source of energy due to their environmental friendliness and lack of atmospheric pollution. The utilization of such an energy source aims to reduce fossil-fuel consumption and reduce CO2 emissions [1-4]. Solar radiation is considered one of the world’s largest energy sources and utilizing that radiation to produce energy will reduce reliance on fossil fuels. The stark contrast between solar radiation levels and Iraq's power deficit emphasizes how vital it is to harness solar energy to lessen the intense heat that permeates the country. Iraq's environment presents a compelling case for solar energy utilization, with extremely encouraging outcomes. Iraq has a high solar radiation richness, with a yearly average of 1,800-2,390 kW-hours / m2 from direct normal irradiation. Being at the forefront of solar technology development will not only restore Iraq's technological strength but also increase Iraqi expertise in an area with significant export revenue potential [5].
Many types of research have been done on solar energy in Iraq [6-8] with different technologies PV cells, solar collectors, and simulation of PV parameters.
The refrigeration process is essential for both industrial output and human comfort in many areas, and it is especially important during hot weather. The refrigeration sector uses 20% of the world's power, and this percentage is projected to rise in the coming years due to both global warming and the expanding demand for cooling across a wide range of businesses [9].
Solar adsorption cooler technology employs natural resources for operation rather than depending on costly power expenses, which helps to dramatically cut energy costs over time in addition to decreasing emissions [10, 11]. The adsorption cooling system uses two materials known as the "adsorption pair" adsorbent and adsorbate [12, 13].
Additionally, they use environmentally benign and natural refrigerants such as ethanol [14-16], methanol [16-21], CO2 [22-24], water [25], ammonia [26] so on. Consequently, the extensive development of implementing an adsorption cooling system will aid in resolving several environmental and energy-related issues. Thus, the widespread development of adsorption cooling systems will contribute to the resolution of several environmental and energy-related issues.
Particularly in warm regions, solar-powered refrigeration devices appear promising, but low performance is a big worry [27, 28]. Therefore, many recent research aims to improve performance [29]. For improving the COP of solar adsorption cooler working with ethanol ACF, employing experimentally and numerical simulation investigated a ACFs-ethanol pair in addition to enhancing transferring mass & heating in the adsorber bed [30].
Additionally, these problems make thermally driven adsorption cooling machines less commercially viable [31]. Improving performance may include, optimizing the reactor adsorbent bed design, improving the conductivity of the adsorbent, using more stages than one, using fins or additives, and optimizing the bed's geometrical thickness. (SCP) and (COP) are two metrics that are frequently used to evaluate an adsorption-cooling machine's efficacy. Khanam et al. [32] created a transient two-dimensional axisymmetric, with Computational Fluid Dynamics (CFD) for studying the adsorber with finned-tube design performance. Modeling the AC/ethanol as the operating functioning couples with different adsorbent thicknesses to optimize cycle time. The cooling system was working at (15, 20, and 80)℃ for heating, cooling, and evaporation, respectively. The temperature profiles that were generated for various adsorbent thicknesses were verified with experimental data. The outcomes of, SCP and COP, were established as, 488 W/kg and 0.61, correspondingly, and the optimal cycle time was 800 s.
Simulation studied hybrid solar adsorption systems, three cities have been chosen: Kuwait City in Kuwait, Riyadh in Saudi Arabia, and Sharjah in the United Arab Emirates [33]. The system consists of three components: (i) photovoltaic-thermal (PVT) solar collectors, (ii) evacuated tube solar collectors (ETCs), and (iii) a single-stage double-bed silica gel/water-based adsorption chiller for chilling applications. The performance of the suggested system is theoretically investigated through the development and implementation of a MATLAB code.
Hakemzadeh et al. [34] and Bozorgi et al. [35] established a multilayer computational network, a mix of analytical and conceptual frameworks, to determine the most effective solar thermal system, to enhance the techno-economic potential of solar adsorption cooling in Malaysia. The solar adsorption cooling system was modeled and simulated using TRNSYS, MATLAB, and REFPROP software. MATLAB-implemented Particle Swarm Optimization (PSO) connected to TRNSYS. To provide the necessary thermal energy, two types of solar collectors—the evacuated tube and Wavy Direct Absorption Solar Collectors (WDASC)—were assessed.
To analyze the adsorptive duration impact on the improvement of performance effectiveness of a solar adsorptive refrigerator machine, Wang et al. [36] offers a thermodynamic model that has been numerically verified. The adsorption rate model has been utilized to assess the based on observed concentrated solar heating. The mathematical model yielded an ideal time of approximately (71 min) for the adsorptive time, which corresponds to a COP of 0.476 and SCP of 28.6 Wkg-1.
Grabowska et al. [37] presented a novel idea of adding fluidized beds to the adsorption systems that have the potential to yield the best improvements in energy efficiency. The objective of the empirical research was to expand the basic understanding of fluidization at low pressure, which is a feature of the cyclic occupied of adsorptive machines. Five samples from adsorption beds were examined. The samples included additions of carbon or aluminum nanotubes of five and ten percent, respectively, whereas the reference sample was composed solely of silica gel.
Focuses on creating innovative poroused (ACs) from widely accessible crop leftovers and using them sustainably to address these problems. Chauhan et al. [38] produced the ACs by activating optimized biochar with KOH showed apparent areas of (2.002 m2/kg) and (1.241 m2/kg). The honey-comb construction was an indication of micro-pores formed during activation processes, according to the surface morphology research. The structural constants of the (D_A) (Dubinin-Astakhov) representations may be most precisely determined by using the experimental data on ethanol uptake. The mass of adsorbent to combustion fuel ratio was presented as a new performance metric by using ethanol refrigerated in an adsorptive cooler machine driven by renewable energy.
Chauhan et al. [39] reported the performance estimation of a small-scale biomass-based heating unit combined with a one-step adsorptive cooler machine that uses several activated carbon/ethanol as adsorbent/adsorbate beds for different applications. To determine the best adsorbent bed designs for each application, a thorough parametric investigation was conducted to highlight the effects of operating temperatures, heat exchanger to adsorbent mass ratio, coefficient of performance (COP), uptake efficiency, and mass of adsorbent to combustion fuel. The numerical results show that the flat-finned tube adsorber works better with biomass carbon-ethanol pair than the traditional-finned tube and tube & shell-type adsorber, reaching 19% and 30% higher COP, respectively. For refrigeration and space cooling, the H2-treated Maxsorb-III exhibits the highest ideal cooling coefficient (0.73), with the biomass-carbon following closely after with 0.72.
Gado et al. [40] and Wang et al. [41] ambitious to enhance the efficiency of adsorption desalination/cooling systems (ADCs) by the use of triply periodic minimum surface (TPMS) structures to contain adsorbent materials. To enhance the efficiency of ADCs, solid and sheet forms of metallic networks-based TPMS (such as Gyroid and Diamond) were studied. Based on specific daily water production (SDWP) and (SCP), the finned tube-packed adsorber and TPMS structures were compared using CFD simulations. Variant porosity levels were also used to analyze such structures. The sheet network of diamonds reached an SDWP of 10.4 m3/ton at a porosity of 0.8, which was 19.4% higher than that of the finned tube structure. The diamond sheet network achieved SDWP and SCP of 20.1 m3/ton and 627.4 W/kg, respectively, at a porosity of 0.2.
Agarwal et al. [42] carried out extensive research to solve this problem, beginning with lab-scale experiments to full-scale commercial refrigeration system trials. Three composite samples (B1, B2, and B3) containing different amounts of water (20-45% by weight) were made using calcium chloride–expanded graphite (CaCl2: EG/4: 1), and utilized a standard CaCl2-activated carbon-white cement composite (CaCl2: AC: WC/16: 4: 1, sample A). For this reason, the composites were placed above fin tubes that had wire mesh wrapped around them. The structural integrity of these composites was examined in a designed constant-volume single fin-tube adsorption/desorption bed for 300 continuous cycles.
In the laboratory, by using CFD, concluded that Zeolite-water adsorbent bed desorption is inspired by several factors, particle size, thermal conductivity, bed thickness, working pressure, and various regeneration temperatures [43-45]. It has been demonstrated that the system's COP is highly dependent on the adsorbent bed layer's thickness.
One way of optimizing the COP was by improving heating and mass transferring internally the adsorptive bed accelerating the adsorption and desorption processes. Enhancing the adsorber heat exchanger's design, raising the adsorbent's thermal conductivity, and suggesting a brand-new, improved mass transfer mode that uses a tiny vacuum pump and two condensers to lower the desorption pressure significantly were well-liked strategies to ensure sufficient heat & mass transmission inside the bed [46], optimizing the design of adsorber beds and a time-consuming process that requires many resources to carry out experimentally.
Jribi et al. [47] simulated activated carbon/ethanol beds for adsorption chiller validated by using 2D-axisymmetric geometry CFD. They have performed a simulation of a cylindrical finned adsorber. With adsorbent thicknesses of 0, 1, 5, and 10 mm from the exterior diameter of the bed. It is chilled with water to almost 30℃ while the ethanol pressure suddenly rises from 0.95 kPa to 6 kPa. The adsorbent temperature increased by up to 20°C from the starting point temperature in the simulated temperatures. At larger flow times, they were consistent with experimental findings and were somewhat higher at the beginning of adsorption.
Mohammed et al. [48] used computational fluid dynamics (CFD) numerically for the simulation of the Maxsorb/ethanol solar adsorption process. The findings of the simulation indicate that the adsorption of the Maxsorb adsorbent layer reduces with increasing layer thickness. Regarding packing density, when it reaches its maximum at 750 kg/m3, the amount of ethanol adsorbed per plate rises.
Elsheniti et al. [49] aim to enhance the conductive heat transfer across the adsorbent field. The effects of using a composite adsorbent in this investigation include System-level numerical analysis conducted on 50% activated carbon type Maxsorb III, 40% graphene Nanoplatelets, and 10% binder. For three instances of composite layer thicknesses at various cycle periods, the conflicting impacts of heat and mass transfer mechanisms inside the composite adsorbent on the operation of an adsorption ice production system were investigated. The outcomes demonstrated that for composite thicknesses of 2 and 5 mm and cycle lengths of 430 and 1230 s, the highest specific daily ice production and coefficient of performance of 33.27 kgice·kgads−1·day−1 and 0.3046 were reached. Correspondingly, the mass transfer resistances increased due to the larger composite thickness of 10 mm, overriding the improvement in heat transmission and decreasing overall performance.
El Fadar et al. [50] assumed the temperature of the cooling water and heat source were to be 100 and 32℃, respectively, and Tev=0℃ was used to get the simulated results. Operating and design circumstances presented a numerical investigation conducted into how some critical factors, such as the thickness of the adsorbent bed and the temperature of the heat source, affect system performance. For values in the range of 10-90 mm, the radial thickness of the adsorbent bed is a crucial component for system optimization. Its impact on specific cooling power (SCP) and refrigeration cycle performance COP.
One of the recommendations for potential system performance enhancements, Palomba et al. [51] presented a design analysis based on the experimental data. The acquired results showed that it is possible to achieve performance by using an activated carbon/ethanol working pair similar to other dangerous refrigerants like ammonia and methanol by using a non-toxic refrigerant like ethylene. It is advised to replace the rectangular adsorber vessels with cylindrical ones since the thickness of metal sheets needed for a vacuum. As a result, it would be reasonable to anticipate a notable decrease in heat losses and a notable increase in COP.
Even though researchers have proved that heat and mass transmission inside the bed are the primary determinants of bed performance, this knowledge still requires more explanation. For performance improvement through the design of the generation adsorbent bed, a significant decrease in the internal masses might result in a more effective design. On the other hand, several researchers also carried out experimental and computational studies to examine the impact of particle size and adsorbent layer thickness on kinetics. Researchers have noted that heat and mass transmission inside the bed were the primary determinants of bed performance; however, further clarification of this information is still needed.
A dynamic investigation of methanol adsorption in compact adsorbent layers was discussed by Girnik et al. [52] Adsorbent and binder, respectively, were polyvinyl alcohol and marketable AC called ACM-35.4. At a given binder concentration of 12 weight percent, investigated the effects of layer thickness and carbon particle size on the Volumetric Large Temperature Jump (V-LTJ) dynamics. It is obvious that in an adsorptive refrigerator bed, the binder can improve mass and heat transmission. In comparison to packed beds, the process accelerated by a ratio of 1.5-3.5 for the compact layers.
The Biot number represents the body’s internal conduction resistance divided by its external convection resistance. Since weakly conducting materials have greater resistance to heat conduction, their Biot numbers are more likely to be bigger. Some bodies are seen in heat transfer analysis to behave as a "lump" whose total body temperature is constant during a heat transfer process. The lumped system analysis is a type of heat transfer analysis that makes use of this idealization. The Fourier number measures the ratio of heat stored to heat transferred through a body. Therefore, a high Fourier number denotes a quicker rate of heat transmission throughout the body. Given that the Fourier number is a function of time, two times a term will result in two times the Fourier number [53].
Alam et al. [54] investigated the effect of design parameters for silica gel/water solar adsorption chiller on performance. The findings indicate that the bed adsorbent reactor design characteristics have a significant impact on the ideal switching frequency. The number of transfer units, the number of adsorbent bed Biots (Bi), the heat exchanger thickness / the fluid channel radius, the fluid alpha number), and the alpha number of the inert material were the characteristics that define the design parameters. Scherle and Nieken [55] introduced an optimization method based on models to enhance the performance of adsorption heat pumps. Two steps are involved in the optimization process. For a particular adsorption material, first, optimize the cycle duration, the thickness of the adsorbent, and the operating parameters. In the second stage, we forecast mass and heat transport as well as adsorption capacity based on structural material properties using a material model. Kundu [56] inspected parametrically the thermal analysis of a variable solar adsorption bed thickness of a flat plate solar collector. A novel analytical formulation has been established using the Differential Transform Method (DTM). The improved Bessel's function has been utilized to compare the outcomes generated by DTM. The effectiveness of the adsorber has been examined as a function of Biot number.
For performance improvement through the design of the generation adsorbent bed, a significant decrease in the internal masses might result in a more effective design. On the other hand, several researchers also carried out experimental and computational studies to examine the impact of particle size and adsorbent layer thickness on kinetics. Researchers have noted that heat and mass transmission inside the bed were the primary determinants of bed performance; however, further clarification of this information is still needed.
Bahrehmand et al. [57] carried out parametric research to examine the impact of critical factors, such as generation bed geometry, heat transfer characteristics, and cycle duration, on solar cooling adsorption performance. The analytical proposed solution optimized (i) fin thickness and height of fin, (ii) adsorbent bed thickness, (iii) fluid channel height, (iv) the quantity of thermally-conductive additive in the composite adsorbent, and (vi) cycle duration.
The literature demonstrates that another sophisticated choice, solar adsorptive refrigerators, and air conditioning technologies are vital, workable solutions that outweigh the drawbacks of traditional adsorptive engines. Investigation research on the solar adsorptive refrigeration machine has been done, both theoretically and experimentally. Because it is expensive and takes a lot of time to do experimentally, optimizing the design of absorber beds is particularly challenging.Different working operational pairings, design sizes, and heating resources can all be used to solve the problems. Depending on the operational environment, various working pairs provide varied results. Furthermore, it seems that not much study has been done on adsorption refrigeration systems, particularly in Iraq when using ethanol as the adsorbate. In this paper, the adsorbent thickness will be optimized to improve the performance and SCP. Depending on previous work [14] same cooling machine.
An activated carbon-filled solid generator bed is one of the three main components of a solar adsorption refrigerator unit. The evaporator and condenser sections. When the operation starts, the working fluid is still condensed inside the system due to closed valves connecting the evaporator and generator bed. While being charged with refrigerant, the evaporator and the adsorbent bed maintain low temperatures and vacuum pressures at this point. The basic schematic intermittent solar adsorption refrigerator unit is seen in Figure 1. In addition, Figure 2, describes the single geometry bed design, which includes the solar collector, condenser, also evaporator. It is important to remember, nevertheless, that adsorption-cooling technologies have frequently faced criticism due to their comparatively worse performance in contrast to conventional cooling techniques.
3.1 Operation principles of solar desorption cooler
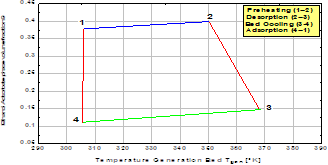
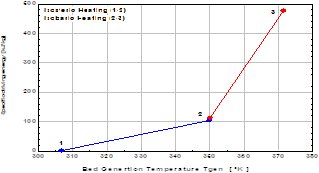
A renewable resource of thermally vitality, such as solar radiative intensity simulated via the sun, takes the role of the traditional steam compressor electrical system in the solar energy adsorption cooling technique. The Clapeyron chart in the illustration illustrates the four processes, Figure 3, that describe the operating cycle of the system. A cycle in this system lasts for one day. The daytime high is followed by a nighttime low in temperature as established in Figure 4. Adsorption solar refrigeration systems work on the following fundamental cycle process [58]:
Isosteric heating (1→2), Isobaric heating (2→3)
Isosteric cooling (3→4), Isobaric cooling (4→1)
Figure 1. Schematic diagrams of the: Prototype of solar adsorption refrigerator
Figure 2. Schematic diagrams of the basic bed adsorption intermittent cycle
Figure 3. The cycle diagram of the adsorption cycle
Figure 4. The diagram of the adsorption cycle
The preheating process (1→2), with (xmax) the maximum concentration of ethanol (and the desorbing process (2→3), (xmin), and combined, make up approximately half a cycle of the system. The pre-cooling (3→4) & adsorptive procedures (4→1) make up the other half. The generating reactor (bed) absorbs solar radiation all through the reheating phase, raising the temperature of the adsorbent (such as AC, zeolite, or silica gel) as well as the solvent (such as methanol, ethanol, and water), such as adsorbate. Due to the system's single bed, it operates erratically, meaning that cold air is not continuously produced. A cycle in this system lasts for one day. The daytime high is followed by a nighttime low in temperature as established in Figure 3. The following paragraph explains the description of the four operational cycle procedures [58].
3.2 The mechanism of the current solar adsorption case
A basic-bed adsorptive cooling machine performs less well because of its intermittent nature. Due to the inconsistent performance of the single-bed system, the dual-bed solar as seen in Figure 5. A continuous adsorption-cooling machine is recommended.
Figure 5. Diagram of the two-bed-solar adsorptive cooler
For controlling the stream of cold/hot water, four valves were installed to adjust the direction of the reactor adsorbent beds. The schematic diagram of the current solar adsorption refrigeration unit is displayed in Figure 5. There are two beds in the system, and each bed experiences intermittent heating and cooling. Bed 1 reactor in desorbed ethanol and the second reactor bed in the adsorption phase can be used to heat and cool the structure, respectively. The system is more ecologically friendly since it runs on solar energy, which heats the water using a solar collector can be found in reference [14].
4.1 Adsorption equilibrium and kinetics
As the vapor of ethanol strikes the surface of the activated carbon, which is a solid, the gas molecules were struck within the solar adsorption bed. While some of the impacting molecules bounce back, others adhere to the surface and become adsorbed. Because of the significant exposed area at the beginning of this process, the adsorption rate is high. The adsorption rate decreases as more ethanol molecules cover the activated carbon surface [59]. Within the current model of solar adsorptive machine, the Dubinin-Astakhov equation is used to estimate the ethanol/AC uptake pair.
$\mathrm{X}(\mathrm{P}, \mathrm{T})=\omega_0\ \rho_m(\mathrm{T})\ \exp \left\{-\left(\frac{R}{\epsilon E_0}\right)^{n}\left(\mathrm{T} \cdot \ln \left(\frac{\mathrm{P}_{\text {sat }}(T)}{\mathrm{P}}\right)^{\mathrm{n}}\right)\right\}$ (1)
${{\text{X}}_{0\text{ }\!\!~\!\!\text{ }}}$ represents the maximum adsorbent uptake of the adsorbate, and it is correlated with both the adsorbent's density $\omega_0\ \rho_m(\mathrm{T})$ and its limiting micropore volume ${{\text{ }\!\!\omega\!\!\text{ }}_{0}}$. The density is taken to remain constant for simplicity's sake. The introduction of$~D$, a characteristic constant for the working pair, is the second portion of the statement that may be made simpler. It is made up of the gas constant $R$, affinity coefficient $\epsilon $, n is the characteristic parameter, and the characteristic adsorption energy ${{E}_{o}}$ of the working pair.
where, $D=\left(\frac{R}{\epsilon\ E_0}\right),\ \mathrm{X}_0=\omega_0\ \rho_m(\mathrm{T})$ (2)
The saturation pressure based on the temperature of the adsorbent is ${{\text{P}}_{\text{sat}}}$ (${{\text{T}}_{\text{Sat}}}$) [60].
$\mathrm{X}(\mathrm{P}, \mathrm{T})=\mathrm{X}_0\left[\exp \left\{-\mathrm{D}\left(\mathrm{T} \ln \frac{\mathrm{P}_{\text {sat }}}{\mathrm{P}}\right)^{\mathrm{n}}\right\}\right]$ (3)
$\mathrm{X}\left(\mathrm{T}, \mathrm{T}_{\text {sat }}\right)=\mathrm{X}_0\left[\exp \left\{-\mathrm{K}\left(\frac{\mathrm{T}}{\mathrm{T}_{\text {Sat }}}-1\right)^{\mathrm{n}}\right\}\right]$ (4)
The quantity of ethanol (refrigerant) adsorbed kg/kg of AC (adsor-bent) is characterized via the symbolization [X (P, T) (kg. kg-1)]. The beds of the AC bed unit affect the ethanol uptake at generation temperature (T) and (P) the generation bed pressure. The maximum adsorpative uptake of ethanol (${{\text{X}}_{0}}$,) is strong-minded by the (D) structure factor distinctive toward the arrangement of refrigerant-adsor-bent. While ${{\text{P}}_{\text{sat}}}$ demonstrates ethanol-saturated pressure at the evaporator and adsorber bed temperatures; (P) designates the stabilizing pressure of the AC/ethanol refrigerant grouping. The microstructure of the AC material besides the affinity factor, D or (X) denotes the equilibrium adsorption (ethanol uptake) on activated carbon. The processes stated in section (3.1) provide the energy balance equation that is used in the mathematical thermodynamically modeling of the machine. The starting baseline limitations equally listed in the study of Mohammed and Alhialy [14], were used in the simulated program. Using the EES program, the saturation property of ethanol may be found.
4.2 Methodology for thermodynamic investigation
The discontinuous adsorptive cooler unit's performance is not optimized. The intermittency problem with single-bed systems is recommended to be resolved by a solar adsorptive cooler machine with two beds. This research focuses mostly on optimizing concluded two groups of key parameters, operational and geometrical parameters. The geometrical design parameters concluded of, the geometrical shapes of the two beds, bed generator thickness, density of the adsorbent, the thermal conductivity of the adsorbent (k), Biot number (Bi), and Fourier number (Fo). Whereas the operational key parameters in addition to the working-pair qualities of (AC/ethanol), operational parameters that affected the COP and SCP of the machine by optimizing cooling time. The simulation modeling takes into account the features of the bed, the distribution maximum bed generating temperature at different points, evaporator temperature, condenser temperature, and surrounding ambient conditions. The optimization was performed by modeling simulation by the EES program, which uses a one-dimension-transient distribution temperature profile for (4) locations at the generator adsorbent bed of 2-bed adsorption refrigerator systems to provide cooling effects powered by solar energy.
Due to the complexity of the heat and mass transmission mechanism in a granular adsorbent bed, some assumptions must be made to determine the governing equations. The mathematical model proposed in this study is primarily based on the following assumptions and simplifications:
4.2.1 Isosteric heating phase
The initial action is taken in the daytime. The heat from the sun is absorbed by the solar collector and added to the system. The metal encloses (cylinder & covering), AC, and the sensibility heating from ethanol make up the total heat contributed until the pressure hits ${{\text{P}}_{\text{con}}}$, and the bed's valve is closed, $({{\text{Q}}_{1-2}}$). The generator component's perceptible heat can be expressed as follows:
${{\text{Q}}_{1-2}}=\left( {{\text{Q}}_{\text{tube}}}_{1-2}+{{\text{Q}}_{\text{shell}}}_{1-2}+{{\text{Q}}_{\text{AC}.}}_{1-2} \right)\text{*}\left( {{\text{T}}_{\text{sd}}}-{{\text{T}}_{\text{ad}}} \right)+\text{ }\!\!~\!\!\text{ Q}\_\text{et}{{\text{h}}_{1-2}}$ (5)
where, the sensibility heating of metal (cylinder &covering), and AC are [14]:
$\begin{aligned} \Delta \mathrm{U}_{\text {tube }}+\Delta \mathrm{U}_{\text {shell }} & +\Delta \mathrm{U}_{\mathrm{AC}}=\left(\mathrm{m}_{\text {tube }} \cdot \mathrm{c}_{\text {tube }}+\mathrm{m}_{\text {shell }} \cdot \mathrm{c}_{\text {shell }}\right.\left.+\ \mathrm{m}_{\mathrm{AC} .} * \mathrm{c}_{\mathrm{AC} .}\right)\left(\mathrm{T}_{\text {sd }}-\mathrm{T}_{\mathrm{ad}}\right)\end{aligned}$ (6)
Using the EES software, the specific internal energy of liquid ethanol at a specific internal energy status, ${{\text{U}}_{\text{eth}{{.}_{2}}}}\text{ }\!\!~\!\!\text{ }\And \text{ }\!\!~\!\!\text{ }{{\text{U}}_{\text{eth}{{.}_{1}}}}$ may be directly determined by utilizing two properties: the saturation temperature and the dryness fraction $\left( \text{x} \right)$. ${{\text{T}}_{\text{sd}}}$ may be obtained by: since T/Tsat is constant lengthwise an isosteric process.
${{\text{Q}}_{1-2}}=\left( {{\text{m}}_{\text{tube}}}.{{\text{c}}_{\text{tube}}}+{{\text{m}}_{\text{shell}}}.{{\text{c}}_{\text{shell}}}+{{\text{m}}_{\text{AC}.}}.{{\text{c}}_{\text{AC}.}} \right)\left( {{\text{T}}_{\text{sd}}}-{{\text{T}}_{\text{ad}}} \right)+\text{ }\!\!~\!\!\text{ }{{\text{m}}_{\text{AC}.}}.{{\text{x}}_{\text{max}}}.\left( {{\text{U}}_{\text{eth}{{.}_{2}}}}-{{\text{U}}_{\text{eth}{{.}_{1}}}} \right)$ (7)
4.2.2 Isobaric desorption phase
At this phase, the bed reactor goes through a phase of desorption when reaches condensation pressure. The bed will continue to desorb until it attains its maximum temperature, as a result, the adsorbate's uptake (${{\text{x}}_{\text{max}}})~$adsorbent bed decreases to its minimum limit (${{\text{x}}_{\text{min}}}$)). In this process, the heating is exchanged with the metal (tube and shell), the adsorbate (${{\text{Q}}_{2-3}}$ + ${{\text{Q}}_{\text{des}}}$), and the adsorbent activated carbon is added to determine the overall heat exchange (${{\text{Q}}_{2-3}}$). The following is an expression of the heat produced in this process:
$\begin{aligned} & Q_{2-3}=m_{A . C .} \cdot \Delta x . h_g+m_{A . C .} . \Delta x . \mathrm{h}_{a d}+m_{\text {A.C. }} . \Delta x .\left(U_{e t h_3-} U_{e t h_2}\right)+\left(m_{\text {tube }} \cdot c_{\text {tube }}+m_{\text {shell }} \cdot c_{\text {shell }}\right.\left.+\ m_{\text {A.C. }} \cdot c_{\text {A.C. }}\right)\left(T_{g e n}-T_{s d}\right) \\ & \end{aligned}$ (8)
The overall energy balance formula via a controlled volume without any workable performed is:
$\delta\text{Q}=\sum\text{m}_\text{e}\text{h}_\text{e}-\sum\text{m}_\text{i}\text{h}_\text{i}+\delta\dot{\text{Q}}+\text{dU}_\text{CV}$ (9)
The saturation pressure was attained in the desorption and adsorption processes, ${{\text{P}}_{\text{con}}}\text{ }\!\!~\!\!\text{ and }\!\!~\!\!\text{ }{{\text{P}}_{\text{eva}}}$ respectively.
H is the heating of desorption kJ /kg of adsorbate. Given the slope of lines (1$\longrightarrow$2) and (3$\longrightarrow$4) in Figure 3 [60].
The increment in internal energy of the C.V. is:
$\begin{aligned} & \Delta U_{\text {tube }_{2-3}}+\Delta U_{\text {shell }_{2-3}}+\Delta U_{\text {A.C. } 2_{2-3}}=\int_2^3\left(m_{\text {tube }} \cdot c_{\text {tube }}+m_{\text {shell }} \cdot c_{\text {shell }}\right.\left.+m_{\text {A.C. }}\cdot c_{\text {A.C. }}\right) d T=\left(m_{-} \text {tube.c_tube }\right.+m_{-} \text {shell.c_shell } \left.+m_{\text {A.C. }} \cdot c_{\text {A.C. }}\right)(\text { Tgen }-T s d)\end{aligned}$ (10)
$Q_{\text {des }}=m_{A \cdot C \cdot} \cdot \Delta x \cdot \mathrm{h}_{a d}$ (11)
The sum of the isosteric and desorption heat is known as the production or regeneration energy, and it is stated as follows:
$\begin{aligned} & Q_{1-3}=Q_{1-2}+Q_{2-3} \\ & Q_{1-3}=\left(m_{\text {tube }} \cdot c_{\text {tube }}+m_{\text {shell }} \cdot c_{\text {shell }}\right. \left.+m_{\text {A.C. }} \cdot c_{\text {A.C. }}\right)\left(T_{g e n}-T_{a d}\right) +m_{\text {A.C. }} \cdot x_{\max }\left(U_{\text {eth. } 2}-U_{\text {eth. } 1}\right) +m_{\text {A.C. }} . \Delta x . h_g+m_{\text {A.C. }} \Delta x . \mathrm{h}_{a d} +m_{\text {A.C. }} . \Delta x .\left(U_{e t h_3-} U_{e t h_2}\right) \end{aligned}$ (12)
4.2.3 Isosteric cooling phase
Cooling and depressurization, which is the third stage from state 3 to state 4, is similar to ${{Q}_{3-4}}$ the heat rejected, or the initial process (1→2). Comparable to the process of heating, outlines (3→4) show the uptake of ethanol stays unvarying. Even by the minimum level (${{x}_{min}}$). As the bed temperature drops to ${{T}_{sa}}$, the pressure also drops.
${{Q}_{3-4}}=\left( {{m}_{tube}}.{{c}_{tube}}+{{m}_{shell}}.{{c}_{shell}}+{{m}_{A.C.}}.{{c}_{A.C.}} \right)\left( {{T}_{gen}}-{{T}_{sa}} \right)+{{m}_{A.C.}}.{{x}_{min}}\left( {{U}_{eth{{.}_{4}}}}-{{U}_{eth{{.}_{3}}}} \right)$ (13)
4.2.4 Isobaric adsorption phase
The energy equilibrium of CV is:
$\delta Q=d{{U}_{CV}}+{{h}_{e}}.d{{m}_{e}}$ (14)
The bed cycle's fourth and final stage involves further cooling and ethanol adsorption. Ethanol liquid from the receiver is throttle going from high pressure (${{P}_{con\text{ }\!\!~\!\!\text{ }}}$) to low pressure (${{P}_{eva\text{ }\!\!~\!\!\text{ }}}$). Saturated ethanol's mass and enthalpy are signified by the variables$~{{\text{m}}_{\text{e}}},\text{ }\!\!~\!\!\text{ }{{\text{h}}_{\text{e}}}$. As a result, the ethanol mass refrigerant starting evaporation is:
$\begin{aligned} & m_{\text {eth }}=m_{\text {A.C. }}\left(x_{\max }-x_{\min }\right) =m_{\text {A.C. }} . \Delta x, \text { Where }\left(x_{\max }\right.\left.-x_{\min }\right)=\Delta x\end{aligned}$ (15)
$\begin{aligned} & Q_{4-1}=\left(m_{\text {tube }} . c_{\text {tube }}+m_{\text {shell }} \cdot c_{\text {shell }}\right. \left.+m_{A . C .} c_{A . C .}\right)\left(T_{s a}\right. \left.-T_{a d}\right)+m_{\text {A.C. }} x_{\min }\left(U_{e t h .4}\right.\left.-U_{e t h .1}\right)+m_{\text {A.C. }} \Delta H \cdot \Delta x \\ & \end{aligned}$ (16)
4.2.5 The condenser thermal state
The desorption vapor of ethanol is received by the condenser during the desorptive period. By taking the energy out of the superheated vapor in this unit, the ethanol vapor is de-superheated first. The vapor of ethanol starts condensation once one touches the saturation evaporation phase, dropping that one latent-heat energy toward the circumscribing heating drop through a variance equal to $({{T}_{con}}$-${{T}_{amb}}$). By rejecting heat to the surroundings, the evaporation is cooled near the temperature of ambient, this heat is provided by:
$\begin{gathered}Q_{\text {con }}=m_{\text {A.C. }} \Delta x\left(L_{\text {eth }}\right)+m_{\text {A.C. }} c_{\text {eth }} \int_{T_{\text {con }}}^{T_{\text {gen }}}\left(T_{\text {con }}-T\right) . \\ {\left[\frac{\partial x}{\partial T}\right]_{P_{\text {con }}} d T}\end{gathered}$ (17)
4.2.6 The evaporator thermal state
The liquid ethanol in the evaporator element evaporates, producing cold. The cooling production at the evaporator is computed as follows:
$Q_{\text {eva }}=m_{\text {A.C. }} \cdot \Delta x\left(h_{g_e}-u_{r_f}\right)$ (18)
The daily total amount of ice generated by the refrigerator machine. For icing requests, can use the following formulae to calculate the freezing water temperature and ice mass ($~{{m}_{ice}})$.
$\begin{aligned}\mathrm{m}_{\text {ice }}& =\frac{Q_{\text {eva }}}{\left(\mathrm{L}_{\text {ice }}+\mathrm{c}_{\mathrm{w}}\left(\mathrm{T}_{\text {iw }}-273.15\right)+\mathrm{c}_{\text {ice }}\left(273.15-\mathrm{T}_{\text {ice }}\right)\right)+\mathrm{m}_{\text {eva }} \mathrm{c}_{\text {eth }}\left(\mathrm{T}_{\mathrm{iw}}-\mathrm{T}_{\text {eva }}\right)}&\\&\mathrm{T}_{\text {eva }}<273^{\circ}\end{aligned}$ (19)
If the cooling system serves as a water chiller, air conditioning application, or cold chamber for storing fruits and vegetables, the amount of chilled water produced each day is determined by:
${{\text{m}}_{\text{cwc}}}=\frac{{{\text{Q}}_{\text{eva}}}}{{{\text{c}}_{\text{w}}}\left( {{\text{T}}_{\text{iw}}}-{{\text{T}}_{\text{eva}}} \right)}~~{{T}_{eva}}>273{}^\circ $ (20)
4.3 The performance estimation for solar adsorption cooling system
(a) Coefficient of performance (COP)
The performance coefficient (COP) is defined as the ratio of refrigeration delivered (Qeva) / input heat (Qadded):
$COP=\frac{{{Q}_{eva}}}{{{Q}_{added}}}$ (21)
$\text{C}\mathbf{OP}=\frac{{{\mathbf{m}}_{\mathbf{A}.\mathbf{C}.}}.\mathbf{∆x}\left( {{\mathbf{h}}_{{{\mathbf{g}}_{\mathbf{e}}}}}-{{\mathbf{u}}_{{{\mathbf{r}}_{0}}}} \right)}{\left( \begin{matrix}\left( {{\mathbf{m}}_{\mathbf{tube}}}.{{\mathbf{c}}_{\mathbf{tube}}}+{{\mathbf{m}}_{\mathbf{shell}}}.{{\mathbf{c}}_{\mathbf{shell}}}+{{\mathbf{m}}_{\mathbf{A}.\mathbf{C}.}}.{{\mathbf{c}}_{\mathbf{A}.\mathbf{C}.}} \right)\left( {{\mathbf{T}}_{\mathbf{gen}}}-{{\mathbf{T}}_{\mathbf{ad}}} \right)+{{\mathbf{m}}_{\mathbf{A}.\mathbf{C}.}}.{{\mathbf{x}}_{\mathbf{max}}}\left( {{\mathbf{U}}_{\mathbf{eth}{{.}_{2}}}}-{{\mathbf{U}}_{\mathbf{eth}{{.}_{1}}}} \right) \\+{{\mathbf{m}}_{\mathbf{A}.\mathbf{C}.}}.\mathbf{∆x}.\left( {{\mathbf{U}}_{\mathbf{et}{{\mathbf{h}}_{3}}-}}{{\mathbf{U}}_{\mathbf{et}{{\mathbf{h}}_{2}}}} \right)+{{\mathbf{m}}_{\mathbf{A}.\mathbf{C}.}}.\mathbf{∆x}.{{\mathbf{h}}_{\mathbf{ad}}}\\\end{matrix} \right)}$ (22)
(b) Cooling capacity (SCC)
The cycle's coefficient of performance (COP) and cooling capacity power (SCC) dictate how effectively the adsorption refrigeration system performs. The efficiency with which solar energy or heat added (Qadded) is converted into a cooling capacity related to (Qeva). It is thus feasible to write it as follows using the cooling capacity (SCC) for two beds:
$\mathrm{SCC}=\frac{\mathrm{Q}_{\mathrm{eva}}}{2 * \text { Cycle Time } * 3600}$ in $\mathrm{W}$, (23)
(c) Specific cooling effect (SCE)
The specific cooling effect can be defined by the cooling energy (Qeva) divided by the activated carbon mass as:
$SCE=\frac{{{Q}_{eva}}}{{{m}_{A.C}}}$ kJ/kg (24)
(d) Specific cooling power (SCP)
Depending on the system's capacity, different systems have different specific cooling powers (SCPs), evaluated upon the production of cold water, which is utilized to determine an adsorption's usefulness. Cooling systems in different dimensions. (SCP) was the ratio (SCC) to the AC mass-filled reactor bed:
$SCP=\frac{SCC}{{{m}_{A.C}}}~W/kg$ (25)
Since Specific Cooling Power (SCP) is related to both the mass of the adsorbent and the cooling capacity, it may be used to determine the size of a machine by gauging the refrigeration created / mass of AC / cycle time. This section displays the size of the system. System stability is indicated by a greater SCP value for a nominal cooling load.
4.4 Equilibrium of energy throughout the entire system
The unit's total input energy (Qadded) and output production (Qrejected) may be calculated using the following formulas:
${{Q}_{added}}={{Q}_{1-2}}+{{Q}_{2-3}}+{{Q}_{eva}}$ (26)
${{Q}_{rejected}}={{Q}_{3-4}}+{{Q}_{4-1}}+{{Q}_{con}}$ [14] (27)
4.5 Proposed bed geometry adsorbent bed
Although there are many varieties and styles, this technique primarily allows for two designs: the rectangular and tubular adsorbent bed. The adsorbent is evenly distributed in a rectangle geometry in the rectangular design, which is split by fins that distribute the heat similarly. The adsorbent will be dispersed in cylinders of the tubular configuration. Usually, metals with strong heat conductivity qualities are used to make these tubes. The features of a tubular design are its ability to tolerate pressure differences and its straightforward construction. However, the rectangular shape may make it simpler to disperse the heat, and one single bed can accommodate more activated carbon.
4.5.1 Bed temperature distribution
The heat transfer coefficient of the system will have different values at cooling than at heating. Nevertheless, for the period of the cooling process, the temperature will not be evenly spread across the bed, where ${{T}_{new}}$ is the new temperature, ${{T}_{amb}}$ is the ambient temperature, and ${{T}_{old}}$ is the previous temperature, provides the transitory heat transfer [53].
$\theta =\frac{{{T}_{new}}-~{{T}_{amb}}~}{{{T}_{old}}-{{T}_{amb}}}$ (28)
Eq. (36) provides the dimensionless temperature, denoted by $\theta$, which is dependent on both the Fourier and Biot numbers:
${{B}_{i}}=\frac{alpha~L}{k},~~{{F}_{o}}=\frac{\alpha t}{{{L}^{2}}}$ (29)
$\frac{1}{tan{{\mu }_{n}}}=~\frac{{{\mu }_{n}}}{{{B}_{i}}}$ (30)
The Biot number is symbolized by the symbol $~~{{B}_{i}}$, where $\text{alpha}~$ is the external heat transfer coefficient (or outside film coefficient) is a convection coefficient, in, $~\frac{W}{{{m}^{2}}K}, L~$ denotes the conduction length in, $~~m$ and $k~$represents the body's thermal conductivity in $\frac{W}{K.m}$ .${{F}_{o}}$ Is the Fourier number, where, $\alpha ~$ is thermal diffusivity in, $~\frac{{{m}^{2}}}{sec}$ and $t$ is time in sec. The thermal diffusivity is recognized as, $\alpha =\frac{k}{{{C}_{p}}~\rho }$ where ${{C}_{p}}$ specific heat and $\rho $ is the density of AC the roots ${{\mu }_{n}}$ is the solution Eigen (roots), for the parametric Eq. (30).
4.5.2 Flat temperature distribution profile
For plane adsorbent bed geometry, for the range of Biot values 0.1 < Bi < 100. The following equation defines the distribution of bed temperature. Where, $\cos \left( {{\mu }_{n}}\frac{x}{L} \right)$ characterizes the precise location of the computed temperature:
$\theta=\sum_{n=1}^{n \rightarrow \infty} \frac{2 \sin \mu_n}{\mu_n+\sin \mu_n \cos \mu_n} \cos \left(\mu_n \frac{x}{L}\right) \exp \left(-\mu_n^2 F_o\right)$ (31)
For plane bed design, at the central bed, $x=0$. After determining the temperature profile for the center, the temperature profile of the plate's surface is obtained by setting $x=L$, and setting $x=0.5\ L$ obtains the temperature profile of the plate's middle. It is important to find the average distribution of the plane temperature to estimate the loading heat outline. To find the average temperature profile, use the equation:
$\bar{\theta}=\sum_{n=1}^{n \rightarrow \infty} \frac{2 \sin ^2 \mu_n}{\mu_n^2+\mu_n \sin \mu_n \cos \mu_n}\ \exp \left(-\mu_n^2 F_o\right)$ (32)
4.5.3 Cylindrical design temperature distribution profile
For the tubular bed geometry, the listed below are usable, which is the Bessel function is:
$\theta=\sum_{n=1}^{n \rightarrow \infty} \frac{2 \mathrm{~J}_1\left(\mu_n\right)}{\mu_n\left[J_0{ }^2\left(\mu_n\right)+J_1{ }^2\left(\mu_n\right)\right]} J_0\left(\mu_n \frac{x}{r}\right) \exp \left(-\mu_n^2 F_o\right)$ (33)
The roots$~{{\mu }_{n}}$ is the solution of the parametric equations below:
${{y}_{n}}=\frac{{{\mu }_{n}}}{{{B}_{i}}},~~{{y}_{n}}=\frac{1}{\tan {{\mu }_{n}}}$ (34)
In this modeling only three of roots $\left(\mu_n\right),\ (\mathrm{n}=3)$ because additional terms have neglected effects on adsorbent bed generation temperature profile, $\boldsymbol{\mu}_{\boldsymbol{n}}$ is reiterated. The ranges of these roots, $\mu_1=(0-2), \mu_2=(3-5), \mu_3=(6-8)$.
The average dimensionless temperature is calculated by the Equation below:
$\theta =\frac{{{T}_{t}}-~{{T}_{amb}}~}{{{T}_{t=0}}-{{T}_{amb}}}$ (35)
To calculate the average temperature profile through the tabular bed, use the listed equation:
$\bar{\theta }=\underset{n=1}{\overset{n\to \infty }{\mathop \sum }}\,\frac{4B_{i}^{2}({{\mu }_{n}})}{{{\mu }_{n}}^{2}\left[ {{\mu }_{n}}^{2}+B_{i}^{2} \right]}\text{exp}\left( -\mu _{n}^{2}~{{F}_{o}} \right)$ [53] (36)
4.6 Transient analysis - cooling transient
For most performance and cold production improvement way of solar adsorption machines, is rapid heating and cooling of the systems. The features of granular activated carbon determine the temperature profile in the bed, or how long it takes the entire bed to cool down. The four key factors may be adjusted to varying ranges: the thickness of the bed (Ro-Ri), the density of adsorbent (ρ), the external heat transfer coefficient (alpha), and the conductivity (k). It is essential to understand that the adsorption heat is not taken into consideration. Just the bed is a cooling process, stage (3→4).
4.6.1 Bed cylindrical design
Although there are many varieties and styles, using tubes filled with activated carbon with ethanol, as an adsorbent bed. Figure 6. Depicts the cylindrical geometrical design of the adsorbent bed with inner and outer tubes. The region between the two tubes (tabular) is filled with activated carbon. Since the adsorbent bed's upper and lower surfaces were insulated, it was thought that mass and heat transmission only happened radially. Ethanol vapor, or the adsorptive material, moved from the inlet's surface (R=Ri) to the bed's exterior (R=Ro). There are several benefits to this design.
In the current adsorbent bed design, the equivalent radius (Ro-Ri) of the tubular generator bed was 0.048 m, whereas the inner and outer radius of the annular adsorbent bed were 0.06 and 0.012 m, respectively. Contains an AC. mass of 16 kg with a density of 2200 kg/m3, 1m length of the cylindrical bed, and (1×1) m2 solar water collector serving as the fluid exchanger.
Figure 6. Bed cylindrical generator geometry
The current work focuses on the optimization of the COP and SCP of a solar-powered two-bed adsorption refrigeration system that employs an isobaric adsorption technique. This optimization is done by optimizing the bed thickness with cooling time. An analysis has been conducted for the existing system's performance. The parameters that were taken into account for this study are from the study of Mohammed and Alhialy [14]. An EES program was carried out for the simulation and mathematical model of the current duration of a two-unit-bed solar adsorptive cooler machine. Ethanol thermodynamic properties are exported by the EES program. By solving the energy balance condenser, the bed beside the evaporator equations, is used for the imitation of the appropriate computer-code. The next part provides a summary of the simulation's results. Two EES program simulations and modeling comprise the modeling process. First, the modeling of the operational key parameters using a straightforward thermodynamic analysis. Next, an exploration of the bed's thermal profile is conducted to map potential bed thickness and optimum cooling time.
In conclusion, the operation over a day with alternatives in solar radiation and the surrounding temperature is modeled, and the Engineering Equation Solver (EES) is used for all computations. The condenser, evaporator, and bed are all included in the system's energy balance. It was found that the entire energy output removed from the system (Q_rejected) is equal to 11845 kJ, whereas the total input energy added (Q_added) from the water, solarized-collector is (11893 kJ). The calculations' relatively error therefore was about 0.4, which is a respectably acceptable inaccuracy that attests to the correctness of the investigation. Additionally, at 5169 kJ for total cooling production (Qeffect) and (7200 kJ) for total heat input (Qinput), the system accomplishes a coefficient of performance (COP) of 0.702.
The current two-bed solar adsorptive cooler machine uses 16 kilograms of activated carbon per bed with a thickness of 0.048 m to make 39.4 kg of chilled water at 5℃. At a temperature of 5℃, it generated 1 kilogram of cooled water for every 2.463 kg of activated carbon. (359.4 W= SCC), (11.22 W/kg is the SCP) in addition, (SCE is 161.5 kJ/kg). The optimum bed thickness is 0.048 m with optimum cooling time for the central bed location starting with (30) ended at (75) min with thermal conductivity with k=0.1, alpha=10.
5.1 The operational parameters effect
The effects of the operating parameters have been investigated using the EES software, Engineering Equation Solver software, which was created for the thermodynamic study of the system's cycle parameters (Figure 3). Under the previously mentioned operating and design circumstances, a numerical examination is carried out in this part. The impact of many critical factors, including the thickness of the adsorbent bed and the maximum desorption temperature of the heat source, upon the system's performance and SCP is examined. The results of the simulation are displayed visually.
5.1.1 Daytime effects on hot water cycle operation and ambient temperature
As shown in Figure 7(a), meteorological data, such as sun intensity and air temperature, are influenced by the time of day. The weather for the day determines the maximum generation temperature and the time it happens each day. On a bright day (March through June), Baghdad's typical sunrise and sunset times of 6 a.m. and 6 p.m., respectively, help determine the solar intensity and local ambient temperature throughout the day (hypothetical clear day). During the day, the sun's intensity increases from 200 to a high of 950 to 1000 W/m2 between 12 and 1 p.m., and then it falls to 100 until 6 p.m.
Following that, there is no sun radiation until six a.m. the next morning. A similar pattern for the ambient temperature is seen starting at 6:00 a.m., Figure 8 also shows the daily variations in the hot water's temperature. Both the sun's intensity and the temperature of the hot water follow the same pattern throughout the day. The strong correlation between light intensity and water temperature helps to explain this trend.
The generator bed's pressure alterations with bed temperature are seen in Figure 7(b). When the evaporation pressure (Peva) is 2.408 kPa, the bed generation pressure starts to rise, until the maximum adsorbate concentration (Xmax) verified isosteric heating (1→2), at which point the condensation pressure (Pcon) is 23.14 kPa. When the bed reaches 78℃, the refrigerant starts to desorb.
(a) Hot water & Tamb
(b) Pgen
Figure 7. Daytime effects
The relationship between the adsorbate ethanol uptake ratio and the adsorption bed temperature is shown in Figure 8(a). According to this figure, the adsorbate concentration ratio changes across the cycle between the maximum (0.5152- 0.12) a minimum kg. kg -1. Through this process, it is predicted that the equivalent masses of ethanol adsorbed are (8.24 and 1.92) kg. Consequently, the circulated mass of ethanol cycling operating current machine is 6.32 kg, and the productivity of ethanol is 76.0%.
(a) Ethanol uptake changing
(b) Adsorbate refrigerant volume fraction
Figure 8. Tgen profile
Figure 8(b) shows how the adsorbate volume fraction changes in response to bed temperature. This drawing illustrates how the adsorbate volume fraction varies constantly in the isobaric path of the cycle. Throughout the two-isosteric processes, there are small alternatives in the volume percentage of adsorbate refrigerant. The volume fraction rises with rising temperature because the deposited refrigerant density decreases at pre-heating operation. After this phase, it touches its maximum cyclic value, which is around 0.39. On the other hand, the rise in its density is what causes the declining trend in the adsorbed phase volume fraction over the isosteric cooling process, which attains its lowest value of around 0.107.
Figure 9(a) shows the total energy provided during the heating process to the adsorption reactor per unit mass of the solid adsorbent as a function of bed temperature. The entire sum of the particular. The estimated energy needed to activate the adsorption bed is 449.89 kJ/kg. A little portion of this energy, approximately 22.22%, is used in the preheating process to get the bed temperature up from ambient to desorption temperature. The complete input energy has been used to heat the bed sensibly in the isosteric heating procedure. In the isobaric heating process, a considerable amount of the total heat input is consumed for refrigerant desorption. Constant pressure desorption, on the other hand, needs the remaining 77.78%, of the total energy supplied. In comparison to the desorption process, the sensible pre-heating process has a greater rate of temperature rise (1→2 is just used for the bed's sensible heating. On the other hand, the operation of producing refrigerant in process (2→3) uses a significant amount of energy. The cycle of the mass desorption of ethanol commencing the adsorptive reactor bed at the isobarically route, (2→3), is shown in Figure 9(b). It has been observed that the rate of produced ethanol achieves its peak when desorption is initialized at the generation bed temperature. As the bed temperature rises, the rate is seen in the figure to be continually dropping. Afterward, the desorption route, when the ethanol reached its minimum concentration value.
Figure 10 shows the total specific energy extracted from the adsorption reactor for the duration of the adsorption process and isosteric cooling. The entire amount of energy measured for the period of this cooling stage is approximately 440.3 kJ /kg of the adsorbent material removed from the bed. In a sensible cooling procedure, 24.14% loses energy to the environment at the unvarying dilution-cooler phase. The adsorption reactor maintains its initial ambient temperature due to this proportion of rejected energy. Following that, a greater energy portion is disallowed to the environment. Moreover, Figure 11 shows the progression of the mass of ethanol-ads as a function of pressure dependent, throughout the (4→1) route.
(a) Total heat added (1→2)
(b) Accumulation of ethanol_des through route (2→3)
Figure 9. Bed generation temperature Tgen
Figure 10. The total specific energy rejected by adsorption
Figure 11. Influence of bed pressure on the effective mass of Ethanol (4→1)
5.1.2 The impact of Tgen on COP and SCP
Figure 12 shows how the generating temperature affects cycle COP. The graph displays how the COP rapidly increases to an optimal value, or optimal temperature (Tgen). Furthermore, when the generation temperatures (Tgen) rise precisely above the optimal temperature value, the system's coefficient of performance (COP) begins to decline. As the desorption temperature (Tgen) rises, the refrigerating effect likewise rises because internal refrigerant mass desorption increases at this temperature. Consequently, the system's coefficient of performance (COP) reached its maximum value before falling below the ideal desorption temperature. Result in more cooling output and more ethanol desorbed. However, this also implies a gain in heat input since it allows the bed to lose heat more sensibly. In addition, as the temperature rises over the optimal range, the cycle COP degrades. This is because the amount of heat absorption has increased more than the amount of cooling produced.
Figure 12. Effect of maximum desorption temperature on (COP) and (SCC) at bed thickness 0.048 m
Figure 13. Adsorbed mass variation during isosteric heating-desorption process for Bed1 and isosteric cooling-adsorption process for Bed2
Figure 13 shows that more adsorbent is utilized when the adsorbent bed thickness rises, and as the adsorbent mass grows, so do the external mass transfer resistances. Therefore, it is anticipated that additional heat will be needed to raise the unit's overall temperature; there is a noticeable increase in resistance across the adsorbent bed. Because of the increased contact resistance, as a result, there is less mass transfer, less adsorption capacity, and longer cycle durations. A thinner adsorbent bed will result in a shorter cycle time and more specific cooling power for design purposes.
5.2 Factors affect the temperature distribution through the current case study bed
From the standpoint of a designer, the bed's thickness is the most logical component to maximize. The solar area of the bed is determined to be 1 m2, with 16 kg of adsorbent cylindrical bed and with the lower bound of density ∼ 2200 kg/m3, corresponding to 4.8 cm of thickness. This meets the daily output of 11.22 kg of chilled water at 5℃, which was anticipated given the high ambient temperatures. Consequently, determining the maximum bed thickness is crucial as it will determine whether to expand the solar area or make the bed thicker.
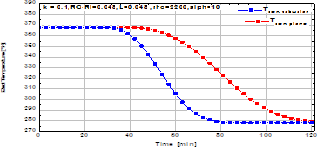
The graph on the left side of Figure 14, features a brief cool-down period and a thickness of only 4.8 cm., with alpha=10, and k=0.2. The graph on the left features a brief cool-down period and a thickness of only 4.8 cm. Except for the center, and the middle locations, every point on the graph on the right has almost cooled down quickly. Whereas, the center takes nearly an hour to cool down. The middle section of the bed cools down in around (35) minutes. It is crucial that heat from the inside of the tabular bed can radiate out to the edge, and average or the surrounding air, taking into consideration the heat of adsorption. Determining a precise thickness limit is therefore challenging since the bed cools down in the night. To possess a certain amount of tolerance, 4.8 cm of bed thickness is allowed; one can use additives to improve thermal conductivity k to reduce cooling time and cycle time [61].
Figure 14. Temperature profile of four points of tabular bed design
5.2.1 Adsorbent bed thickness relation with SCP & COP
The thickness of the AC bed manipulated the cooling power. The temperature of the heat source and inlet cooling water were assumed to be (95 and 33℃), respectively, and these values were used to generate the simulated findings in this section at Tev=5℃. Table 1 displays the same additional working circumstances. An essential factor in system optimization is the radial thickness of the adsorbent bed, which affects the refrigeration cycle's coefficient of performance (COP) and specific cooling power (SCP), as shown for values between (1 and 10) cm in Figure 15. It is evident that as the adsorbent thickness rises, the COP essentially stays constant. A thicker layer of adsorbent would negatively affect the system performance because, while the cycled refrigerant mass will increase due to a larger thickness, the heat energy consumed by the adsorber components (apart from the heat input to the metal tube) will also increase.
Conversely, because of the extraordinary sensitivity of the SCP of the adsorption system to the adsorbent thickness alteration, the adsorption system is compacted and has optimized bed thickness values. SCP is highly sensitive to changes in the adsorbent's thickness. This trend arises from the fact that the heat resistance rises with increased bed thickness or greater adsorbent mass. As a result, there is less heat exchange during the cycle process, which lengthens the time cycle duration. Therefore, a decrease in the SCP. It is clear that values more than 5 cm should not be used. Therefore, the optimum mass of AC is 16 kg with an optimum bed thickness of 4.8 cm.
Validated with reference [48, 62]. Figure 15 illustrates the impact of varying the thickness of the AC bed with cycle cooling time. It falls after reaching a maximum value. The overall mass of the activated carbon was low when there was only a thin layer bed. The cooling power rises with increasing activated carbon content, or thicker bed. However, the greater thickness heightened the resistance to heat. The activated carbon bed took a while to cool down, as Figure 16 illustrates. When compared to activated carbon beds with thicknesses of (4.8-5) cm, the cycle duration of the 10 cm thick bed was almost 4 times longer 4.8 cm, and 10 times longer 0.01 cm.
The system SCP also considered the extra mass for the thicker bed. In Figure 15, the SCP drops off rapidly at thicknesses greater than 4 cm. A maximum value was recorded at 4.8 cm bed thickness. This implies that to reduce the heat resistance, the adsorbent layer cannot be too thick.
Figure 15. Influence bed thickness on COP & SCP
Figure 16. The average temperature profile of different bed thicknesses
5.2.2 Optimum cooling time of SCP and COP
In general, the refrigeration amount increases with a shorter cycle time. On the other hand, if the cycle period is so brief that there is no equilibrium adsorption, then the function of the adsorbent bed cannot be reflected if there is insufficient time for the adsorbent to either adsorb or desorb the adsorbate. It is crucial to choose the cycle time carefully because of this. SCP and COP are typically used as markers to assess how well the absorption refrigeration cycle is working. When SCP and COP reach their maximum values, the cycle time will be at its finest.
Concurrently. However, in the real system, COP does not peak at the same time as SCP does. In a similar vein, SCP does not peak at the same time as COP. To conduct numerical simulations, the cooling period in this study is set to one hour, meaning that the cycle time is two hours and for two beds is 4 hours. COP and SCP calculations are displayed in Figure 17(a). It is evident that while the COP value rises with longer cooling times, the increased margin contracts. When the temperature of the adsorbent falls and approaches the initial adsorption temperature, it proceeds with the cooling process and enters the adsorption phase. Over the path of the adsorption process, the amount of adsorption increases almost exactly linearly. After that, as cooling time grows, the SCP value drops Figure 17(b), in this system, the solar energy generated by the solar collector heats the adsorbent, producing a significant amount of hot water. Therefore, the COP value has no bearing on the system's functionality. The SCP value must be raised. Ultimately, it is found that the system has a 35-minute cycle time.
(a)
(b)
Figure 17. (a) COP with the cycle time, (b) SCP with the cycle time
5.2.3 Adsorbent different bed thickness
With density ρ=2000 kg/m3, k=0.1, alpha=10, Figure 18 displays the effect of adsorbent bed thickness in cooling time and then in COP and SCP. It is clear that for smaller thickness (2.4 cm) Bth concluded good performance with good SCP for daily cold production but cannot achieve the present designed specific cooling power, which is 11.22 W/kg. As bed thickness increased bed thickness 4.8 cm, the cooling cycle increased with increased COP. It is the optimum desired thickness satisfied to accomplish good performance with 11.22 W/kg SCP. After this point, the increased mass of adsorbent COP will be decreased after the optimum value at 4.8 cm. This, in part because of the activated carbon's granular texture and relatively low thermal conductivity, makes it more difficult for heat absorbed at the adsorbent plate to reach the deeper layers of the material.
Figure 18. Bed Temperature profile with t Bth (0.012-0.1) m
The adsorber, which contained AC particles of the same size but varied in thickness, was heated using water kept at a constant temperature of 95℃. Figure 19(a), (b) demonstrates that the thicker bed temperature was lower than that of the thinner bed and that it rose more slowly. The thinner bed performs better in heat transmission than the thicker one, as would be predicted.
(a) time
(b) Bth
Figure 19. Central bed temperature profile
Figure 20 displayed the ethanol adsorbate, with Bth, and with time it is evident that as the bed thickness increased, then the desorption ethanol increasing tends needing for increase the cycle time. Figure 21 clear the relation between SCP and adsorbent bed thickness is clear that SCP decreased as Bth increased due to increasing time. As cooling time increased, SCP decreased.
Figure 20. Ethanol uptake with Bth m
Figure 21. SCP profile for cylindrical bed
5.2.4 Conductivity effective
Activated carbon has extremely low conductivity, measuring about (0.1-0.2) W/m.K. Additives can be added to AC. to improve thermal conductivity; however, this will affect the working fluid's adsorption. In Figure 22, pure activated carbon is employed. The graphs demonstrate how the conductivity has a significant impact on the cooling time. It will take 55 minutes for the bed's core to cool down when using pure activated carbon. For k = 0.2 and k = 0.3, this is shortened to 45 minutes. The improvement in the cooling time was 25 minutes with (k=0.1 to 0.3), 15 minutes with (k=0.1-0.2), and 10 minutes (with k=0.2-0.3). The most location stimuli by the cool-down period are the center point and the middle. There is no change in the edge or average temperature.
Figure 22. Bed temperature profile with k= (0.1-0.3)
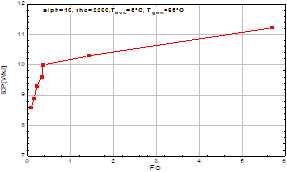
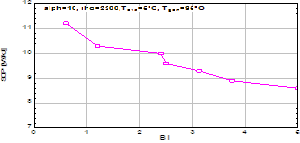
5.2.7 The SCP with Biot (Bi) & Fourier (Fo) numbers
The Biot number, or Bi, is defined as the proportion of the heat transfer fluid's convective resistance to the conductive resistance in the adsorbent bed. It is a crucial design parameter for adsorbent heat generators. The Bi has an extremely complex influence on heat intake and output, the COP, and the non-dimensional specific cooling capacity. When Bi increases,
COP and SCC both drop. Thus, based on the findings for the various Bi values, it can be stated that the thinner the adsorbent bed, the larger the profit. This is a logical conclusion. When the thickness of the adsorbent bed is decreased without adjusting the amount of adsorbent, then the adsorbent bed's conductive resistance rises. An increased conductive resistance value lowers heat and mass transfer performance inside the adsorbent in the adsorbent reactor material, resulting
in less gain and a decreased refrigeration effect. The optimal bed thickness design is when the thickness of the radius of fluid to the adsorbent bed thickness is 0.5. Which is here is 0.048 m, see Figure 23(a).
(a) Biot number
(b) Fo
Figure 23. SCP with Bi and SCP with Fo
The Fourier number of the adsorbent-adsorbate bed is defined as the ratio between heat penetration depth and bed thickness. It should be more than 1 to significantly reduce the effect of the conduction resistance on the bed performance. Analysis of results indicates that the performance of an adsorption AC bed is not controlled by the conduction resistance when the Fourier number of the adsorbent-adsorbate layer is more than 0.2. For some mathematical calculations, at bed thickness 0.048 m, k=0.1, Bi=7.92, Fo=0.177 for alpha=16.5. In addition, it is clear from Figure 23(b), that the cooling time has not changed so the performance and SCP are not affected by the Fourier number because it is less than 0.2. Thus, the performance does not depend on the thermal diffusion process of the adsorption bed when the adsorbent-adsorbate Fourier number exceeds 1.0. It is discovered that SCP rises with the adsorbent-adsorbate layer's Fourier number (Fo), leveling out at a maximum value at Fo≈1, beyond which the bed thermal conductivity value is high sufficient to transfer the heat produced to the cooling fluid.
5.3 Comparison between flat and tabular bed reactor
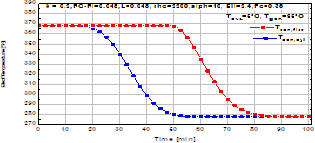
For the adsorbent bed, there are primarily two design options: plates and tubular. The temperature fluctuation over time for four distinct plate sites (edge, average, middle, and central of the bed) is displayed on the left in Figure 24(a) & (b). On the other hand, the figure on the right indicates their location on the bed. The generation temperature was 95℃ and the evaporation temperature was 5℃. The edge of the bed, which is exposed to the outside removal heat, appears by the red line. The center of the bed, or 0.5L, 0.5 (Ro-Ri), is colored by the blue line. The portion that is farthest from the surrounding air is viewed by the black line. There should be no heat leakage since the top cover will insulate this component through cooling. The average temperature throughout the entire bed is pointed by the green line.
(a) k=0.1
(b) K=0.2
Figure 24. Temperature profile of four points
Figure 24(a) shows the edge of the bed will naturally cool off first. In just a few minutes, the exterior portion of the plate cools down quickly. It takes longer the farther into the plate it is. Whereas, the middle point takes it takes 65 and 50 minutes to cool down the plate and cylindrical bed to Teva respectively. It also takes more than 111 & 80 minutes to cool down the central point. A fraction for the initial cooling phase is pointed on the graph to the midpoint and center point. This is because the material will not be immediately affected by a temperature difference; rather, it takes time for the difference to pass through it. The graph for the average temperature is smoother than the others. These outcomes validated that the cylindrical bed design form cools more quickly than heat may be discharged from the flat plate.
Figure 25(a) displays the comparison of the cooling time for the same dimension and characteristics with flat and cylindrical designs with different k=0.1. The cylindrical design has faster cooling and less cycle time, the difference is about (40) min which tends to have better COP and more SCP per cycle Figure 25(b), displays the comparison of the cooling time for the same cylindrical design with k=0.2 beds. The difference is about (20) min, which decreases to half because of improving thermal conductivity.
(a) K=0.1
(b) K=0.2
Figure 25. Cooling time for flat and cylindrical bed
Under the climate conditions of Iraq, an optimization of two-bed solar adsorption cooling unit working with an activated carbon /ethanol pair is conducted. The optimal cycle performances of an adsorption system are assessed and simulated by EES with the desorption temperature range of 60 to 95℃ and the evaporator temperatures of 5℃ for cooling applications. The current investigation is continued research after the research paper by the same author [14] and the outcomes were as follows:
It was found that the variant of the adsorbent bed thickness affects the specific cooling power more than the cycle COP. Instead, it was put in evidence that the increase in the heat source temperature would increase cycle COP, solar COP, and specific cooling power. Within the ranges of heat source temperatures between 80℃ and 95℃, with small radial bed thickness (4.8–5 cm) with an optimum cooling time about one hour. The adsorption and desorption processes are prolonged because of the bed's high thermal resistance, which slows down heat transport.
More adsorbent is utilized as the thickness of the adsorbent bed grows, consequently, more heat is anticipated to be necessary to raise the unit's overall temperature; the thermal there is a noticeable increase in resistance across the adsorbent bed. Shorter cycle times and reduced adsorption capabilities. A similar result has been confirmed by earlier studies on adsorption systems in general.
The temperature change of the AC bed over time is observed to rise quickly at the start of the adsorption process, and then progressively drop until it approaches the bath temperature. This happened because there is a very big amount of ethanol adsorbed at the start of adsorption, which leads to a correspondingly large heat of adsorption.
Reducing the thickness of the adsorbent bed improves heat transmission in the radial direction. A thinner adsorbent bed will result in a shorter cycle time and more specific cooling power for design purposes. Raising the number of beds Thus, thickness negatively affects the bed's ability to transmit heat. There is a trade-off to be aware of: while reducing bed thickness improves heat transport over the adsorbent bed, it also reduces the mass of the adsorbent and, consequently, the adsorption capacity.
The adsorption capacity is improved when the bed thickness is reduced because the heat of the bed thickness squared determines the diffusion time scale. Furthermore, lowering the bed Thickness affects uploading more strongly than raising thermal conductivity. The reason for this is that additionally, less heat is produced during the adsorption process.
Thus, with the same heat transfer and coolant temperature consequently, a thinner bed will cool down considerably quicker than a bigger bed. However, it ought to be said that decreasing the width of the bed is not usually advised because it lowers the mass ratio of lower ethanol adsorption results from an increase in temperature at the top layers of the adsorbent as its thickness rises. Lower than 5 cm adsorbent thicknesses provide superior cooling and increased absorption.
To improve the thermal conductivity of AC nevertheless, the adsorber's thermal mass will also rise with the addition of metal fins. The adsorber's thermal reaction time will lengthen, and the energy needed to increase. SCP and COP could be negatively impacted by this. Consolidating high-thermal conductivity material with AC boosts the bed's thermal conductivity and enables an increase in bed thickness, which is a method of problem-solving.
The COP of the system is positively affected by the increasing value of the adsorbent bed thickness but the same effect on the SCP is not observed. The distributions of solid phase temperature and the adsorbate concentration strongly depend upon adsorbent bed thickness but not pressure. For better specific cooling power, it is necessary to lower the conductive and convective resistances to quickly attain the equilibrium conditions. The effect of Fourier number on SCP produced by different bed thicknesses. It is found that SCP increases as the Fourier number of the adsorbent-adsorbate thickness increases.
I owe my family a great deal for my accomplishment since without their encouragement and upbringing; I could not have finished my paper.
|
C |
specific heat of evaporation kJ.kg-1.k-1 |
|
D |
the constant of dubinin-astakhov |
|
n |
the constant of dubinin-astakhov |
|
k |
adsorbent constant |
|
$mAC$ |
mass of a.c kg |
|
$wall$ |
mass, of the wall kg |
|
H |
the isosteric heating of ads/des kJ/kg |
|
L |
the latent heat kJ |
|
Q |
sensible heat kJ |
|
${{h}_{fu}}$ |
enthalpy fusion state kJ/kg |
|
${{h}_{ad}}$ |
the isosteric heating of ads kJ/kg |
|
${{h}_{fg}}$ |
the enthalpy of the liquid-vapor phase conversion kJ/kg |
|
${{L}_{ice}}$ |
the latent heating of fusion of ice kJ/kg |
|
${{m}_{r}}$ |
the refrigerant mass kg |
|
${{m}_{eth}}$ |
the ethanol mass kg |
|
${{m}_{shell}}$ |
mass of shell kg |
|
${{m}_{tube}}$ |
mass of tubes kg |
|
${{m}_{ice}}$ |
mass of ice kg |
|
${{m}_{cwc}}$ |
mass of cooled water kg |
|
$\dot{m}$ |
mass flow rate kg /s |
|
${{P}_{con}}$ |
condenser pressure $\mathrm{k} P a$ |
|
${{P}_{gen}}$ |
generator pressure $\mathrm{k} P a$ |
|
${{P}_{Sat}}$ |
saturation vapor pressure $\mathrm{k} P a$ |
|
${{P}_{eva}}$ |
evaporator pressure $\mathrm{k} P a$ |
|
P |
pressure $\mathrm{k} P a$ |
|
${{Q}_{eva}}$ |
the sensible heat of the evaporator kj |
|
${{Q}_{leak}}$ |
heat leakage from the surroundings kj |
|
R |
gas constant kj.kg-1.k-1 |
|
${{t}_{cycle}}$ |
cycle time min |
|
T |
temperature ${ }^{\circ} \mathrm{C}$ |
|
${{T}_{eva}}$ |
the evaporated temperature of ethanol in the evaporator ${ }^{\circ} \mathrm{C}$ |
|
${{T}_{gen}}$ |
the generation temperature of the bed ${ }^{\circ} \mathrm{C}$ |
|
${{T}_{con}}$ |
condenser temperature ${ }^{\circ} \mathrm{C}$ |
|
${{T}_{sat}}$ |
saturation temperature ${ }^{\circ} \mathrm{C}$ |
|
${{T}_{ambiant}}$ |
ambient temperature ${ }^{\circ} \mathrm{C}$ |
|
${{T}_{ad}}$ |
the temperature of adsorption ${ }^{\circ} \mathrm{C}$ |
|
${{T}_{sd}}$ |
the starting temperature of desorption ${ }^{\circ} \mathrm{C}$ |
|
${{T}_{sa}}$ |
the starting temperature of adsorption ${ }^{\circ} \mathrm{C}$ |
|
${{T}_{wi}}$ |
the initial temperature of the water ${ }^{\circ} \mathrm{C}$ |
|
$U$ |
internal energy kj |
|
${{X}_{0}}$ |
the maximum adsorption uptake kg/kg |
|
$X$ |
the equilibrium ethanol uptake ratio kg/kg |
|
Imax |
the maximum solar radiation w/m2 |
|
Greek symbols |
|
|
$\theta$ |
dimensionless temperature |
|
$\Delta$ |
change /difference |
[1] Alhialy, N.F. (2023). Sizing the nuclear reactor by critical mass calculation for a spherical reactor case study. International Journal of Heat & Technology, 41(6): 1645-1654. https://doi.org/10.18280/ijht.410628
[2] Farman, N.F., Mahdi, S.A., Redha, Z.A.A. (2018). A review of advances in pressurizer response research for pressurized water reactor systems. International Journal of Simulation--Systems, Science & Technology, 19(2): 3. https://doi.org/10.5013/IJSSST.a.19.02.03
[3] Mahdi, S.A., Farman, N.F., Redha, Z.A.A. (2018). Genetic algorithms to estimate the pressure deviations in dynamic transients of the pressurizer response in PWRs. International Journal of Simulation--Systems, Science & Technology, 19(1): 3. https://doi.org/10.5013/IJSSST.a.19.01.03
[4] Farman, N.F., Mahdi, S.A., Abdul Redha, Z.A. (2017). Mathematical analysis of the transient dynamic of surge-in or/and surge-out of the pressurizer of PWR. International Journal of Simulation--Systems, Science & Technology, 18(4): 5. https://doi.org/10.5013/IJSSST.a.18.04.05
[5] Abass, A.Z., Pavlyuchenko, D.A. (2019). Turning Iraq into a country of energy exporter through the exploitation of solar energy and vast desert land. E3S Web of Conferences, 114: 05009. https://doi.org/10.1051/e3sconf/201911405009
[6] Ahmed, B.M., ALhialy, N.F. (2019). Optimum efficiency of PV panel using genetic algorithms to touch proximate zero energy house (NZEH). Civil Engineering Journal, 5(8): 1832-1840.https://doi.org/10.28991/cej-2019-03091375
[7] Ahmed, B.M., Alhialy, N.F.F. (2020). Experimental and theoretical analysis of a mono PV cell with five parameters, simulation model compatible with Iraqi climate. Association of Arab Universities Journal of Engineering Sciences, 27(1): 54-64. https://doi.org/10.33261/jaaru.2019.27.1.007
[8] Saadoon, T.N., Farman, N.F., Mustafa, F.I. (2020). Thermal efficiency optimization of the evacuated tube solar water heater system by using mirror flat reflector. In 2020 11th International Renewable Energy Congress (IREC), Hammamet, Tunisia, pp. 1-5. https://doi.org/10.1109/irec48820.2020.9310380
[9] Alsaman, A.S., Maher, H., Ghazy, M., Ali, E.S., Askalany, A.A., Saha, B.B. (2024). 2D materials for adsorption desalination applications: A state of the art. Thermal Science and Engineering Progress, 49: 102455. https://doi.org/10.1016/j.tsep.2024.102455
[10] Ghazy, M., Ibrahim, E.M.M., Mohamed, A.S.A., Askalany, A. A. (2022). Experimental investigation of hybrid photovoltaic solar thermal collector (PV/T)-adsorption desalination system in hot weather conditions. Energy, 254: 124370. Https://doi.org/10.1016/j.energy.2022.124370
[11] Ali, E.S., Farid, A.M., Askalany, A.A., Ghazy, M., Zohir, A. E., Alsaman, A.S. (2023). Cost analysis and performance investigation of solar-powered desalination system utilizing modified sodium polyacrylate adsorbent material. Energy Conversion and Management: X, 20: 100421. https://doi.org/10.1016/j.ecmx.2023.100421
[12] Ghazy, M., Askalany, A.A., Ibrahim, E.M.M., Mohamed, A.S.A., Ali, E.S., Raya, A.D. (2022). Solar powered adsorption desalination system employing CPO-27 (Ni). Journal of Energy Storage, 53: 105174. https://doi.org/10.1016/j.est.2022.105174
[13] Ali, E.S., Mohammed, R.H., Zohir, A.E., Farid, A.M., Elshaer, R.N., El-Ghetany, H.H., Askalany, A.A. (2022). Novel ultrasonic dynamic vapor sorption apparatus for adsorption drying, cooling and desalination applications. Energy Reports, 8: 8798-8804. https://doi.org/10.1016/j.egyr.2022.06.026
[14] Mohammed, M.S., Alhialy, N.F.F. (2024). Solar adsorption cooling system operating by activated–carbon–ethanol bed. International Journal of Renewable Energy Development, 13(3): 430-447. https://doi.org/10.61435/ijred.2024.60170
[15] Brancato, V., Frazzica, A., Sapienza, A., Gordeeva, L., Freni, A. (2015). Ethanol adsorption onto carbonaceous and composite adsorbents for adsorptive cooling system. Energy, 84: 177-185. https://doi.org/10.1016/j.energy.2015.02.077
[16] Henninger, M., Engelpracht, M., Tuchlinski, D., Ismail, M., Bardow, A., Seiler, J. (2024). Water, ethanol, or methanol for adsorption chillers? Model-based performance prediction from Infrared–Large-Temperature-Jump experiments. Applied Thermal Engineering, 236: 121816. https://doi.org/10.1016/j.applthermaleng.2023.121816
[17] Krishnappa, A.K., Kapilan, N., Kasthurirengan, S., Ashwathnarayana, D.P. (2023). Experimental and simulation study of a solar assisted two bed adsorption refrigeration system using activated carbon-methanol. International Journal of Heat and Technology, 41(2): 293-303. https://doi.org/10.18280/ijht.410202
[18] Al-Maamory, N.H., Farman, N.F. (2023). Performance of solar adsorption cooling system using methanol and activated carbon as a working pair. Journal of Engineering, 29(7): 71-85. https://doi.org/10.31026/j.eng.2023.07.05
[19] Abdel-Dayem, A.M., Baharith, M.A. (2022). Numerical simulation and optimization of a solar adsorption icemaker. International Journal of Heat & Technology, 40(4): 1033-1043. https://doi.org/10.18280/ijht.400421
[20] Farman, N.F., Redha, Z.A.A., Mahdi, S.A. (2017). Optimization the efficiency of continuous solar adsorption refrigeration system with genetic algorithm. In 2017 2nd International Conference on the Applications of Information Technology in Developing Renewable Energy Processes & Systems (IT-DREPS), Amman, Jordan, pp. 1-8. https://doi.org/10.1109/IT-DREPS.2017.8277821
[21] Adenane, G., Mohammed, B., Mea, G. (2021). Effect of operating temperatures and working pairs on performance of solar adsorption cooling system. International Journal of Heat & Technology, 39(4): 1280-1286. https://doi.org/10.18280/ijht.390426.
[22] Haj Jrad, A.B., Zagnani, A., Mhimid, A., El Ganaoui, M. (2019). Feasibility study of cold production using activated carbon/CO2 pair. International Journal of Heat & Technology, 37(2). 625-632. https://doi.org/10.18280/ijht.370234
[23] Pal, A., Rocky, K.A., Saha, B.B. (2021). Thermodynamic analysis of promising biomass-derived activated carbons/CO2 based adsorption cooling systems. Journal of CO2 Utilization, 46: 101457. https://doi.org/10.1016/j.jcou.2021.101457
[24] Gautam, Sah, R.P., Sahoo, S. (2023). A review on adsorption isotherms and kinetics of CO2 and various adsorbent pairs suitable for carbon capture and green refrigeration applications. Sādhanā, 48(1): 27. https://doi.org/10.1007/s12046-023-02080-9
[25] Pan, Q.W., Wang, R.Z., Wang, L.W., Liu, D. (2016). Design and experimental study of a silica gel-water adsorption chiller with modular adsorbers. International Journal of Refrigeration, 67: 336-344. https://doi.org/10.1016/j.ijrefrig.2016.03.001
[26] Agarwal, A., Thakur, A.D., Raj, R. (2024). Demonstration of long-term cyclic sorption of ammonia in modified expanded graphite-calcium chloride composites for practical applications. International Communications in Heat and Mass Transfer, 150: 107206. https://doi.org/10.1016/j.icheatmasstransfer.2023.107206
[27] Mohammed, R.H., Qasem, N.A., Farid, A.M., Zubair, S.M., Alsaman, A.S., Askalany, A.A., Ali, E.S. (2023). A novel solar-powered thermal desalination unit coupled with a reverse osmosis plant to increase overall water recovery. Applied Thermal Engineering, 234: 121306. https://doi.org/10.1016/j.applthermaleng.2023.121306
[28] Verde, M., Harby, K., De Boer, R., Corberán, J. M. (2016). Performance evaluation of a waste-heat driven adsorption system for automotive air-conditioning: Part II-Performance optimization under different real driving conditions. Energy, 115: 996-1009. https://doi.org/10.1016/j.energy.2016.09.086
[29] Hassan, M., El-Sharkawy, I.I., Harby, K. (2023). Study of an innovative combined absorption-adsorption cooling system employing the same evaporator and condenser. Case Studies in Thermal Engineering, 42: 102690. https://doi.org/10.1016/j.csite.2022.102690
[30] Mohammed, R.H., Mesalhy, O., Elsayed, M.L., Chow, L.C. (2018). Scaling analysis of heat and mass transfer processes in an adsorption-packed bed. International Journal of Thermal Sciences, 133: 82-89. https://doi.org/10.1016/j.ijthermalsci.2018.07.017
[31] Elsheniti, M.B., Al-Ansary, H., Orfi, J., El-Leathy, A. (2024). Performance evaluation and cycle time optimization of vapor-compression/adsorption cascade refrigeration systems. Sustainability, 16(9): 3669. https://doi.org/10.3390/su16093669
[32] Khanam, M., Jribi, S., Miyazaki, T., Saha, B.B., Koyama, S. (2018). Numerical investigation of small-scale adsorption cooling system performance employing activated carbon-ethanol pair. Energies, 11(6): 1499. https://doi.org/10.3390/en11061499
[33] El-Sharkawy, I.I., Hassan, M., Abd-Elhady, M.M., Radwan, A., Inayat, A. (2023). Solar-powered adsorption-based multi-generation system working under the climate conditions of GCC countries: Theoretical investigation. Sustainability, 15(22): 15851. https://doi.org/10.3390/ su152215851
[34] Hakemzadeh, M.H., Sopian, K., Kazem, H.A., Al-Waeli, A.H., Chaichan, M.T. (2024). Evaluating the techno-economic viability of different solar collectors integrated into an adsorption cooling system in tropical climate conditions. Solar Energy, 268: 112304. https://doi.org/10.1016/j.solener.2023.112304
[35] Bozorgi, M., Tasnim, S.H., Mahmud, S. (2024). Enhancing indoor thermal comfort and sustainability: A solar-driven desiccant cooling and adsorption chiller system with environmental impact assessment. Solar Energy, 271: 112440. https://doi.org/10.1016/j.solener.2024.112440
[36] Wang, Z., Yuan, Z., Liu, Z., Liu, Y., Bernat, M. (2023). Dynamic variation of bed parameters and time optimisation of solar adsorption refrigeration system based on CFD simulation. Applied Thermal Engineering, 235: 121405. https://doi.org/10.1016/j.applthermaleng.2023.121405
[37] Grabowska, K., Krzywanski, J., Zylka, A., et al. (2024). Implementation of fluidized bed concept to improve heat transfer in ecological adsorption cooling and desalination systems. Energies, 17(2): 379. https://doi.org/10.3390/en17020379
[38] Chauhan, P.R., Baiju, V., Sha, A.A., Tyagi, S.K. (2024). Adsorption of ethanol onto novel and indigenous green adsorbents: Synthesis, characterization, and applications. Journal of Cleaner Production, 442: 140978. https://doi.org/10.1016/j.jclepro.2024.140978
[39] Chauhan, P.R., Yagnamurthy, S., Tyagi, S.K. (2024). Potential assessment of biomass-based single-stage adsorption systems for refrigeration, cooling, and heat-pumping applications. International Journal of Green Energy, Latest Articles. https://doi.org/10.1080/15435075.2024.2302048
[40] Gado, M.G., Ookawara, S., Nada, S., Elkady, M.F., Hassan, H. (2024). Adsorbent beds packed in triply periodic minimal surface-derived structures and their performance in adsorption desalination/cooling systems. International Communications in Heat and Mass Transfer, 150: 107205. https://doi.org/10.1016/j.icheatmasstransfer.2023.107205
[41] Wang, J., Chen, K., Zeng, M., Ma, T., Wang, Q., Cheng, Z. (2023). Investigation on flow and heat transfer in various channels based on triply periodic minimal surfaces (TPMS). Energy Conversion and Management, 283: 116955. https://doi.org/10.1016/j.enconman.2023.116955
[42] Agarwal, A., Thakur, A.D., Raj, R. (2024). Demonstration of long-term cyclic sorption of ammonia in modified expanded graphite-calcium chloride composites for practical applications. International Communications in Heat and Mass Transfer, 150: 107206. https://doi.org/10.1016/j.icheatmasstransfer.2023.107206
[43] Mohammed, R.H., Ali, E.S., Askalany, A. (2024). Limits of coefficient of performance of adsorption cooling cycle based on refrigerant’s type. Thermal Science and Engineering Progress, 51: 102629. https://doi.org/10.1016/j.tsep.2024.102629
[44] Mohammed, R.H., Ali, E.S., Askalany, A. (2024). Limits of coefficient of performance of adsorption cooling cycle based on refrigerant’s type. Thermal Science and Engineering Progress, 51: 102629. https://doi.org/10.1016/j.tsep.2023.102243
[45] Yaïci, W., Entchev, E. (2019). Coupled unsteady computational fluid dynamics with heat and mass transfer analysis of a solar/heat-powered adsorption cooling system for use in buildings. International Journal of Heat and Mass Transfer, 144: 118648. https://doi.org/10.1016/j.ijheatmasstransfer.2019.118648
[46] Liang, J., Zhao, W., Wang, Y., Ji, X., Li, M. (2023). Effect of cooling temperature on the performance of a solar adsorption chiller with the enhanced mass transfer. Applied Thermal Engineering, 219: 119611. https://doi.org/10.1016/j.applthermaleng.2022.119611
[47] Jribi, S., Miyazaki, T., Saha, B.B., Koyama, S., Maeda, S., Maruyama, T. (2017). CFD simulation and experimental validation of ethanol adsorption onto activated carbon packed heat exchanger. International Journal of Refrigeration, 74: 345-353. https://doi.org/10.1016/j.ijrefrig.2016.10.019
[48] Mohammed, R.H., Mesalhy, O., Elsayed, M.L., Chow, L.C. (2018). Scaling analysis of heat and mass transfer processes in an adsorption packed bed. International Journal of Thermal Sciences, 133: 82-89. https://doi.org/10.1016/j.ijthermalsci.2018.07.017
[49] Elsheniti, M.B., Eissa, M.S., Al-Ansary, H., Orfi, J., El-Leathy, A., Elsamni, O. (2022). Using a combination of activated carbon and graphene nanoparticles in a consolidated form for adsorption ice maker: A system-level modeling. Applied Sciences, 12(15): 7602. https://doi.org/10.3390/app12157602
[50] El Fadar, A., Mimet, A., Pérez-García, M. (2009). Modelling and performance study of a continuous adsorption refrigeration system driven by parabolic trough solar collector. Solar Energy, 83(6): 850-861. https://doi.org/10.1016/j.solener.2008.12.003
[51] Palomba, V., Dawoud, B., Sapienza, A., Vasta, S., Frazzica, A. (2017). On the impact of different management strategies on the performance of a two-bed activated carbon/ethanol refrigerator: An experimental study. Energy conversion and management, 142: 322-333. https://doi.org/10.1016/j.enconman.2017.03.055
[52] Girnik, I.S., Grekova, A.D., Gordeeva, L.G., Aristov, Y.I. (2017). Dynamic optimization of adsorptive chillers: Compact layer vs. bed of loose grains. Applied Thermal Engineering, 125: 823-829. https://doi.org/10.1016/j.applthermaleng.2017.06.141
[53] Lienhard V, J.H., Lienhard IV, J.H. (2024). A Heat Transfer Textbook, Version 6. Phlogiston Press Cambridge, Massachusetts, U.S.A.
[54] Alam, K.C.A., Kang, Y.T., Saha, B.B., Akisawa, A., Kashiwagi, T. (2003). A novel approach to determine optimum switching frequency of a conventional adsorption chiller. Energy, 28(10): 1021-1037. https://doi.org/10.1016/s0360-5442(03)00064-1
[55] Scherle, M., Nieken, U. (2020). Simultaneous optimization of process operational and material parameters for a 2-bed adsorption refrigeration process. ChemEngineering, 4(2): 31. https://doi.org/10.3390/chemengineering4020031
[56] Kundu, B. (2020). Thermal analysis on variable thickness absorber plate fin in flat-plate solar collectors using differential transform method. Journal of Thermal Engineering, 6(1): 157-169. Https://doi.org/10.18186/Thermal.672169
[57] Bahrehmand, H., Khajehpour, M., Bahrami, M. (2018). Finding optimal conductive additive content to enhance the performance of coated sorption beds: An experimental study. Applied Thermal Engineering, 143: 308-315. https://doi.org/10.1016/j.applthermaleng.2018.07.115
[58] Alamoudi, H.A., Abdel-Dayem, A.M. (2021). Design optimization and simulation of an ice plant working by solar adsorption technology. European Journal of Energy Research, 1(4): 13-22. https://doi.org/10.24018/ejenergy.2021.1.4.22
[59] Ammar, M. H., Benhaoua, B., Bouras, F. (2017). Thermodynamic analysis and performance of an adsorption refrigeration system driven by solar collector. Applied Thermal Engineering, 112: 1289-1296. https://doi.org/10.1016/j.applthermaleng.2016.09.119
[60] Ruthven, D.M. (1984). Principles of Adsorption and Adsorption Processes. John Wiley & Sons.
[61] Bahrehmand, H., Khajehpour, M., Bahrami, M. (2018). Finding optimal conductive additive content to enhance the performance of coated sorption beds: An experimental study. Applied Thermal Engineering, 143: 308-315. https://doi.org/10.1016/j.applthermaleng.2018.07.115 Brites, G., Costa, J., & Costa, V. (2016). Influence of the design parameters on the overall performance of a solar adsorption refrigerator. Renewable Energy, 86: 238-250. https://doi.org/10.1016/j.renene.2015.07.099.
[62] Ruthven, D.M. (1984). Principles of Adsorption and Adsorption Processes. John Wiley & Sons.