Na Yuan*![]() | Zhuang Ma
| Zhuang Ma![]() | Cheng Gong
| Cheng Gong![]() | Xihuan Hou
| Xihuan Hou![]() | Zhanlin Ji
| Zhanlin Ji![]()
© 2024 The authors. This article is published by IIETA and is licensed under the CC BY 4.0 license (http://creativecommons.org/licenses/by/4.0/).
OPEN ACCESS
In modern industrial production, high-temperature environments are commonplace, posing significant challenges to equipment stability, safety, and production efficiency. Machine vision, as an effective automated inspection technology, has attracted extensive attention in high-temperature settings. However, the unique conditions of high temperatures, such as significant thermal noise and optical interference, demand enhanced performance from machine vision systems. The second law of thermodynamics provides a theoretical foundation for understanding these challenges, emphasizing the increase of entropy in energy transformation and transfer processes, and guides the design and optimization of machine vision systems in high-temperature environments. This paper aims to comprehensively explore the application of machine vision based on the second law of thermodynamics in high-temperature industrial inspection, focusing on two core issues: the impact of thermodynamic parameters on the performance of machine vision systems and the technology for analyzing high-temperature industrial infrared images using multi-scale entropy. By thoroughly analyzing how thermodynamic parameters influence the design and implementation of machine vision systems, and by developing infrared image processing algorithms adapted to high temperatures, this study seeks to enhance the efficiency and accuracy of machine vision technology in high-temperature industrial applications, providing theoretical support and technical guidance for the advancement of intelligent manufacturing.
machine vision, high-temperature industrial inspection, second law of thermodynamics, entropy, multi-scale entropy, infrared image analysis
In modern industrial production processes, high-temperature environments are prevalent, and they impose high demands on the stability, safety, and production efficiency of equipment and materials [1, 2]. Machine vision, as an efficient automated inspection technology, is increasingly being emphasized in high-temperature industrial inspections [3-5]. However, the uniqueness of high-temperature environments, such as significant thermal noise and optical interference, poses challenges to the design and implementation of machine vision systems [6]. The second law of thermodynamics, which describes the increase in entropy during energy transformation and transfer, provides a theoretical foundation for understanding and addressing these issues.
The significance of studying machine vision in high-temperature industrial inspections lies not only in improving production efficiency and ensuring equipment safety but also in driving the transformation from traditional industries to intelligent manufacturing [7, 8]. By thoroughly researching the impact of thermodynamic parameters on the performance of machine vision systems, and by developing image processing algorithms adapted to high temperatures, machine vision technology can significantly improve its application effectiveness in high-temperature environments, thus playing an important role in enhancing product quality, reducing energy consumption, and lowering labor costs [9-11].
Although machine vision technology has been widely applied in many fields, research on its application in high-temperature environments is relatively scarce, and existing studies mostly focus on specific application scenarios or single technological improvements [12-15]. These studies often neglect the comprehensive impact of high-temperature environments on the overall performance of machine vision systems, particularly in terms of systematic research on thermodynamic parameters [16-19]. Furthermore, image processing algorithms for high temperatures, especially those for thermal image analysis, still face issues of low accuracy and poor robustness.
This paper aims to comprehensively analyze and research the application of machine vision based on the second law of thermodynamics in high-temperature industrial inspections. The main research content includes two parts: the first part is the thermodynamic parameters affecting the application of machine vision in high-temperature industrial inspections, aiming to reveal how these parameters affect the performance of machine vision systems, providing theoretical guidance and technical support for system design; the second part of this research is a high-temperature industrial infrared image analysis based on multi-scale entropy, by studying the principles and implementation processes of multi-scale entropy algorithms aimed at high-temperature industrial infrared image analysis, and by analyzing core parameters, this paper aims to improve the accuracy and robustness of infrared image processing. The value of this research lies in not only expanding the application domain of machine vision in high-temperature industrial inspections but also providing new theories and methods for image processing technology in high-temperature environments, with the potential to significantly enhance the safety and efficiency of industrial production.
In exploring the current application of machine vision in high-temperature industrial inspection and the challenges it faces, the impact of thermodynamic parameters is particularly important. These parameters not only determine the design and operating efficiency of the machine vision system but also directly relate to the system's stability, reliability, and the accuracy of its final output. Below is a detailed analysis of how these parameters specifically affect the application of machine vision in high-temperature industrial inspection:
(1) An increase in temperature directly raises the noise level of imaging sensors, leading to reduced image quality. This is because sensors operating at high temperatures experience increased internal noise, especially thermal noise, which is a serious issue for industrial applications requiring high-precision detection. Additionally, high temperatures may exacerbate the increase in system entropy, further affecting the efficiency of data transmission and processing, and thus decreasing the accuracy of image analysis.
(2) Thermal radiation in high-temperature environments can cause imaging sensors to capture overexposed or distorted images. This occurs because materials or objects at high temperatures emit radiation, and if the machine vision system is not properly designed to resist this radiation, these additional light sources can interfere with image acquisition, leading to misjudgments or detection failures.
(3) Thermal conductivity is crucial for the heat dissipation design of machine vision systems. High-temperature environments require systems to have efficient thermal management capabilities to ensure that electronic components do not degrade in performance or get damaged due to overheating. Materials with high thermal conductivity can transfer heat away more quickly, helping to maintain the system's operating temperature within a safe range.
(4) Specific heat capacity affects the system's response to temperature changes. Materials and components with high specific heat capacities can absorb more heat without significantly increasing in temperature, which is beneficial for maintaining system stability in long-duration high-temperature working environments.
(5) The coefficient of thermal expansion is an important factor in high-temperature environments. Material expansion may cause mechanical structures to deform, such as affecting the alignment between the lens and the sensor, thereby reducing image quality. This requires consideration of the material's expansion coefficient in design, ensuring that the machine vision system remains highly precise even with temperature changes.
(6) Environmental entropy change reflects the disorder in the energy transformation and transfer processes when the system operates in high-temperature environments. High environmental entropy change means that the system needs to consume more energy to maintain operational stability and efficiency, which may lead to lower energy utilization and increased operating costs.
Each of these parameters affects the change in system entropy in different ways, thereby impacting the performance and efficiency of the machine vision system. Firstly, an increase in temperature directly increases the internal disorder, or entropy, which not only affects the performance of imaging sensors and electronic components, causing a decrease in data processing and transmission efficiency, but may also exacerbate image noise and quality degradation. Secondly, thermal radiation increases the entropy in the environment, interfering with the image acquisition process, leading to overexposed or distorted images. Thermal conductivity and specific heat capacity concern how the system manages and disperses the heat it absorbs, affecting the system’s temperature stability and entropy change, and thereby impacting the long-term operational stability and reliability of the machine vision system. The coefficient of thermal expansion affects the physical stability of materials, indirectly affecting the increase in system entropy, as minor structural changes may lead to significant drops in system efficiency. Lastly, environmental entropy change directly reflects the disorder in the energy exchange between the system and its environment; a high environmental entropy change requires the system to consume more energy to maintain efficiency and stability. In summary, these thermodynamic parameters, by influencing the entropy change in the system and environment, collectively determine the effectiveness and efficiency of machine vision systems in high-temperature industrial inspections, emphasizing the need to comprehensively consider the impact of these parameters on entropy change in the design and optimization of machine vision systems to achieve efficient, stable system performance.
3.1 Implementation process of multi-scale entropy method
In high-temperature environments, traditional machine vision systems face challenges such as increased thermal noise and reduced image quality, issues fundamentally related to an increase in system entropy. This paper focuses on the current state of machine vision in high-temperature industrial inspection and delves into entropy-related studies on high-temperature industrial infrared image analysis, particularly those based on the second law of thermodynamics. Using thermodynamic entropy analysis methods, especially in infrared image processing, this research can not only more accurately identify and analyze image data under high-temperature conditions but also optimize the design and operation of machine vision systems to adapt to extreme temperature conditions.
In the context of high-temperature industrial inspection, infrared image data generated by environmental factors (such as thermal radiation, temperature fluctuations) and changes in the state of target objects are not only complex and variable but also contain rich information. Because infrared image data in high-temperature industrial environments are highly complex and variable, traditional entropy methods at a single scale are inadequate for accurate capture and analysis. Therefore, this paper adopts a multi-scale entropy approach for analyzing high-temperature industrial infrared images rather than traditional entropy or information entropy. The multi-scale entropy algorithm, based on its unique theoretical foundation, can analyze data complexity over different time scales, providing a more in-depth and comprehensive analytical means. This method can effectively identify and analyze the subtle differences between periodic and random signals, more accurately reflecting the regularity and complexity of infrared images at different scales.
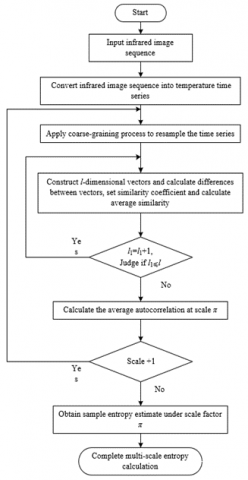
The multi-scale entropy algorithm for high-temperature industrial infrared image analysis inherits the traditional multi-scale entropy framework used to quantify the complexity of time series but requires adaptive adjustments for the special needs of infrared images in high-temperature environments. In the context of high-temperature industrial inspection, infrared images reflect not only the thermal radiation characteristics of the target objects but are also influenced by temperature fluctuations, thermal interference, and other factors, making the image data highly complex and variable. To effectively quantify this complexity, the multi-scale entropy algorithm for high-temperature industrial infrared image analysis particularly emphasizes the adjustment and optimization of three key parameters: the embedding dimension, which defines the length of the infrared image data window considered in the analysis to capture local patterns of temperature changes; the scale factor, adjusted to match the multi-time scale characteristics of temperature distribution in infrared images, effectively reflecting thermal state changes from micro to macro levels; and the similarity coefficient, finely tuned to adapt to the special noise and interference in infrared images under high-temperature conditions, ensuring the algorithm can accurately identify changes in complexity in the images. Through specific adjustments of these parameters, the multi-scale entropy algorithm not only quantifies the irregularity of high-temperature industrial infrared images but also meets the special requirements for infrared image analysis in high-temperature industrial environments. Figure 1 provides a flowchart of the multi-scale entropy algorithm for high-temperature industrial infrared image analysis.
In high-temperature industrial applications, the image sequences captured by infrared cameras contain not only the thermal radiation information of the target objects but also the dynamic characteristics of the object surface temperatures over time. By converting these infrared images into a temperature time series a(1), a(2)..., a(M), where M is the total length of the series, we simplify complex image information into a numerical representation of temperature changes. This quantification of thermal information from infrared images allows the analysis originally intended for images to be transformed into an analysis for time series, thus applying various methods of time series analysis to explore the regularities and complexities of temperature changes. The new series obtained after the coarse-graining transformation of a(1), a(2)..., a(M) is given by:
$b_k^{(\pi)}=\frac{1}{\pi} \sum_{u=(k-1) \pi+1}^{k \pi} a(u)$ (1)
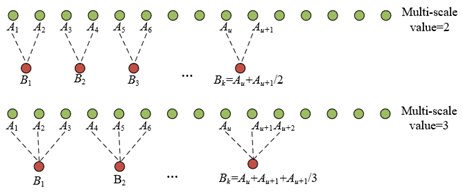
The coarse-graining process, or coarse-graining transformation, involves resampling the original temperature time series using a scale factor π, creating a new time series. Figure 2 provides a schematic of the coarse-graining process. Specifically, this process involves sampling every π points in the original series to construct a new series. The core purpose of this step is to observe the dynamic changes of the series at different time scales, thereby the new series length V is expressed as V=M/π. This process is crucial for revealing the behavioral patterns of temperature time series at different observation scales, especially in high-temperature industrial monitoring, as it helps us identify the characteristics of temperature changes at different time scales, providing an effective means to capture and understand complex temperature dynamics. The new series processed by coarse-graining is then used to form l-dimensional vectors from consecutive l values of the series. The formation of an l-dimensional vector is given by:
$B^{(\pi)}(u)=\left[b^{(\pi)}(u), B^{(\pi)}(u+1), \cdots, B^{(\pi)}(u+l-1)\right], u=1 \sim V-l+1$ (2)
Figure 1. Multi-scale entropy algorithm flowchart for high-temperature industrial infrared image analysis
Then, by calculating the difference between any two l-dimensional vectors in the series, i.e., calculating the maximum absolute value of their differences, we can quantify the complexity of the series at a specific scale. This step is the core of the multi-scale entropy calculation process as it involves quantifying the internal structure of the series. In high-temperature industrial infrared image analysis, this method helps us understand the differences between temperature change patterns, thereby revealing the heterogeneity in thermal behavior of different components or areas. The definition of the maximum absolute value is given by:
$\begin{aligned} & f\left[B^{(\pi)}(u), B^{(\pi)}(k)\right]=M A X\left|y^{(\pi)}(u+j)-y^{(\pi)}(u-j)\right| \\ & j=0 \sim l-1, u, k=1 \sim V-l+1, u \neq k\end{aligned}$ (3)
By setting an effective similarity coefficient e, we define a standard for the similarity between vectors, and for each u<V-l+1, we count the number of vector pairs that meet the similarity condition, i.e., those pairs whose maximum absolute value of vector difference is less than e. Next, we calculate the proportion of vector pairs that meet the similarity condition among all pairs, obtaining the average similarity of the series at the given scale and embedding dimension. This step, based on the setting of the similarity coefficient e, allows us to quantify the regularity and randomness of the temperature time series at a specific scale. This method is particularly useful in analyzing infrared images in high-temperature environments, as it can reveal the intrinsic regularities of temperature changes, providing a reliable analytical tool for subsequent fault diagnosis and process control. The ratio of the maximum absolute value of vector differences to the total number of distances can be calculated through the following formula:
$\begin{aligned} & Z_u^{\pi, l}(e)=\frac{1}{V-l}\left\{\text { The number of }\left[f\left[B^{(\pi)}(u), B^{(\pi)}(k)\right]<e\right]\right\} \\ & u, k=1 \sim V-l+1, u \neq k\end{aligned}$ (4)
After calculating the similarity, the next step is to use the data obtained to calculate the average autocorrelation of the series at a specific scale. This calculation reflects the degree of similarity between the time series and its time-delayed replicas at a given scale. For high-temperature industrial infrared image analysis, this means quantifying the regularity of temperature changes at specific time scales, allowing for a deeper understanding of the system's thermal stability and potential anomalous thermal behaviors. The formula for calculating the average autocorrelation of vectors at scale π is given by:
$Z_u^{\pi, l}(e)=(V-l+1)^{-1} \sum_{n=1}^{V-l+1} Z_u^{\pi, l}(e)$ (5)
Further, the embedding dimension l is increased to l+1, and the previous calculation process is repeated. In the analysis of high-temperature industrial infrared images, repeating the calculation by increasing the dimension reveals the complex dynamic behaviors of temperature changes at higher dimensions. This step allows analysts to understand the complexity of temperature sequences from a higher dimension, providing a more refined analytical tool for identifying and predicting abnormal states in high-temperature environments. The sample entropy expression for a time series at scale π is given by:
$SARv\left( l,e \right)=\underset{V\to 0}{\mathop{LIM}}\,-LN\left[ {{{Z}^{\pi ,l+1}}\left( u \right)}/{{{Z}^{\pi ,l}}\left( u \right)}\; \right]$ (6)
In practical applications, since the length of the series is finite, an estimate of the sample entropy for a series of length V can be obtained under a given scale factor. This estimate provides a quantifiable measure to assess the complexity of the series at a given time scale. For high-temperature industrial infrared image analysis, the estimated value of sample entropy can reflect the unpredictability and randomness of temperature changes, providing an effective quantitative means to evaluate thermal phenomena in infrared images. The expression for the estimated value of sample entropy is given by:
$SARv\left( \pi ,l,e \right)=-LN\left[ {{{Z}^{\pi ,l+1}}\left( r \right)}/{{{Z}^{\pi ,l}}\left( e \right)}\; \right]$ (7)
Through the detailed steps above, we ultimately complete the calculation process of the multi-scale entropy algorithm, specifically computed as follows:
$MSE=\left\{ \left. \pi \right|SARv\left( \pi ,l,e \right) \right\}=-LN\left[ {{{Z}^{\pi ,l+1}}\left( e \right)}/{{{Z}^{\pi ,l}}\left( e \right)}\; \right]$ (8)
This process, by repeatedly calculating sample entropy at different scales and dimensions, provides a powerful tool for a deep understanding of the complexity of high-temperature industrial infrared image time series. The advantage of this method is that it not only quantifies the complexity of temperature time series at a single scale but also reveals changes in complexity at different time scales, providing a new perspective for infrared image analysis in high-temperature environments.
Figure 2. Schematic of the coarse-graining process
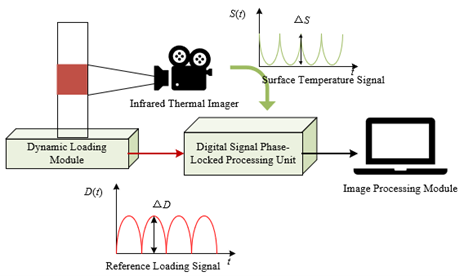
Figure 3. Schematic of the high-temperature industrial infrared image detection system
Figure 3 provides a schematic of the high-temperature industrial infrared image detection system used in this paper. In further analyzing infrared images in high-temperature industrial environments, it is first necessary to eliminate images with unreasonable features caused by external factors, such as overexposure or obvious noise interference, to reduce interference with subsequent analyses. For the selected reasonable images, the median filter algorithm is applied to reduce image noise, further enhancing image quality. Subsequently, the image's grayscale histogram is extracted and enhanced through a weighted histogram algorithm to obtain richer pixel information, enabling more accurate image content analysis. Finally, the multi-scale entropy algorithm is used to perform entropy curve analysis on the image pixel series, observing changes in the entropy curve to assess the status of industrial equipment or identify specific phenomena in high-temperature environments. Unlike other scenarios of infrared image analysis, high-temperature industrial infrared image analysis places greater emphasis on the temperature distribution and temperature change characteristics within the image, thus adjustments specific to image preprocessing, enhancement, and entropy analysis methods are also required. For example, when classifying samples between normal and abnormal operating states in high-temperature industrial applications, it may be necessary to set different entropy baselines and deviation thresholds based on equipment characteristics and operating environments to ensure the accuracy and practicality of the analysis results.
3.2 Analysis of parameter selection for multi-scale entropy method
(1) Selection of the Embedding Dimension l
The embedding dimension l essentially represents the window length of the time series considered during analysis, directly affecting the precision and quality of temperature information extracted from infrared images. In high-temperature industrial inspection applications, selecting an appropriate l value can more effectively capture the thermal distribution on the surface of the equipment and the temperature changes over time, aiding in a deeper understanding of the equipment's operational conditions.
In high-temperature industrial environments, the temperature distribution on the surface of equipment is usually very complex, potentially containing thermal patterns from different heat sources. Moreover, images in high-temperature environments are often subject to interference from various environmental and equipment-related factors, which may produce misleading effects in higher-dimensional data analysis. Therefore, to capture more joint probability information, making the analysis of time series more comprehensive and in-depth, while reducing the impact of these potential interfering factors when maintaining analysis depth, this paper chooses to set m to 2. Considering the handling of large volumes of industrial infrared image data, an excessively high embedding dimension would lead to a significant increase in computational load, which is impractical for real-time or near-real-time industrial monitoring systems. Hence, from a practicality and computational efficiency standpoint, m=2 is a reasonable and effective choice.
(2) Selection of the Similarity Coefficient e
The similarity coefficient e directly impacts whether the multi-scale entropy algorithm can accurately reflect the complexity of temperature distribution in infrared images under high-temperature industrial environments. It defines the standard of similarity between two vectors in the time series, with the magnitude of its value determining the sensitivity of recognizing similar patterns during the analysis process, thereby affecting the final entropy calculation and interpretation.
Infrared images in high-temperature industrial environments usually contain temperature variations caused by material properties, heating methods, and environmental factors. These variations appear as different grayscale values in the images, representing different temperature areas. Selecting an appropriate r value can effectively distinguish these temperature variations, thus accurately reflecting the complexity of the temperature distribution. Moreover, in practical applications, monitoring systems need to be able to promptly and accurately identify changes in equipment status or potential faults, requiring the multi-scale entropy algorithm to not only accurately reflect the complexity of the temperature distribution but also possess good robustness and adaptability. However, too large or too small an e value could adversely affect the analysis results. If e is set too high, different temperature distribution patterns may be incorrectly identified as similar, artificially reducing the entropy value and thus masking potential complexity in temperature distribution; conversely, if e is set too low, even very similar temperature patterns may be viewed as different, resulting in an excessively high entropy value that reflects an overstated complexity, which may not correspond with the actual situation. Therefore, this paper chooses r between 0.1 and 0.25 SD, where the multi-scale entropy algorithm achieves a good balance between sensitivity and distinction in temperature changes in infrared images.
(3) Selection of the Scale Factor π
The scale factor π defines the interval for data resampling in time series analysis, directly relating to the ability of the multi-scale entropy algorithm to capture features of temperature changes at different time scales. For high-temperature industrial applications, setting π not only ensures useful temperature information is extracted from infrared images but also reflects the thermal dynamics in equipment status and industrial processes.
In practice, too fine a time scale may lead to an excessive amount of data, increasing computational complexity and hindering quick diagnostics and response; whereas too coarse a time scale might overlook important temperature change information, reducing the sensitivity and accuracy of the analysis. In high-temperature environments, the thermal behavior of equipment and materials has certain spatiotemporal characteristics, which are manifested in infrared images in various forms of temperature distribution. To effectively convert this spatiotemporal characteristic into analyzable time series data, capturing the essential features of temperature changes at an appropriate time scale, this paper selects τ=8 as the scale factor. Choosing τ=8 balances the detail and efficiency of the analysis, suitable for fast-paced, high-load high-temperature industrial environments. This selection also considers the characteristics of multi-scale entropy analysis, which reveals the multi-layered features of system dynamics complexity by analyzing entropy values at different scales. At τ=8, the entropy curve tends to stabilize, indicating that key temperature change information has been captured at this scale, and further increasing the scale would not significantly enhance information retrieval.
Table 1 shows the comparison of average entropy values for normal and abnormal samples when analyzing high-temperature industrial products using infrared images at different scales. From the data, it can be observed that as the scale increases, the average entropy values for normal samples gradually increase from Scale 1 to Scale 3 and then gradually decrease, indicating that the entropy value for normal samples peaks at a medium scale. This reflects a higher complexity in the temperature distribution of normal samples within this scale range, possibly due to significant thermal dynamic changes under normal operating conditions. Conversely, for abnormal samples, the average entropy values at all scales are generally lower than those of normal samples and show a downward trend as the scale increases. Notably, at Scale 8, the average entropy value for abnormal sample three shows an anomalous fluctuation (0.075), which could be due to a data entry error or a unique temperature distribution pattern of abnormal sample three at this scale. Moreover, the entropy values for abnormal samples one and two follow a trend similar to that of normal samples at different scales, but the overall entropy values are lower, indicating that even under abnormal conditions, the equipment's temperature distribution maintains a certain level of complexity, but it is significantly lower than under normal conditions.
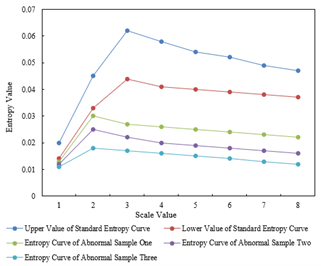
Figure 4. Standard entropy curve and summary curve for abnormal samples of industrial product images
Figure 4 displays the standard entropy curve values for industrial product images and the entropy curve values for three abnormal samples at different scales. As seen from the data in the table, with the increase in scale value, the standard entropy curve, i.e., the entropy values of industrial product images under normal conditions, shows a trend of increasing first and decreasing later, reflecting higher complexity in the temperature distribution at medium scales, particularly at Scale 3 and Scale 4. This may be related to the thermodynamic characteristics of industrial equipment under normal operating conditions. In contrast, the entropy curves for the three abnormal samples are consistently lower than the standard curve at all scales, and their entropy values continue to decline with increasing scale, especially for abnormal sample three where the decrease is most significant. This suggests that the complexity of temperature distribution for industrial products under abnormal conditions is significantly lower than under normal conditions, likely due to uneven thermal distribution or anomalies in heat sources caused by faults or abnormal operating conditions.
Table 2 details a comparison of results in industrial product anomaly detection using traditional morphological methods versus the algorithm proposed in this paper, including maximum horizontal length, maximum vertical length, defect area, and their error ratios relative to actual size, as well as pose error rates. The data from the table shows that compared to traditional morphological methods, the proposed algorithm demonstrates significantly better accuracy across various product series. Particularly in key metrics such as area size error and pose error rates, the errors of the proposed algorithm are significantly lower than those of traditional methods. For instance, in product series 2, the area size error of the traditional morphological method reaches as high as 689.2%, while the proposed algorithm maintains it at just 3.2%; in terms of pose error rates, the traditional method records 336.8%, whereas the proposed algorithm controls it at 11.24%. This indicates that the proposed algorithm possesses higher accuracy and robustness in precisely identifying and measuring anomalies in industrial products. The comparative analysis demonstrates that the multi-scale entropy-based high-temperature industrial infrared image analysis algorithm significantly enhances the accuracy of anomaly detection, effectively reducing error rates, thereby proving its effectiveness and practical value in high-temperature industrial inspection applications. The improvement in accuracy not only stems from the algorithm's deep utilization of the characteristics of infrared images under high-temperature industrial environments but also reflects the important role of the second law of thermodynamics in guiding the design and optimization of machine vision systems.
Table 1. Average entropy values of normal and abnormal samples of industrial product images at different scales
|
Sample |
Upper Limit of Average Entropy for Normal Samples |
Lower Limit of Average Entropy for Normal Samples |
Average Entropy of Abnormal Sample One |
Average Entropy of Abnormal Sample Two |
Average Entropy of Abnormal Sample Three |
|
Scale 1 |
0.0184 |
0.0125 |
0.0123 |
0.0124 |
0.0114 |
|
Scale 2 |
0.0447 |
0.0315 |
0.0317 |
0.0245 |
0.0189 |
|
Scale 3 |
0.0625 |
0.0458 |
0.0278 |
0.0214 |
0.0187 |
|
Scale 4 |
0.0587 |
0.0421 |
0.0256 |
0.0218 |
0.0156 |
|
Scale 5 |
0.0528 |
0.0412 |
0.0235 |
0.0189 |
0.0116 |
|
Scale 6 |
0.0512 |
0.0378 |
0.0226 |
0.0158 |
0.0115 |
|
Scale 7 |
0.0478 |
0.0356 |
0.0226 |
0.0145 |
0.0082 |
|
Scale 8 |
0.0476 |
0.0345 |
0.0224 |
0.0124 |
0.075 |
Table 2. Comparison of anomaly detection results for industrial products
|
Detection Object |
Maximum Horizontal Length /mm |
Maximum Vertical Length /mm |
Defect Area /mm2 |
Area Size Error |
Pose Error Rate |
|
|
Product Series 1 |
Actual Size |
15.2 |
14 |
232.2 |
/ |
/ |
|
Traditional Morphology |
22.36 |
17.58 |
268.54 |
18.9% |
31.5% |
|
|
The Proposed Algorithm |
16.58 |
15.23 |
223.47 |
2.2% |
4.5% |
|
|
Product Series 2 |
Actual Size |
21.58 |
22.5 |
172.2 |
/ |
/ |
|
Traditional Morphology |
36.98 |
55.69 |
1325.36 |
689.2% |
336.8% |
|
|
The Proposed Algorithm |
22.31 |
22.54 |
165.85 |
3.2% |
11.24% |
|
|
Product Series 3 |
Actual Size |
6.4 |
6 |
38 |
/ |
/ |
|
Traditional Morphology |
11.2 |
12.23 |
53.14 |
323.2% |
342.1% |
|
|
The Proposed Algorithm |
6.78 |
6.58 |
37.89 |
1.8% |
7.7% |
|
|
Product Series 4 |
Actual Size |
18 |
3 |
52 |
/ |
/ |
|
Traditional Morphology |
23.56 |
12.25 |
223.56 |
335.2% |
278.5% |
|
|
The Proposed Algorithm |
13.25 |
6.78 |
65.98 |
31.2% |
27.8% |
|
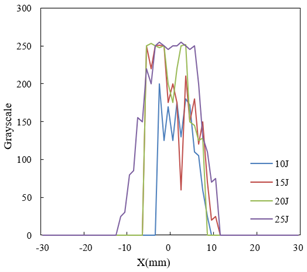
Figure 5 displays the grayscale changes of industrial products in the X direction subjected to different impact energies (10J, 15J, 20J, 25J) after thermal reconstruction treatment. From the data, it can be observed that as the impact energy increases, the range of grayscale distribution in the images gradually expands, and the peak grayscale values also progressively increase. For example, at 10J impact energy, the higher grayscale areas are concentrated within a smaller range, and the maximum grayscale value is relatively low; at 25J, not only do the high grayscale areas expand to a wider range in the X direction, but the maximum grayscale value also significantly increases, indicating that the increase in impact energy leads to more pronounced differences in temperature distribution and higher concentration of heat.
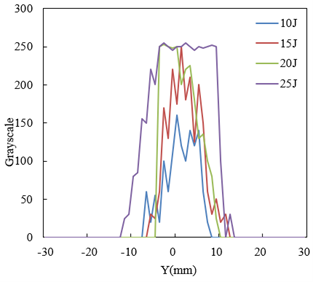
Figure 6 records the grayscale distribution of industrial product images in the Y direction after multi-scale thermal reconstruction treatment under different impact energies (10J, 15J, 20J, 25J). From the table data, it is evident that with the increase in impact energy, the changes in grayscale distribution in the Y direction exhibit broader and more intense characteristics. At lower impact energies (such as 10J), high grayscale areas are more concentrated and the intensity is relatively lower; at higher impact energies (such as 25J), not only do the high grayscale areas in the Y direction expand more broadly, but the intensity of the grayscale values also significantly increases. This trend indicates that as the impact energy increases, the temperature distribution of the industrially heated products becomes more complex and uneven, which is manifested on the grayscale images as wider high-value areas and higher peak grayscale values.
This phenomenon reflects the effectiveness of the multi-scale entropy-based high-temperature industrial infrared image analysis method in revealing the thermal response characteristics of industrial products under different impact energies. As the impact energy increases, the thermal distribution on the product surface becomes more complex and uneven, and this change is accurately quantified and characterized through multi-scale entropy analysis. This not only demonstrates the efficiency of the multi-scale entropy algorithm in capturing and analyzing the thermal characteristics of industrial products under high temperatures but also showcases the algorithm's important role in enhancing the precision and robustness of infrared image processing within machine vision systems based on the second law of thermodynamics.
Figure 5. Grayscale variation of industrial product images in the X direction after thermal reconstruction based on multiple scales
Figure 6. Grayscale variation of industrial product images in the y direction after thermal reconstruction based on multiple scales
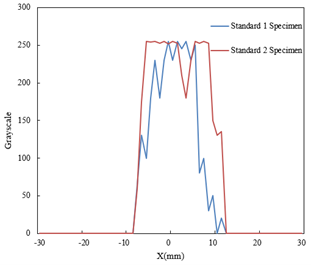
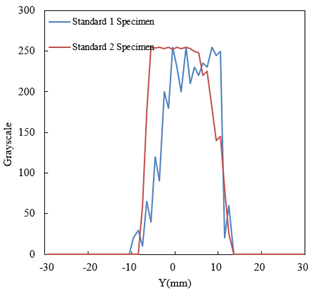
Comparing Figure 7's display of grayscale distribution in the X and Y directions for Standard 1 and Standard 2 industrial product specimens, we can clearly see significant differences in the damage detection results under the same impact energy. In the X direction, the Standard 2 specimen shows higher peak values and a broader distribution range, especially in the central area where the grayscale value reaches the maximum of 255, indicating more severe damage. Similarly, in the Y direction, the Standard 2 specimen also displays more significant grayscale value distribution, particularly from the center to the positive 20 interval, where the grayscale value consistently remains at the high value of 255, reflecting a greater range and depth of damage. In contrast, although the Standard 1 specimen also shows damage characteristics, both the range of grayscale distribution and the peak values are lower than those of the Standard 2 specimen, indicating less severe damage.
(1) X direction
(2) Y direction
Figure 7. Comparison of damage detection for standard 1 and standard 2 industrial product specimens under impact energy
Through an in-depth analysis of these differences, this paper demonstrated the efficiency and accuracy of the multi-scale entropy-based high-temperature industrial infrared image analysis method in damage detection. This method can accurately differentiate degrees of damage and detail the scope and extent of damage through differences in grayscale distribution. This not only confirmed the applicability of the multi-scale entropy algorithm in high-temperature industrial environments but also illustrates the powerful capability of thermodynamics-based machine vision technology in complex damage detection scenarios.
This paper provides important theoretical guidance and technical support for the design and application of machine vision systems in high-temperature environments by comprehensively analyzing the application of thermodynamics-based machine vision in high-temperature industrial inspection. The research is divided into two main parts: one focuses on the thermodynamic parameters affecting the performance of machine vision systems, revealing the specific impacts of these parameters; the other focuses on a multi-scale entropy-based high-temperature industrial infrared image analysis method, aiming to enhance the accuracy and robustness of infrared image processing through the selection and analysis of core parameters.
Experimental results validated the effectiveness and reliability of the research method from multiple perspectives. By analyzing the average entropy values of normal and abnormal samples at different scales, the study successfully revealed the relationship between temperature distribution complexity and the state of industrial products. Furthermore, the analysis of standard entropy curves and abnormal sample summary curves for industrial product images emphasized the applicability of the multi-scale entropy analysis method in identifying and assessing abnormal states of industrial products. Additionally, a comparative analysis of the performance differences between traditional methods and the algorithm proposed in this paper demonstrated the precision and robustness advantages of this algorithm. The analysis of grayscale changes in the X and Y directions of industrial product images after multi-scale thermal reconstruction, along with the damage detection analysis of different standard specimens under impact energy, further verified the practicality and effectiveness of the method in real applications.
Overall, this paper not only confirmed the application value of thermodynamics-based machine vision technology in high-temperature industrial detection but also showcased the important role of the multi-scale entropy algorithm in enhancing the accuracy and robustness of infrared image analysis. However, this research has its limitations, such as the effectiveness of the algorithm in extreme high-temperature environments and its universality in different industrial settings, which require further exploration. Future research directions could include further optimization of the multi-scale entropy algorithm to enhance its applicability and accuracy in a broader range of industrial applications; exploring the potential integration with other machine learning technologies to further improve the accuracy of damage detection and prediction; and expanding to more thermodynamics-based machine vision applications, exploring new applications and challenges in high-temperature environments. Through these ongoing research efforts, the future of machine vision technology in high-temperature industrial detection is promising, expected to play a greater role in ensuring industrial production safety and improving production efficiency.
This work was funded by the Science and Technology Project of the Hebei Education Department (Grant No.: BJK2023064) and the Science and Technology Plan Project of Tangshan.
[1] Dumont, M., Wang, R., Wenzke, D., Blok, K., Heijungs, R. (2023). The techno-economic integrability of high-temperature heat pumps for decarbonizing process heat in the food and beverages industry. Resources, Conservation and Recycling, 188: 106605. https://doi.org/10.1016/j.resconrec.2022.106605
[2] Pivdiablyk, I., Di Goh, Z., Chye, L.K., Shandro, R., Lefebvre, F. (2023). Residual creep life assessment of high-temperature components in power industry. Sensors, 23(4): 2163. https://doi.org/10.3390/s23042163
[3] Wang, Q., Mei, J., Jiang, W., Zhu, H. (2023). SHDM-NET: Heat map detail guidance with image matting for industrial weld semantic segmentation network. Engineering Applications of Artificial Intelligence, 126: 106946. https://doi.org/10.1016/j.engappai.2023.106946
[4] Liu, J., Zeng, Z. (2023). Infrared heat map defect target detection based on Yolov5. In Eighth Asia Pacific Conference on Optics Manufacture and Third International Forum of Young Scientists on Advanced Optical Manufacturing (APCOM and YSAOM 2023), 12976: 45-50. https://doi.org/10.1117/12.3000700
[5] Giordano, L., Benedetti, M. (2021). A methodology for the identification and characterization of low-temperature waste heat sources and sinks in industrial processes: Application in the Italian dairy sector. Energies, 15(1): 155. https://doi.org/10.3390/en15010155
[6] Baibolov, A., Sydykov, S., Alibek, N., Tokmoldayev, A., Turdybek, B., Jurado, F., Kassym, R. (2022). Map of zoning of the territory of Kazakhstan by the average temperature of the heating period in order to select a heat pump system of heat supply: A case study. Energy Sources, Part A: Recovery, Utilization, and Environmental Effects, 44(3): 7303-7315. https://doi.org/10.1080/15567036.2022.2108168
[7] Albert, M.D., Bennett, K.O., Adams, C.A., Gluyas, J.G. (2022). Waste heat mapping: A UK study. Renewable and Sustainable Energy Reviews, 160: 112230. https://doi.org/10.1016/j.rser.2022.112230
[8] Zakari, M.D., Hashim, M., Hassan, N. (2023). Mapping and detection of hotspot sources from Industrial Area Heat (IAH) Using Aerial and Satellite-Based TIR Data in Pasir Gudang. The International Archives of the Photogrammetry, Remote Sensing and Spatial Information Sciences, 48: 415-422.
[9] Ansari, M.M.A., Sahu, K.B., Chaudhuri, S., Srikanth, J., Sahu, D., Mishra, V.K. (2023). Hybrid genetic algorithm-self organizing map network for decision support system: An application in combined mode conduction-radiation heat transfer in porous medium. Numerical Heat Transfer, Part B: Fundamentals, 84(5): 642-664. https://doi.org/10.1080/10407790.2023.2216873
[10] Hayashi, Y., Aizawa, H., Nakatsuka, S., Kato, K. (2023). Frequency perturbation analysis for anomaly detection using Fourier heat map. In Sixteenth International Conference on Quality Control by Artificial Vision, 12749: 73-79. https://doi.org/10.1117/12.2690078
[11] Mursalin, K., Sofan, P., Astuti, I.S. (2024). Comparative analysis of urban heat island phenomenon in residential and industrial areas of Jakarta and Surabaya. In Eighth Geoinformation Science Symposium 2023: Geoinformation Science for Sustainable Planet, 12977: 212-222. https://doi.org/10.1117/12.3009674
[12] Sarna, M., Sure, V., Lüder, A., Weist, J. (2022). Formed workpieces in industrial bin picking. In 2022 IEEE 27th International Conference on Emerging Technologies and Factory Automation (ETFA), Stuttgart, Germany, pp. 1-4. https://doi.org/10.1109/ETFA52439.2022.9921563
[13] Sonoda, A., Takayama, Y., Sugawara, A., Nishi, H. (2022). Greenhouse heat map generation with deep neural network using limited number of temperature sensors. In IECON 2022–48th Annual Conference of the IEEE Industrial Electronics Society, Brussels, Belgium, pp. 1-6. https://doi.org/10.1109/IECON49645.2022.9968606
[14] Pakere, I., Gravelsins, A., Lauka, D., Blumberga, D. (2021). Will there be the waste heat and boiler house competition in Latvia? Assessment of industrial waste heat. Smart Energy, 3: 100023. https://doi.org/10.1016/j.segy.2021.100023
[15] Tiba, C., Azevedo, V.W.B., Paes, M.D.A., de Souza, L. F. (2022). Mapping the potential for a combined generation of electricity and industrial process heat in the northeast of Brazil-Case study: Bahia. Renewable Energy, 199: 672-686. https://doi.org/10.1016/j.renene.2022.09.024
[16] Kumar, L., Hasanuzzaman, M., Rahim, N.A., Islam, M.M. (2021). Modeling, simulation and outdoor experimental performance analysis of a solar-assisted process heating system for industrial process heat. Renewable Energy, 164: 656-673. https://doi.org/10.1016/j.renene.2020.09.062
[17] Srikamta, N., Namee, K., Chatngoen, K., Polpinij, J., Albadrani, G.M. (2021). Evaluation of the Reliability of Heat Map Planner Software to Assist in Indoor Positioning. In 2021 19th International Conference on ICT and Knowledge Engineering (ICT&KE), Bangkok, Thailand, pp. 1-4. https://doi.org/10.1109/ICTKE52386.2021.9665700
[18] Zhang, P., Yuan, C.C., Sun, Q.Q., Liu, A.X., You, S.C., Li, X.W., Zhang, Y.P., Jiao, X., Sun, D.F., Sun, M.Q., Liu, M., Lun, F. (2019). Satellite-based detection and characterization of industrial heat sources in China. Environmental Science & Technology, 53(18): 11031-11042. https://doi.org/10.1021/acs.est.9b02643
[19] Resmi, E., Sreejith, K.P., Kottantharayil, A. (2023). Analysis of variation in recombination characteristics due to light and heat in industrial silicon solar cells. Solar Energy, 252: 127-133. https://doi.org/10.1016/j.solener.2023.01.053