Ming Bao![]() | Dezhi Zou*
| Dezhi Zou*![]()
© 2024 The authors. This article is published by IIETA and is licensed under the CC BY 4.0 license (http://creativecommons.org/licenses/by/4.0/).
OPEN ACCESS
The urban heat island (UHI) effect refers to the phenomenon where central urban areas exhibit higher temperatures than surrounding suburban areas due to concentrated human activities and building structures. This effect significantly impacts urban environments, the quality of life of residents, and energy demands. With the continuous advancement of urbanization, the UHI effect is becoming increasingly severe, making it a focal point in the fields of urban planning and architectural design. However, existing studies often rely on macro-climatic data and lack a thorough analysis of the thermodynamic properties at the urban micro-scale, failing to fully reveal the mechanism behind the impact of architectural layout on the UHI effect. This study begins with a thermodynamic perspective, exploring the changes in thermal stability of the boundary layer in different urban areas under the UHI effect through the heat flux equation. It analyzes the impact of different architectural layouts on the urban thermal environment. The research demonstrates that urban heating disturbances and the average state induced by the UHI effect have distinct regional characteristics in terms of boundary layer thermal stability. Furthermore, by utilizing spatial autocorrelation analysis and the principle of hot and cold spot identification, this paper deeply investigates the spatial autocorrelation and its evolution in urban architectural layouts, assessing the potential of architectural layouts in mitigating the UHI effect. These findings provide new perspectives and tools for urban planning, contributing to the optimization of the urban thermal environment, enhanced energy efficiency, and improved resident comfort.
urban heat island (UHI) effect, architectural layout, thermodynamics, boundary layer stability, spatial autocorrelation analysis, heat flux equation
As the process of urbanization accelerates, the phenomenon of the UHI effect has become increasingly prominent, exerting profound impacts on urban climate, residents' comfort, and energy consumption [1, 2]. The UHI effect refers to the significant increase in temperature in urban center areas compared to suburban areas, caused by heat emitted from human activities and dense urban buildings [3-6]. In urban planning, the impact of architectural layout on the UHI effect is particularly crucial as it determines the distribution and flow of urban heat. Therefore, studying the correlation between architectural layout and the UHI effect from a thermodynamic perspective holds important theoretical and practical significance for mitigating the UHI effect and guiding urban planning [7, 8].
However, existing research methods have certain flaws and deficiencies. Traditional studies often focus on the statistical analysis of macro-climatic data, overlooking the dynamic changes in thermodynamic parameters at the urban micro-scale [9-15]. Moreover, the lack of in-depth discussion on the response mechanism of the UHI effect under different architectural layout scenarios makes it difficult for research findings to be directly applied in urban planning practices [16-22]. Thus, it is necessary to adopt new analytical methods to more accurately simulate and assess the impact of architectural layout on the UHI effect.
This paper aims to delve into the thermodynamic characteristics of the UHI effect in urban planning and its impact on architectural layout through two main contents. Firstly, based on the heat flux equation, this paper analyzes the characteristics of changes in the thermal stability of the urban boundary layer, revealing how the UHI effect alters the thermodynamic equilibrium state of various urban areas. Secondly, utilizing the principle of spatial autocorrelation analysis, this paper investigates the spatial autocorrelation and evolution characteristics of architectural layout, assessing its response and regulation potential for the UHI effect. This research not only adds a thermodynamic perspective to the study of the UHI effect in the field of urban planning but also provides new theoretical foundations and design tools for optimizing the thermal environment in future urban planning.
With the acceleration of urbanization, the UHI effect is increasingly becoming an obstacle to urban sustainable development. Understanding and mitigating this effect is of great significance for improving the quality of urban life. Based on thermodynamic principles and using the heat flux equation as an analytical tool, this paper examines how urban heating disturbances and the average state of the UHI effect impact the thermal stability of urban boundary layers. Thermal stability is an indicator of atmospheric layer stability, whose changes can reflect the response and heat transmission capacity of different areas. By analyzing the changes in boundary layer stability caused by urban heating and the UHI effect, sensitive areas affected by architectural layout can be identified, and the potential efficacy of different architectural layouts in mitigating the UHI effect can be assessed. This method allows researchers to understand and predict the specific impact of architectural layout on the urban thermal environment from a micro-scale, thereby guiding decision-making in urban planning.
2.1 Construction of the atmospheric heat flux equation
The heat flux equation for turbulent atmospheres can depict the vertical and horizontal transport of heat under the influence of turbulence in complex urban surface conditions. The heat flux equation must be accurate enough to include the diversity of urban topography and the dynamic changes in meteorological conditions. The equation considers factors such as the layout, height, volume, and surface materials of buildings, and how these factors affect the absorption, storage, and emission of heat. Assuming that the vertical turbulence coefficient is represented by j, the expression for the heat flux equation in a turbulent atmosphere is given as follows:
$\frac{\partial \varphi}{\partial s}+i \frac{\partial \varphi}{\partial a}+q \frac{\partial \varphi}{\partial c}=j \frac{\partial^2 \varphi}{\partial c^2}$ (1)
Further, the perturbation method is adopted to decompose the complex turbulent airflow into more manageable basic airflow and perturbed airflow. This paper focuses on local factors such as urban architectural layout, which may cause significant changes in local airflow. The basic airflow represents the average state of flow, while the perturbed airflow represents deviations from this average state, often related to local heat sources or geometrical irregularities. In this step, perturbations are introduced into the heat flux equation, allowing the equation to describe the actual, inhomogeneous, nonlinear UHI effect, thus more accurately simulating and understanding the airflow and heat exchange in the urban thermal environment. Assuming the basic airflow is represented by (i-,q-) and the perturbed airflow by (i',q'), and letting 'ϕ=ϕ-+ϕ', the following can be obtained by substituting into the above equation:
$\begin{gathered}\frac{\partial \bar{\varphi}}{\partial s}+\bar{i} \frac{\partial \bar{\varphi}}{\partial a}+\bar{q} \frac{\partial \bar{\varphi}}{\partial c}+\frac{\partial \varphi^{\prime}}{\partial s}+\bar{i} \frac{\partial \varphi^{\prime}}{\partial a}+i^{\prime} \frac{\partial \bar{\varphi}}{\partial a} +\bar{q} \frac{\partial \varphi^{\prime}}{\partial a}+q^{\prime} \frac{\partial \bar{\varphi}}{\partial a}+i^{\prime} \frac{\partial \varphi^{\prime}}{\partial a}+q^{\prime} \frac{\partial \varphi^{\prime}}{\partial a}=j \frac{\partial^2 \bar{\varphi}}{\partial c^2}+j \frac{\partial^2 \varphi^{\prime}}{\partial c^2}\end{gathered}$ (2)
To linearize the heat flux equation for ease of analytical and numerical solutions, this paper further decomposes the equation based on basic quantities, perturbation quantities, and the interaction between basic quantities and perturbation quantities, deepening the mathematical description of the UHI effect. This decomposition not only helps understand how heat is distributed under static conditions but also reveals how heat distribution changes when the urban environment is disturbed by factors such as building construction or natural climate changes. Especially, the interaction terms between basic quantities and perturbation quantities represent the nonlinear characteristics of the UHI effect, which are crucial for predicting and controlling the urban thermal environment. The decomposition results in:
$\frac{\partial \bar{\varphi}}{\partial s}+\bar{i} \frac{\partial \bar{\varphi}}{\partial a}+\bar{q} \frac{\partial \bar{\varphi}}{\partial c}=k \frac{\partial^2 \bar{\varphi}}{\partial c^2}$ (3)
$\begin{gathered}i^{\prime} \frac{\partial \varphi^{\prime}}{\partial a}+q^{\prime} \frac{\partial \varphi^{\prime}}{\partial c}=j \frac{\partial^2 \varphi^{\prime}}{\partial c^2}\end{gathered}$ (4)
$\begin{gathered}\frac{\partial \varphi^{\prime}}{\partial s}+\bar{i} \frac{\partial \varphi^{\prime}}{\partial a}+i^{\prime} \frac{\partial \bar{\varphi}}{\partial a}+\bar{q} \frac{\partial \varphi^{\prime}}{\partial c}+q^{\prime} \frac{\partial \bar{\varphi}}{\partial c}\end{gathered}$ (5)
2.2 Analysis of thermal stability in urban boundary layers
By applying the assumption of horizontal invariance and uniform distribution of perturbed wind fields in the turbulent atmospheric heat flux equation involving interactions between basic and perturbation quantities, the three-dimensional problem is transformed into a more manageable one-dimensional or two-dimensional problem. This means that wind-driven turbulence effects are consistent across different urban areas. Then, using mathematical and numerical solutions, the heat flux equation is solved to obtain a quantitative description of stability within the boundary layers of various urban areas. Specifically, let ∂ϕ′/∂c=b, assuming ∂ϕ′/∂a, i′ are not functions of height, and let the thermal perturbation stability of urban boundary layers be represented by ∂ϕ′/∂c. The effect of horizontal perturbation airflow and perturbation temperature gradient on ∂ϕ′/∂c is represented by Nc/ji′∂ϕ′/∂a. The effect of vertical perturbation airflow on stability is represented by enc/jq′. Thus, after solving the heat flux equation, the following can be obtained:
$\frac{\partial \varphi^{\prime}}{\partial s}=\frac{N c}{j} i^{\prime} \frac{\partial \varphi^{\prime}}{\partial s}+e^{\frac{N c}{j} q^{\prime}}$ (6)
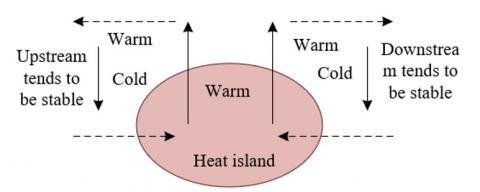
Figure 1. Schematic diagram of thermal disturbance stability characteristics in urban boundary layers
In summary, from the perspective of urban planning in UHI effect research, the thermodynamic disturbances caused by urban heating and the resulting temperature difference between urban and rural areas have a differentiated impact on the stability of boundary layers in different urban areas. Specifically, heating in urban areas typically leads to an increase in temperature in the upper boundary layer, thereby weakening the intensity of vertical airflows. This makes the atmospheric layer structure in urban central areas more stable compared to suburban areas, although the overall stability in city centers is still weaker than in suburbs. However, this change in stability is not absolute. The enhancement of vertical disturbances, especially in areas with significant UHI effects, may lead to local updrafts, which are likely to further weaken the layer stability in central areas, or even exacerbate weather instability in the short term. Figure 1 presents a schematic diagram of thermal disturbance stability characteristics in urban boundary layers.
Specific analysis of architectural layout cases in practice can consider factors such as building height, density, layout, and green space configuration on the impact of the UHI effect. For example, in designed urban renewal projects, adjusting the height and density of buildings to optimize airflow channels can reduce heat accumulation in urban central areas, thereby lowering disturbance temperatures and enhancing atmospheric stability in that area. Additionally, by increasing urban green spaces, especially in city centers and downwind areas, the surface evaporation and plant transpiration can be enhanced, helping to lower surface temperatures and promote vertical heat dispersion, further stabilizing the boundary layer. By simulating and analyzing the impact of different architectural layouts on the thermal stability of urban boundary layers, the potential effects of architectural layout adjustments on mitigating the intensity of heat islands, and influencing precipitation distribution and duration can be predicted.
2.3 Impact analysis of disturbance fields and urban environment interaction
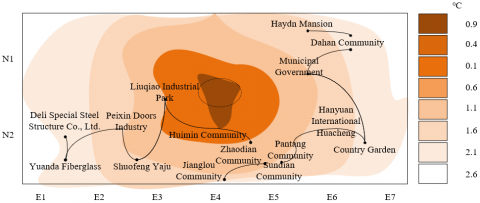
This section focuses on applying the heat conduction equation to urban environments to quantitatively measure the impact of the UHI effect on urban climate. By collecting and analyzing meteorological data, such as temperature, humidity, wind speed, etc., a thermodynamic model of different urban areas can be constructed. In the model, by time-averaging the terms in the heat flux equation, steady-state thermodynamic behavior is isolated, thereby ignoring short-term climate fluctuations. Specifically, by time-averaging the heat flux equation in turbulent atmospheres, the aim is to strip away the noise of random fluctuations on the UHI circulation impact, to more clearly observe and describe the average effect of the UHI effect. Figure 2 presents an example of the distribution of disturbance temperatures in a specific region.
Figure 2. Distribution of disturbance temperatures in a specific region
Based on this, further analysis is conducted on the relationship between average thermal stability, average disturbance airflow, and the average environmental temperature. Assuming the average wind field (i-,q-)≈0, the average thermal stability of the boundary layer is represented by ∂ϕ--/∂c, resulting in the following equation:
$\overline{i^{\prime}} \frac{\overline{\partial \bar{\varphi}}}{\partial a}+\overline{q^{\prime}} \frac{\overline{\partial \bar{\varphi}}}{\partial c}=0$ (7)
Assuming q′-≠0, the equation transforms to ∂ϕ--/∂c=-i′-∂ϕ--/∂a/q′-. Furthermore, this paper specifically considers the mechanism of action of urban boundary layer airflow on the UHI effect and, based on the direction of airflow, analyses how airflows drive heat and disturbances from dense urban centers to suburbs or green areas, that is, from hot areas to cold areas, and vice versa.
① When -∂ϕ--/∂a>0, i.e., in the first case, warm air may exacerbate disturbances in cold areas, leading to a decrease in thermal stability in that area. This may trigger a local increase in environmental temperature, thereby intensifying the UHI effect. At this time, upstream of the city, i'->0, q′-<0, ∂ϕ--/∂c<0; downstream of the city, i'-<0, q′-<0, also ∂ϕ--/∂c>0.
② When -∂ϕ--/∂a<0, i.e., in the second case, cooler air may be introduced into hot areas, helping to alleviate the UHI effect in that area. At this time, upstream of the city, i'->0, q′-<0, ∂ϕ--/∂c>0; downstream of the city, i'-<0, q′-<0, ∂ϕ--/∂c<0.
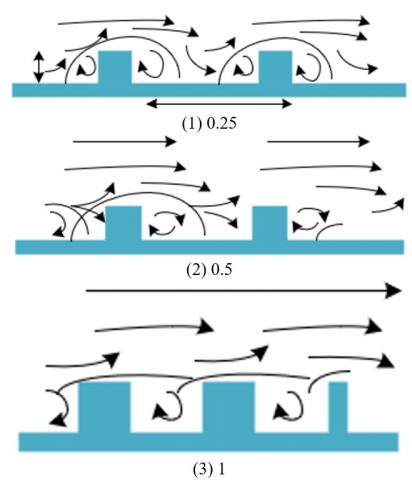
Further, this paper aims to explore the dynamic characteristics of the UHI effect by understanding the interrelationship between average thermal disturbance stability and average airflow (such as prevailing winds) and average horizontal disturbance temperature. Disturbance stability refers to changes in atmospheric layer stability under local climate conditions, directly affecting temperature distribution and airflow patterns. In urban environments, the distribution and height of buildings differ, leading to uneven distribution of sunlight and shadows, thus creating thermal inhomogeneity. Prevailing winds can carry and disperse these thermal disturbances, so the direction and strength of average airflow will determine the propagation of thermal disturbances. Meanwhile, different areas of the city show different average horizontal disturbance temperatures due to their physical properties and human activities. Time-averaged turbulence heat flux analysis of these averages can reveal how heat propagates with airflow in the city and predict the development trend of the UHI effect under different urban planning scenarios. Figure 3 intuitively displays the airflow conditions between buildings with different aspect ratios. Specifically assuming (i′-,q′-)=0, let the average thermal disturbance stability of urban boundary layers be represented by ∂ϕ′-/∂c, after time averaging the terms in Eq. (5), we have:
$\bar{i} \frac{\overline{\partial \varphi^{\prime}}}{\partial a}+\bar{q} \frac{\overline{\partial \varphi}}{\partial a}=0$ (8)
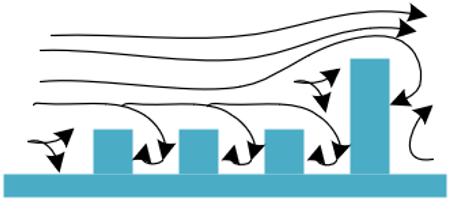
Further expanding the analysis of the UHI effect, considering the role of updrafts and downdrafts within the urban boundary layer on the UHI effect. Updrafts, usually associated with low-pressure systems, cause gases to rise, lowering temperatures near the ground, helping to disperse heat generated by the city, and may counteract or slow down the UHI effect. Conversely, downdrafts, usually associated with high-pressure systems, cause gases to descend, increasing temperatures near the ground, potentially exacerbating the UHI effect. Figure 4 intuitively shows how to use high-rise building layouts to improve ventilation at lower levels. Assuming large-scale environmental movements of ascent or descent, i.e., q-≠0, the equation can change to ∂ϕ--/∂c=-i′-∂ϕ′-/∂a/q-.
① q->0, i.e., upward movement disperses heat. If the upstream of the prevailing wind is cold advection, i->0, ∂ϕ′-/∂a>0, thus ∂ϕ′-/∂c<0, i->0, ∂ϕ′-/∂a<0, the average disturbance layer structure tends to be unstable; if the downstream of the prevailing wind is warm advection, then ∂ϕ′-/∂c>0, the average disturbance layer structure tends to be stable.
② q-<0, i.e., downward movement brings heat accumulation, opposite to the first case, where the upstream of the prevailing wind tends to be stable, the downstream tends to be unstable.
Figure 3. Airflow conditions between buildings with different aspect ratios
In urban planning, these analytical results can be fully utilized to assess the effectiveness of different planning schemes in using upward movements to disperse heat or avoiding heat accumulation brought by downward movements.
Figure 4. Using high-rise building layouts to improve ventilation at lower levels
The analysis of spatial autocorrelation and its evolution in urban planning's architectural layout is essential as it reveals how the distribution of buildings affects the urban thermal environment and identifies which layout patterns are most effective in mitigating the UHI effect. Through detailed studies of architectural layouts, it is possible to understand how different combinations and arrangements of buildings interact with their surrounding environment, leading to the aggregation or dispersion of heat within the city.
3.1 Spatial autocorrelation analysis
Combining the development patterns of the UHI effect and the analysis of thermal stability in the urban boundary layer based on the UHI effect, this paper employs the Global Moran's I and Local Moran's I indices for spatial autocorrelation analysis of architectural layouts to guide urban planning. The Global Moran's I index assesses whether the spatial distribution pattern of building layouts across the entire study area exhibits systematic clustering or dispersion, thereby determining whether the UHI effect is overall influenced by architectural configurations. Meanwhile, the Local Moran's I index focuses on detecting local spatial heterogeneity, identifying areas with high thermal stability clusters (hot spots) or low thermal stability clusters (cold spots).
After calculating the thermal stability of each area within the urban boundary layer using the collected climate and building data through a thermal balance model, the Global Moran's I index is used to analyze the spatial autocorrelation of thermal stability across the entire city, identifying whether the overall spatial distribution pattern is random. Assuming the total number of spatial units is represented by v, the measure values of spatial units u and k by au and ak, and the spatial weight matrix by quk, the calculation formulas for the Global Moran's I index are:
$\begin{gathered}U=\frac{v \sum_{u=1}^v \sum_{k=1}^v q_{u k}\left(a_u-\bar{a}\right)\left(a_k-\bar{a}\right)}{\sum_{u=1}^v \sum_{k=1}^v q_{u k}\left(a_u-\bar{a}\right)^2} \\ =\frac{\sum_{u=1}^v \sum_{k=1}^v q_{u k}\left(a_u-\bar{a}\right)\left(a_k-\bar{a}\right)}{T^2 \sum_{u=1}^v \sum_{k=1}^v q_{u k}}\end{gathered}$ (9)
$\begin{gathered}T^2=\frac{1}{v} \sum_{u=1}^v\left(a_u-\bar{a}\right)^2\end{gathered}$ (10)
$\begin{gathered}\bar{a}=\frac{1}{v} \sum_{u=1}^v a_u\end{gathered}$ (11)
Further, the Local Moran's I index is applied for local spatial autocorrelation analysis to identify local hot spots (high-high cluster areas) and cold spots (low-low cluster areas) within the city. This step reveals the local clustering phenomenon of the UHI effect in the city, providing targeted spatial areas for further analysis. Assuming the variance is represented by T2, the calculation formula for the Local Moran's I index is:
$U_u=\frac{\left(a_u-\bar{a}\right)}{T^2} \sum_k q_{u k}\left(a_k-\bar{a}\right)$ (12)
Visualize the statistical results of Global and Local Moran's I in GIS, creating spatial distribution maps of thermal stability. Further, using GIS tools to overlay architectural layouts with the spatial distribution of thermal stability, analyzing the spatial correlation between the two.
3.2 Hot/Cold spot evolution analysis
Further, the Getis-Ord Gi* index is applied for hot spot analysis, identifying statistically significant areas of high or low value clustering by comparing the thermal stability within a local area against the average level for the entire study region. Assuming different spatial units are represented by u, k, the attribute value of spatial unit/patch k by ak, the spatial weight matrix of spatial units u, k by quk, and the total number of spatial units/patches by v, the statistical formulas are as follows:
$\begin{aligned} H_u^*=\frac{\sum_{k=1}^v q_{u, k} a_k-\bar{A} \sum_{k=1}^v q_{u, k}}{\sqrt[T]{\frac{v \sum_{k=1}^v q_{u, k}^2-\left(\sum_{k=1}^v q_{u, k}\right)^2}{v-1}}} \end{aligned}$ (13)
$\begin{aligned} \bar{A}=\frac{\sum_{k=1}^v a_k}{v}\end{aligned}$ (14)
$\begin{aligned} T=\sqrt{\frac{\sum_{k=1}^v a_k^2}{v-1}}-\bar{a}^2\end{aligned}$ (15)
Mapping the results onto a map visually displays hot and cold spot areas. Analyzing the evolution of hot and cold spots over time can identify stability trends and their possible driving factors. Combining historical urban planning and construction data, further analysis can be conducted on how changes in architectural layouts affect the spatial distribution and intensity of the UHI effect.
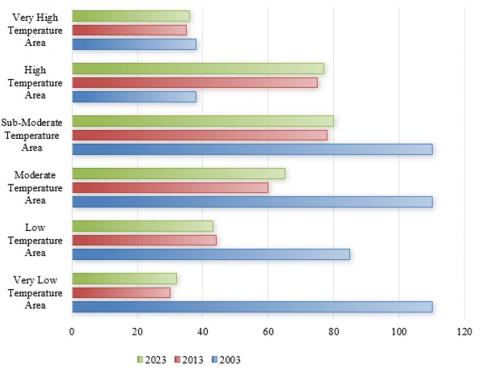
Figure 5 presents the change in the Landscape Shape Index (LSI) index for various regions of a city from 2003 to 2023, representing the very low temperature area, low temperature area, sub-moderate temperature area, moderate temperature area, high temperature area, and very high temperature area respectively. The graph shows a significant decrease in the LSI index for very low and low temperature areas, especially between 2003 and 2013. This indicates an increase in the impact of the UHI effect in these areas, leading to a rise in their temperatures. The sub-moderate and moderate temperature areas' LSI index gradually increased over these 20 years, indicating ongoing urban expansion and an increase in building density. However, this increase was relatively stable, reflecting gradual adjustments in urban planning to adapt to and mitigate the impact of the heat island effect. On the other hand, the LSI index for high and very high temperature areas showed little change, especially between 2013 and 2023, suggesting that the heat island effect in these areas has reached a relatively stable state, with effective measures taken in urban planning and architectural design to mitigate it.
Figure 5. Change in LSI of a city's regions from 2003 to 2023
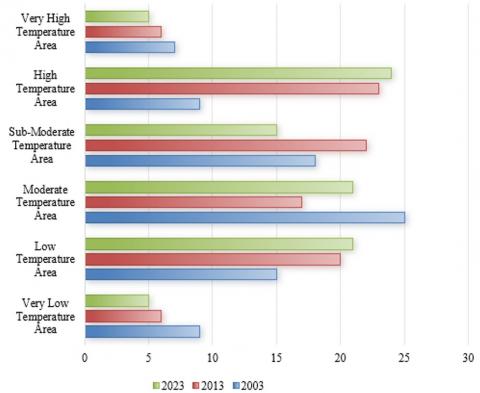
Figure 6. Change in SHAPE_MN Index of a city's regions from 2003 to 2023
Figure 6 shows the change in the SHAPE_MN index for various regions of a city from 2003 to 2023. During this period, the SHAPE_MN index for very low temperature areas dropped from 9 to 5, indicating that the shape of these areas became more regular due to increased planning and development, which helps reduce the heat island effect. The SHAPE_MN index for low temperature areas rose from 15 to 21, indicating that the landscape shape in these areas became more complex, due to preservation of natural urban terrain or small-scale development. The SHAPE_MN index for moderate temperature areas decreased from 25 to 21, meaning that the urban layout became more regular through urban planning interventions to mitigate the heat island effect in that area. The sub-moderate temperature area index increased from 18 to 22 and then dropped to 15, showing significant development and planning changes before 2013, but a more regularized layout by 2023. The high temperature area's SHAPE_MN index increased from 9 to 24, indicating increasing complexity. This is because high temperature areas, typically city centers or industrial zones, become denser and more irregular over time. The very high temperature area's SHAPE_MN index decreased from 7 to 5, indicating measures taken to plan a more regular urban layout in these areas to try to reduce the heat island effect. The changes in shape indices from 2003 to 2023, apart from the rising index in high temperature areas, indicate that urban planning is evolving towards more regular and effective layouts, improving thermal stability in the urban boundary layer and mitigating the heat island effect.
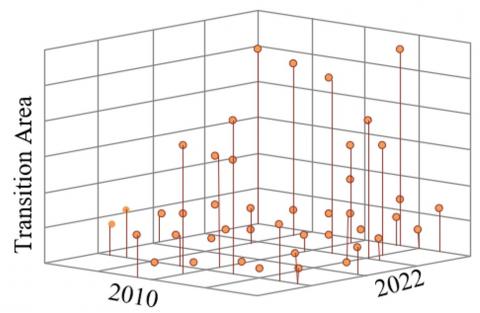
Further in-depth analysis of the thermodynamic characteristics of the UHI effect focused on the changes in thermal stability in the architectural layout within urban planning. The spatial transition matrix of building distribution based on thermal stability shown in Figure 7 reveals that from 2003 to 2013, there was a significant reduction in low temperature areas (about 130km²), mainly transitioning to sub-moderate temperature areas by 55km² and to moderate temperature areas by 9km². Moreover, the sub-moderate temperature area received the largest influx of warming areas, reaching 140km². This data reflects the shrinkage of low temperature areas and the expansion of sub-moderate and moderate temperature areas during this period. However, between 2013 and 2023, the increase in moderate temperature areas was more pronounced, totaling 159km², with 55km² coming from the sub-moderate temperature area. This phase saw a rapid expansion of the moderate temperature area and a reduction in the sub-moderate and high temperature areas, indicating a significant growth rate in the moderate temperature area compared to the 2003-2013 period. The evolution of the UHI effect over time highlights the important role of urban planning and architectural layout in regulating the urban thermal environment. Data from 2003 to 2013 show a gradual reduction in cooler areas and the initial spread of the heat island effect, while the transition rates from 2013 to 2023 reveal significant enhancement in thermal stability in the city's moderate temperature areas through effective planning strategies. This trend indicates that optimizing architectural layout with consideration for thermodynamic properties can effectively mitigate the heat island effect and improve urban environmental quality.
Figure 7. Spatial transition matrix of building distribution based on thermal stability in a city
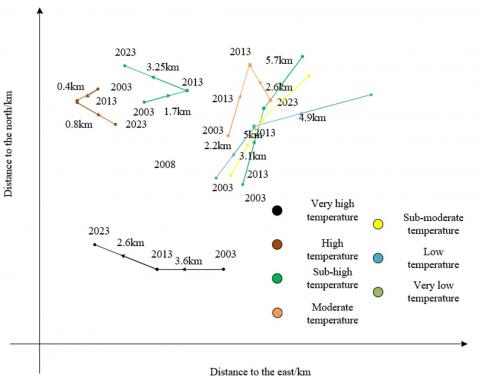
Figure 8. Evolution of the center of gravity for building distribution based on thermal stability in a city from 2003 to 2023
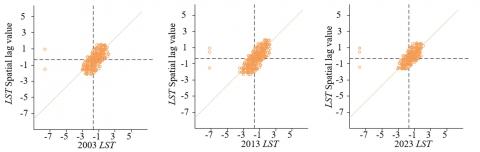
Figure 9. Moran's scatter plot of building distribution based on thermal stability in a city from 2003 to 2023
Further, through a centroid shift analysis model, the evolution of the center of gravity for building distribution in different temperature areas over two decades was detailedly tracked. Between 2003 and 2013, the center of gravity for building distribution in very low temperature areas noticeably shifted from the northeast to northwest, indicating the trend and direction of urban development in cooler areas. Meanwhile, the very high temperature area experienced the second most significant centroid shift, reflecting an intensification of the heat island effect in city centers or industrial zones. However, between 2013 and 2023, the center of gravity for building distribution in sub-moderate temperature areas moved further, mainly towards the southwest, suggesting that urban planning during this period focused more on directing development towards relatively moderate areas to achieve enhanced thermal stability and reduce the heat island effect. These experimental results reveal the dynamic relationship between urban thermal stability and building distribution. The trend of centroid shifts over the two periods indicates that urban development and expansion were consciously directed away from high heat load areas to mitigate the adverse effects of the heat island effect. Especially in the last decade, urban planning has favored development towards areas with relatively suitable temperatures, which is associated with adjustments in urban planning policies and a deeper understanding of the heat island effect. Identifying this trend is crucial for guiding future urban planning and architectural layout design, helping to push urban development towards more sustainable and ecologically friendly directions (Figure 8).
Utilizing GeoDA and ArcGIS 10.3 platforms, this paper constructed a spatial weight matrix and established a temperature lag model to capture and express the thermal stability intensity of urban boundary layers and the spatial differentiation characteristics of architectural layouts more finely. By calculating and analyzing the Global Moran's I index, the study quantified the spatial autocorrelation between thermal stability and building distribution. Figure 9 shows that in 2003, 2013, and 2023, the Global Moran's I indexes were 0.8324, 0.7677, and 0.6547, respectively. These positive values, all greater than 0.5, indicate significant spatial positive correlation in the thermal characteristics of urban areas throughout the study period, i.e., similar thermal values tend to cluster spatially. However, the index shows a declining trend over time, indicating that while regional thermal clustering still exists, its intensity is gradually weakening, possibly due to urban expansion, increased building density, and the impact of human activities on the surface environment. The spatial distribution and changing trends shown by Moran's scatter plots provide an intuitive perspective for understanding the evolution of the UHI effect. Over the span from 2003 to 2023, although there is a certain degree of spatial clustering of the heat island effect among urban areas, this clustering is gradually slowing down, likely due to factors such as increased green spaces in urban planning, improvements in building materials and design, and urban sprawl.
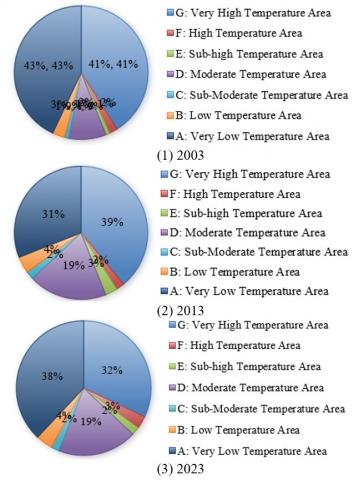
Figure 10. Temporal and spatial distribution proportion map of cold and hot spots based on thermal stability in a city's regions from 2003 to 2023
Further, by analyzing the distribution of cold and hot spots from 2003 to 2023 in a city, the evolution of the spatial pattern of the UHI effect was revealed. In 2003, a widespread cold spot area in the southern part of the city accounted for 46%, showing better thermal stability, while hot spot areas accounted for 43%, mainly concentrated in the densely built and bedrock-exposed areas of the city's north. Over time, data from 2013 showed a decrease in cold spot areas to 38% and an increase in hot spot areas to 45%, reflecting the negative impact of expanded building land and reduced green spaces on the heat island effect. By 2023, the proportion of cold spot areas slightly rebounded to 42%, while hot spot areas decreased to 38%, possibly related to urban greening measures and adaptive improvements in building planning. Despite this, the transition from cold spots to hot spots and insignificant areas in the southern region due to urban expansion is still observable. Combining these experimental results, it can be concluded that urban planning and architectural layout significantly influence the regulation of the UHI effect. Over 20 years, the spatial distribution of cold and hot spots in the city experienced significant changes, with the reduction of cold spots and expansion of hot spots closely related to changes in land use during urbanization. Particularly, the reduction of cold spots in the city's south due to rapid expansion of built areas and reduced green spaces, while the northern region maintained hot spot status due to exposed bedrock and low vegetation coverage. Although the proportion of cold spots slightly rebounded by 2023, it still reflects the thermal environmental issues present in modern urban development (Figure 10).
This paper first analyzed changes in thermal stability in the urban boundary layer based on the heat flux equation, focusing on how the UHI effect alters the thermodynamic equilibrium state of different urban areas. Then, using principles of spatial autocorrelation analysis, it studied the spatial autocorrelation and evolution characteristics of architectural layouts, thus assessing the responsiveness and regulatory potential of architectural layouts to the heat island effect.
The experimental section, through plotting changes in the LSI and SHAPE_MN index, reflected changes in the shape index of urban areas under the heat island effect. Analysis of the spatial transition matrix of building distribution based on thermal stability reflected the dynamic changes in building distribution over time. The evolution of the center of gravity for building distribution based on thermal stability from 2003-2023 revealed spatial trends in urban development. Moran's I scatter plots were drawn to explore the spatial clustering characteristics of building distribution, and cold and hot spot analysis revealed the spatiotemporal changes in building distribution based on thermal stability.
The study shows that the thermodynamic characteristics of the heat island effect in urban planning are closely related to architectural layouts, and urban planning interventions can significantly improve thermal stability. Spatial autocorrelation analysis of architectural layouts revealed the regularity and adjustment space of building distribution, indicating that proper planning can effectively regulate the heat island effect. The changes in LSI and SHAPE_MN index demonstrate progress in urban planning in improving shape indexes and reducing heat island intensity. The spatial transition matrix and center of gravity analysis revealed the dynamic process of urban development and pointed out directions for planning improvements. Overall, this paper demonstrated the importance of considering the heat island effect in urban planning through theoretical analysis and empirical research, provided specific planning suggestions, and offered theoretical and methodological support for the sustainable development of future cities.
For future urban planning, this paper will apply thermodynamics and spatial analysis methods more extensively to optimize urban layouts and mitigate the heat island effect. Further research on the impact of new materials, green buildings, and urban greening on the heat island effect will seek comprehensive solutions. Attention will be given to the long-term trends of climate change on the urban thermal environment and how socio-economic factors interact with urban thermodynamic characteristics.
This project is supported by the Basic Scientific Research Business Expenses of Universities Directly under Inner Mongolia Autonomous Region, Project Name: Research on Carbon Reduction Design of Prefabricated Buildings in Inner Mongolia Based on Digital Twin Technology (Grant No.: JY20230053); Inner Mongolia Natural Science Foundation Project, Project Name: Small and Medium-sized Public Buildings in Inner Mongolia Based on Digital Twin Technology Carbon Footprint Study (Grant No.: 2023LHMS05026).
[1] Zeng, P., Zong, C., Wei, X. (2024). Quantitative analysis and spatial pattern research of built-up environments and surface urban heat island effect in Beijing’s main urban area. Journal of Urban Planning and Development, 150(2): 04024006. https://doi.org/10.1061/JUPDDM.UPENG-4706
[2] Li, Z., Ren, P., Wang, G. (2024). Analysis of urban heat island effect based on remote sensing monitoring of ground objects changed. In Fourth International Conference on Geology, Mapping, and Remote Sensing (ICGMRS 2023), Wuhan, China, pp. 588-596. https://doi.org/10.1117/12.3020962
[3] Liu, F., Liu, J., Zhang, Y., Hong, S., Fu, W., Wang, M., Dong, J. (2024). Construction of a cold island network for the urban heat island effect mitigation. Science of The Total Environment, 915: 169950. https://doi.org/10.1016/j.scitotenv.2024.169950
[4] Qiu, J., Li, X., Qian, W. (2023). Optimizing the spatial pattern of the cold island to mitigate the urban heat island effect. Ecological Indicators, 154: 110550. https://doi.org/10.1016/j.ecolind.2023.110550
[5] Qian, W., Li, X. (2023). A cold island connectivity and network perspective to mitigate the urban heat island effect. Sustainable Cities and Society, 94: 104525. https://doi.org/10.1016/j.scs.2023.104525
[6] Cai, Z., La Sorte, F.A., Chen, Y., Wu, J. (2023). The surface urban heat island effect decreases bird diversity in Chinese cities. Science of the Total Environment, 902: 166200. https://doi.org/10.1016/j.scitotenv.2023.166200
[7] Tariku, F., Gharib Mombeni, A. (2023). ANN-based method for urban canopy temperature prediction and building energy simulation with urban heat island effect in consideration. Energies, 16(14): 5335. https://doi.org/10.3390/en16145335
[8] Shen, P., Wang, M., Liu, J., Ji, Y. (2023). Hourly air temperature projection in future urban area by coupling climate change and urban heat island effect. Energy and Buildings, 279: 112676. https://doi.org/10.1016/j.enbuild.2022.112676
[9] Chen, H., Huang, J.J., Li, H., Wei, Y., Zhu, X. (2023). Revealing the response of urban heat island effect to water body evaporation from main urban and suburb areas. Journal of Hydrology, 623: 129687. https://doi.org/10.1016/j.jhydrol.2023.129687
[10] Zhou, D., Sun, S., Li, Y., Zhang, L., Huang, L. (2023). A multi-perspective study of atmospheric urban heat island effect in China based on national meteorological observations: Facts and uncertainties. Science of the Total Environment, 854: 158638. https://doi.org/10.1016/j.scitotenv.2022.158638
[11] Luo, Y., Yang, Y., He, S., Dou, M., Wang, R., Zhang, T., Wang, F. (2023). Exploring the effect of industrial structure on urban heat island effect with infrared observations. Infrared Physics & Technology, 130: 104615. https://doi.org/10.1016/j.infrared.2023.104615
[12] You, M., Huang, J., Guan, C. (2023). Are new towns prone to urban heat island effect? implications for planning form and function. Sustainable Cities and Society, 99: 104939. https://doi.org/10.1016/j.scs.2023.104939
[13] Fang, Y., Gu, K. (2022). Exploring coupling effect between urban heat island effect and PM 2.5 concentrations from the perspective of spatial environment. Environmental Engineering Research, 27(2): 200559. https://doi.org/10.4491/eer.2020.559
[14] Jang, S., Bae, J., Kim, Y. (2024). Street-level urban heat island mitigation: Assessing the cooling effect of green infrastructure using urban IoT sensor big data. Sustainable Cities and Society, 100: 105007. https://doi.org/10.1016/j.scs.2023.105007
[15] Estrada-Calderon, G., Becerra-Santacruz, H. (2022). Temperature sensitive surface to minimize the urban heat island effect. In 2022 7th International Conference on Smart and Sustainable Technologies (SpliTech), Split / Bol, Croatia, pp. 1-5. https://doi.org/10.23919/SpliTech55088.2022.9854323
[16] Sharma, A., Kale, G.D. (2022). Assessment of urbanization impact on urban heat island effect and rainfall for the Surat city. Acta Geophysica, 70(1): 243-264. https://doi.org/10.1007/s11600-021-00715-1
[17] Yao, X., Yu, K., Zeng, X., Lin, Y., Ye, B., Shen, X., Liu, J. (2022). How can urban parks be planned to mitigate urban heat island effect in “Furnace cities”? An accumulation perspective. Journal of Cleaner Production, 330: 129852. https://doi.org/10.1016/j.jclepro.2021.129852
[18] Yao, L., Sun, S., Song, C., Wang, Y., Xu, Y. (2022). Recognizing surface urban heat ‘island’effect and its urbanization association in terms of intensity, footprint, and capacity: A case study with multi-dimensional analysis in Northern China. Journal of Cleaner Production, 372: 133720. https://doi.org/10.1016/j.jclepro.2022.133720
[19] Singh, V.K., Bhati, S., Mohan, M., Sahoo, N.R., Dash, S. (2022). Numerical simulation of the impact of urban canopies and anthropogenic emissions on heat island effect in an industrial area: A case study of Angul-Talcher region in India. Atmospheric Research, 277: 106320. https://doi.org/10.1016/j.atmosres.2022.106320
[20] Zhao, X., Xue, W., Lian, X., Wang, M., Mu, Y. (2022). Air conditioning load forecasting model considering EV and urban heat island effect. In 2022 4th Asia Energy and Electrical Engineering Symposium (AEEES), Chengdu, China, pp. 226-229. https://doi.org/10.1109/AEEES54426.2022.9759826
[21] Gao, Y., Zhao, J., Han, L. (2022). Exploring the spatial heterogeneity of urban heat island effect and its relationship to block morphology with the geographically weighted regression model. Sustainable Cities and Society, 76: 103431. https://doi.org/10.1016/j.scs.2021.103431
[22] Mandal, J., Patel, P.P., Samanta, S. (2022). Examining the expansion of Urban Heat Island effect in the Kolkata Metropolitan Area and its vicinity using multi-temporal MODIS satellite data. Advances in Space Research, 69(5): 1960-1977. https://doi.org/10.1016/j.asr.2021.11.040