Congyi Jin![]()
© 2023 IIETA. This article is published by IIETA and is licensed under the CC BY 4.0 license (http://creativecommons.org/licenses/by/4.0/).
OPEN ACCESS
With the continuous deepening of urbanization, railway passenger stations have become the core transport nodes of cities, transporting a large number of passengers every day. However, people’s demand for thermal comfort in the environment has been gradually increasing at the same time, making thermal comfort and sustainability of the stations indispensable elements in their design. Although studies of building thermal comfort are quite rich in theory and practice, most of them focus on residential or office buildings. The specific public facilities of railway passenger stations have been studied relatively less. Therefore, this study dug into the thermal comfort of those stations from the perspective of human thermal balance and sensation. At the same time, the sustainability of thermal comfort was evaluated and analyzed by combining the structural equation model (SEM) and the Importance Performance Analysis (IPA) model, aiming to provide reference and guidance for the design and renovation of railway passenger stations in the future.
railway passenger stations, thermal comfort, sustainability, structural equation model, importance performance analysis model
During the urbanization in the 21st century, transportation infrastructures, especially railway passenger stations, has gradually become the heart of every city [1, 2]. Tens of thousands of people enter and exit these modern transport hubs from all directions each day, enjoying convenient mobility. In this context, railway passenger stations are not only a manifestation of transport functions, but also an important symbol of urban cultural and technological development [3-7]. However, with the improvement of people’s quality of life at the same time, the demand for thermal comfort in building environments also have been increasing [8-18]. Therefore, it is a new design challenge to further enhance the thermal comfort and sustainability of those stations while meeting their basic functions.
As the “business card” of a city, those stations are often the first impression when people first set foot in the city. Temperature, humidity, air quality and other factors of the stations directly affect people’s mood and evaluation of the city [19-21]. By improving their thermal comfort, people’s travel experience can be greatly enhanced, thereby promoting the development of railway transport. With increasingly serious environmental problems today, the sustainability of buildings cannot be ignored [22-27]. Efficient and green railway passenger stations not only save energy and reduce carbon emissions, but also subtly guide the public towards a more environmentally friendly lifestyle.
Rich theoretical and practical experience have been accumulated in the studies of building thermal comfort. However, many of them remain at the theoretical level and lack specific applications [28, 29]. Meanwhile, existing studies mostly focus on residential or office buildings, rarely involving large-scale public facilities, such as railway passenger stations [30]. Therefore, many theories and methods may not be suitable when applied to those stations. In addition, many evaluation methods are too single and not comprehensive, making it difficult to comprehensively evaluate the thermal comfort and sustainability of a building.
In view of the above problems, this study aimed to conduct in-depth research on the thermal comfort and sustainability of railway passenger stations. Combined with the theory of human thermal balance and sensation, this study first deeply discussed the thermal comfort of those stations. Through field research and data collection, this study attempted to identify the key factors affecting thermal comfort, and proposed corresponding suggestions for improvement. Then the thermal comfort sustainability of the stations was evaluated using structural equation model (SEM). After the evaluation was completed, the Importance Performance Analysis (IPA) model was further used to comprehensively analyze the importance and sustainability of each influencing factor. Through this series of researches, this study not only provides useful guidance for the design and transformation of railway passenger stations, but also provides new ideas and methods for research in related fields.
2.1 Analysis of human thermal balance
As a highly dense and mobile public space, the indoor environment of railway passenger stations has a direct impact on the comfort of passengers. Figure 1 shows a cross-sectional view of a physical model of the station. Instead of being single, the human sensation of surrounding environment is the interaction result of multiple factors. A human body maintains its core body temperature through heat exchange with the environment, which involves radiation, convection, evaporation, conduction and other forms of heat exchange. Due to the unique structure and a large flow of people, the indoor thermal environment of railway passenger stations is easily affected, thereby affecting the thermal balance of the human body. Meanwhile, user satisfaction is particularly important because the main goal of the stations is to serve passengers. The actual needs of passengers can be better understood and met from the perspective of human thermal sensation, thereby improving their experience inside the stations. This study analyzed the thermal comfort of railway passenger stations from two perspectives: human thermal balance and sensation.
Figure 1. Cross-sectional view of a physical station model
This study analyzed the thermal balance state of human bodies at railway passenger stations from four aspects, namely, construction of a thermal balance equation, as well as the heat exchange amount of human bodies through convection, radiation and evaporation.
The thermal balance equation provides a complete and systematic framework, describing the heat exchange process between human bodies and the environment, which is the foundation of any research on thermal comfort. By understanding and constructing the thermal balance equation, it helps identify key parameters affecting human thermal comfort, and provides targeted guidance for architectural design. Considering that the heat exchange between human bodies and the surrounding environment is a dynamic equilibrium process, body temperatures remain stable when the heat obtained from the environment is equal to that lost by the bodies. In the scenario of railway passenger stations, human bodies are subjected to different sources of heat input (e.g., solar radiation, and heat release of indoor lighting and equipment), and heat output (e.g., heat exchange with the environment through convection, radiation and evaporation). Let L be the metabolic rate of human bodies; Q be their mechanical work; V, E and R be the heat dissipated by human bodies to the outside world through convection, radiation and sweat evaporation, respectively; A be the heat storage capacity of the bodies. The heat balance equation of human bodies in the actual scenario of railway passenger stations is given as follows:
$L-Q-V-E-R=A$ (1)
In large indoor spaces like the stations, air flow and temperature distribution directly affect the convective heat transfer of human bodies, thereby affecting their thermal balance state. That is, convective heat transfer involves the heat exchange between human bodies and the surrounding air, by taking into account airflow rate, temperature differences and characteristics of the body surface. At railway passenger stations, convective heat transfer is affected by the airflow generated by air conditioning systems, large glass curtain walls and the flow of people. Let dvm be the area coefficient of clothing, gv be the convective heat transfer coefficient between the body surface and the environment, dvm be the outer surface temperature of clothing, and ys be the surrounding air temperature of human bodies. The convective heat transfer of human bodies in the actual scenario of railway passenger stations can be calculated using the following equation:
$V=d_{v m} g_v\left(y_{v m}-y_s\right)$ (2)
Radiant heat transfer involves the exchange of electromagnetic waves between human bodies and the surrounding environment, by taking into account temperature differences between the two, radiation characteristics of the surface, and the shape factor. Radiant heat transfer is affected by the selected materials, colors, and the orientation and size of windows at the stations. Let dEF be the effective radiating area coefficient of human bodies, γ be the average emissivity of body surface, δ be the Stefan-Boltzmann constant, and YME be the average radiation temperature of the environment. The radiant heat transfer of the body surface in the actual scenario of railway passenger stations can be calculated using the following equation:
$E=d_{E F} d_{v m}\left(Y_{v m}^4-Y_{M R}^4\right)$ (3)
The impact of evaporative heat exchange of human bodies on indoor humidity cannot be ignored, because there is a large flow of people at railway passenger stations. Indoor humidity directly affects the comfort and health of human bodies. Evaporative heat transfer involves heat release from the bodies through sweat evaporation, by taking into account air humidity, sweat rate of the bodies, and skin characteristics. At railway passenger stations, a large flow of people means higher evaporative heat transfer. Therefore, designers need to consider appropriate ventilation and air conditioning systems to regulate humidity, thereby ensuring the human comfort. Let VRE be the sensible heat loss during breathing, RRE be the latent heat loss during breathing, Os be the partial vapor pressure around human bodies, ODI be the heat release dissipated and evaporated through skin, and RRS be the latent heat loss caused by skin surface sweating in comfortable conditions. The total evaporative heat dissipation of human bodies in the actual scenario of railway passenger stations can be calculated using the following equation:
$R=V_{R E}+R_{R E}+R_{D I}+R_{R S}$ (4)
VRE can be calculated using the following equation:
$V_{R E}=0.0014 L\left(34-y_s\right)$ (5)
RRE can be calculated using the following equation:
$R_{R E}=0.173 L\left(5.867-O_s\right)$ (6)
Os and ODI can be calculated using the following equation:
$R_{D I}=3.05\left(0.25 y_{a j} 3.335-O_s\right)$ (7)
RRS can be calculated using the following equation:
$R_{R S}=0.42(L-Q-58.2)$ (8)
2.2 Analysis of human thermal sensation
Human thermal comfort is crucial in architectural design, and particularly crucial for public places with dense flow of people and frequent activities, such as railway passenger stations, because it directly affects the travel experience and safety of passengers. Research on thermal comfort needs to be conducted from multiple perspectives. Therefore, this study analyzed the thermal sensation state of human bodies at the stations from five aspects, namely, air temperature, relative humidity, average radiation temperature, metabolism, and thermal resistance of clothing.
Air temperature is the most direct factor affecting human thermal comfort. At railway passenger stations, there may be differences in air temperature between different seasons and time periods, and even between the platform and waiting room. Appropriate air temperature can effectively reduce the risk of overheating or overcooling in human bodies.
Humidity is related to evaporation and heat dissipation of human bodies. When humidity is high, sweat evaporation slows down, which may cause human bodies to feel hotter. Although sweat evaporates quickly in a dry environment, it also leads to dry and uncomfortable skin. The humidity inside railway passenger stations needs to be moderate to ensure human thermal comfort and health.
The average radiation temperature is related to the radiant heat exchange between human bodies and the surrounding environmental surface (e.g., walls, floors, ceilings, etc.). At railway passenger stations, the average radiation temperature may be affected by large areas of glass windows, metal components, etc., thereby affecting human thermal sensation. Let y-e be the average radiation temperature, Dbu be the visible area of the surrounding environmental surface, and Ybu be each surface temperature in the surrounding environment. The mathematical expression for the average radiation temperature is given as follows:
$\bar{y}_e=\frac{\sum_{u=1}^j\left(D_{b u} y_{b u}\right)}{\sum_{u=1}^j D_{b u}}$ (9)
Black globe thermometer is a widely accepted and used tool for measuring the average radiation temperature. Its design aims to absorb radiant heat from all directions, and reach the same temperature as its surrounding environment in a short period of time. The working principle is to uniformly absorb and emit all radiation using a black globe, thereby reflecting the average radiation temperature in the environment. Due to its special design, the thermometer quickly reaches the same temperature as its surrounding environment, obtaining timely data even in changing environments. Considering the complex environment of railway passenger stations and the needs of research, it is suitable to measure the average radiation temperature using the black globe thermometer, because it provides accurate and reliable data for this study. Let yh be the temperature of the black globe, ys be the air temperature, and cs be the air speed. The average radiation temperature can be calculated using the following equation:
$\bar{y}_e=y_h+2.44 \sqrt{c_s}\left(y_h-y_s\right)$ (10)
Clothing is an important isolation layer between human bodies and the external environment. Different clothing materials and their thickness and tightness all affect the thermal resistance. Passengers at stations may wear different clothing due to travel needs, which affects their thermal sensation and comfort. The thermal resistance of clothing can be calculated using the following equation:
$1 C L O=0.155\left(l^2 \cdot J\right) / Q$ (11)
In addition, human bodies have different metabolic rates under different activity states. For example, walking passengers have a higher metabolic rate and generate more calories compared with sitting ones. By understanding the activity patterns and metabolic changes of passengers at railway passenger stations, it helps evaluate their demand for thermal comfort more accurately.
Figure 2. Evaluation model for thermal comfort and sustainability of railway passenger stations
SEM allows researchers to evaluate potential relationships between multiple variables. In research on thermal comfort of railway passenger stations, multiple factors may affect each other, and SEM helps reveal these complex causal relationships. At the same time, SEM provides researchers with a method to measure potential variables that are unobservable or difficult to measure directly, such as human comfort, which can be used to discuss their relationships with observable variables. The IPA model can be used to comprehensively analyze the importance and current situations of various factors, thereby identifying priority areas for improvement for decision-makers. This model is usually represented by a two-dimensional graph, which helps quickly and intuitively identify which factors require urgent attention and which have reached a satisfactory level. Based on the results of the IPA model, specific and targeted strategies can be proposed for improving the thermal comfort of railway passenger stations, thereby achieving more efficient resource allocation and decision-making. Based on the above reasons, this study evaluated the thermal comfort sustainability of stations by constructing and solving SEM. Then the IPA model was used to comprehensively analyze the importance and sustainability state of the factors affecting the sustainability, and scientific and reasonable improvement strategies were proposed based on the current situation of each factor. Figure 2 shows the evaluation model for thermal comfort and sustainability of railway passenger stations.
By combining thermodynamics with architectural design concepts, the following latent and observable variables were determined in the actual scenario of railway passenger stations:
First, exogenous latent variables, including 1) Environmental factors, which are related to the microclimate conditions around railway passenger stations; 2) Architectural design factors, which are related to the architectural design characteristics of the stations; 3) Crowd density, which describes the flow of people inside the stations by considering that there may be different flow of people at different time.
Second, endogenous latent variables, including 1) Human thermal comfort, which reflects the subjective comfort feelings of passengers at the stations. 2) Building energy efficiency, which refers to the energy efficiency consumed by the stations when maintaining appropriate temperature, humidity and other conditions. 3) Sustainability evaluation, which evaluates the overall environmental friendliness and long-term operating costs of the stations.
Third, observable variables, including 1) Environmental factors, which include air temperature, relative humidity, and wind speed. 2) Architectural design factors, which include the thermal conductivity of buildings, the reflectivity of exterior wall materials, and the size and location of windows. 3) Crowd density, which includes the daily number of passengers entering and exiting the stations, as well as the average crowd density within the stations. 4) Human thermal comfort, which includes satisfaction survey for passengers and their sensation of temperature and humidity. 5) Building energy efficiency, which includes energy consumption data and the type of energy used. 6) Sustainability evaluation, which includes the proportion of green building materials used and the utilization rate of renewable energy.
Let ξ and λ be endogenous and exogenous latent variables, respectively; Z and T be the vectors of observable values of ξ and λ; Sz and St be the load matrices; γ be the residual value. The measurement equation response models of the constructed latent and observable variables are given as follows:
$Z=S_z \zeta+\gamma_z$ (12)
$T=S_t \lambda+\gamma_t$ (13)
Let ξ and λ be the vectors of endogenous and exogenous latent variables; Z and T be the vectors of observable values; Π be the multiple regression coefficient; γ be the residual value. The measurement equation composition models of the constructed latent and observable variables are given as follows:
$\lambda=\prod_\lambda T+\sigma_\lambda$ (14)
$\xi=\prod_{\xi} Z+\delta_{\xi}$ (15)
Let λ be the vector of endogenous latent variables, N be the relationship between endogenous latent variables, Г be the impact of exogenous latent variables on endogenous ones, and ξ be the residual value. The constructed structural equation is given as follows:
$\lambda=N_\lambda+\Gamma_{\xi}+\xi$ (16)
Let β and α be the weights, then the weight relationship equations used to estimate the size of latent variables are given as follows:
$\lambda^*=\beta T$ (17)
$\xi^*=\alpha Z$ (18)
In the graphical representation of the IPA model, the vertical axis represents the thermal comfort sustainability of railway passenger stations, while the horizontal one represents the importance of variables. In this way, a location in this two-dimensional space can be found for each factor. The PLS path model is used to determine both the importance of variables and the evaluation value of the thermal comfort sustainability of stations. The mean values of both values serve as the dividing points for the X and Y axes, dividing the two-dimensional space into four quadrants, namely, the first quadrant (high importance, high thermal comfort sustainability), the second quadrant (high importance, low thermal comfort sustainability), the third quadrant (low importance, low thermal comfort sustainability), and the fourth quadrant (low importance, high thermal comfort sustainability). Based on the location of each factor on the IPA graph, the strategies that should be taken can be determined, such as strengthening certain factors or reallocating resources.
The partial least squares (PLS) path model is a type of SEM, which handles small samples, non-normal data, complex model structures and other problems. In this study, the PLS path model was used to calculate the thermal comfort sustainability of railway passenger stations and its index weights. First, relevant data, such as indoor and outdoor temperature, humidity and wind speed of the stations, was collected as the actual values of observable variables. The thermal comfort sustainability of those variables was directly solved based on survey data using the following equation:
$z\,\,data =\frac{ { Actual scores }}{{ Comprehensive full scores }} \times 100$ (19)
The specific thermal comfort sustainability of railway passenger stations was calculated according to the regression equation set between observable and structural variables. Let DF be the scores of the thermal comfort sustainability; ξ be the overall thermal comfort sustainability of variables; R[ξ], MIN[ξ] and MAX[ξ] be the expected, minimum and maximum values of the overall thermal comfort sustainability. The coefficients of observable variables are their weights. The thermal comfort sustainability was calculated using the following equation:
$D F=\frac{R[\xi]-M I N[\xi]}{M A X[\xi]-M I N[\xi]} \times 100$ (20)
Let zu be the observable variables corresponding to the overall thermal comfort sustainability, qy be the weights of observable variables, and b be the number of observable variables, then there were the following equations:
$R[p a]=\sum_{u=1}^0 q_u \text{z}_u$ (21)
${MIN}[\xi]=\sum_{u=1}^0 q_u M I N\left[\text{z}_u\right]$ (22)
${MAX}[\xi]=\sum_{u=1}^o q_u MAX\left[\text{z}_u\right]$ (23)
The scoring range for thermal comfort sustainability of the stations is from 1 to 10. Therefore, the sustainability was calculated using the following equation:
$D F=\frac{\sum_{u=1}^3 q_u \text{z}_u-\sum_{u=1}^3 q_u \text{z}_u}{9 \sum_{u=1}^3 \bar{q}_u} \times 100$ (24)
In SEM, the relationships between latent variables and corresponding observable variables can be characterized by weights. The weights of multiple latent and observable variables need to be calculated and analyzed when evaluating a complex system, such as the thermal comfort sustainability of railway passenger stations. To obtain accurate index weights, the total weight of the total sustainability impact was first solved based on each latent variable. Let Qy be the total impact of relevant latent variables on the thermal comfort sustainability, and b be the number of latent variables, then there were:
$O_u=\frac{Q_u}{\sum_{u=1}^b Q_u}$ (25)
Let qu be the path coefficients between observable variables and their latent variables, and b be the number of observable variables corresponding to latent ones. In SEM, the path coefficients between latent variables and their corresponding observable variables directly reflect their relative weights. To ensure that the sum of weights of all observable variables was 1, the relative weight of each observable variable was standardized. The equation was given as follows:
$w_u=\frac{q_u}{\sum_{u=1}^b q_u}$ (26)
Finally, the total weight of each latent variable was multiplied by the relative weight of its corresponding observable variable, which obtained the absolute weight of each observable variable. Whether the sum of absolute weights of all observable variables was 1 was checked, aiming to ensure the rationality and comparability of the weights.
Figure 3 shows the inbound and outbound temperature values of all measuring points with different numbers of sub-regions (i.e., 0.5 million, 0.6 million, 0.7 million, and 0.8 million). It can be seen from the figure that the temperature generally shows a downward trend from Measuring points 1 to 12, regardless of the number of sub-regions divided, which is related to the inbound and outbound process, crowd distribution, or building structure. When the number of sub-regions is 0.5 million, the measuring points have the highest average temperature. As the number of sub-regions increases to 0.8 million, the temperature generally shows a downward trend, indicating that an increase in the number of sub-regions leads to smoother air circulation or a more uniform crowd distribution, resulting in a decrease in temperature.
Figure 3. Comparison of inbound and outbound temperature values with different numbers of sub-regions
Figure 4. Relative heat index value of passenger stations during the morning peak
Figure 5. Relative heat index value of passenger stations during the evening peak
Based on the above Figures 4 and 5, comparative analysis can be made for the relative heat index value of passenger stations during peak hours. It can be seen from the figure that the relative heat index of inbound and outbound process during both morning and evening peaks shows an opposite trend, with the index of the inbound process gradually decreasing, while that of the outbound process gradually increasing. In the comparison of the entire peak hours, the relative heat index of the inbound process during the evening peak is initially higher than that during the morning peak, but then decreases. The relative heat index of the outbound process during the evening peak is always lower than that during the morning peak, but the growth rate is more significant, indicating that the passenger flow during the evening peak gradually decreases over time, resulting in a gradual decrease in the relative heat index of the inbound process. However, the outbound passenger flow still maintains a certain growth, leading to a continuous increase in its relative heat index. Based on the above analysis, it is clear that there are significant differences in the thermal comfort of railway passenger stations during different peak hours. Designers and operators should make targeted adjustments and optimizations based on actual situations.
Table 1. Metabolic rate, thermal resistance of clothing, and relative wind speed at different activity levels
|
State of Motion |
Metabolic Rate |
Thermal Resistance After Sweating |
Indoor Relative Wind Speed |
|
Basic metabolism |
46.3 |
0.6 |
0 |
|
Sitting for a rest |
62 |
0.6 |
0.1 |
|
Sitting posture |
77.9 |
0.4 |
0.24 |
|
Standing posture |
87.2 |
0.5 |
0.14 |
|
Standing or occasional walking |
121.4 |
0.4 |
0.5 |
|
Walking speed of 3km/h |
114.2 |
0.4 |
1 |
|
Walking speed of 4km/h |
169.6 |
0.34 |
1.4 |
|
Walking speed of 5km/h |
231.4 |
0.3 |
2 |
The following analysis can be made based on the data in Table 1. As shown in the table, the metabolic rate increases as the state of motion increases. The metabolic rate gradually increases from “basic metabolism” to “walking speed of 5km/h”, which means that the heat released by the human body gradually increases as the activity intensity increases. With the increase of activity level (especially the increase of movement speed), the thermal resistance of clothing gradually decreases, because the sweat generated by the increased activities leads to a decrease in the thermal resistance of clothing, or people prefer to wear more breathable clothing with lower thermal resistance at higher activity levels. It can be seen from the table that the indoor relative wind speed gradually increases as the activity level increases, because people create wind during their movement or increase ventilation to enhance heat dissipation with the increase of activities. For railway passenger stations or similar places, it is important to understand these variables and their relationships, because it helps designers and operators provide better temperature and ventilation control, thereby enhancing the thermal comfort of passengers.
Table 2. Classification of human thermal comfort index standards
|
Thermal Sensation |
Thermal Sensation Scale |
Relative Thermal Index Value |
|
Warm |
2 |
0.24 |
|
Slightly warm |
1 |
0.14 |
|
Comfortable |
0 |
0.08 |
|
Slightly cool |
-1 |
0 |
The following analysis can be made based on the data in Table 2. The table lists four heat sensations ranging from warm to slightly cool, and assigns a numerical scale to each sensation. This scale is quantitative, and provides a quantitative measure of thermal sensation. A positive value represents the sense of warmth, while a negative one represents the sense of coldness. The warm sensation has the highest relative heat index value (0.24), while the slightly cool sensation has a relative heat index value of 0, indicating that the value is directly related to human thermal sensation. A higher index value corresponds to the warm sensation, while a lower or zero value corresponds to the cold or neutral sensation. According to the table, the relative heat index value corresponding to comfortable thermal sensation is 0.08, which provides a reference point or benchmark for determining whether the thermal sensation in other activities or environmental conditions is within a comfortable range. When designing and evaluating the thermal comfort of railway passenger stations, these index values can be used as a reference. For example, if the goal is to create an environment that makes most people feel “comfortable”, the relative heat index value should be as close as possible to 0.08.
Figure 6. Heat flow changes at passenger stations with ventilated doors and windows
The following comparative analysis can be made based on the data in Figure 6. Regardless of other conditions, the indoor heat flow significantly increases at each measuring point when the radiation intensity increases from 400 to 800, indicating a direct positive correlation between radiation intensity and indoor heat flow. With the radiation intensity is 400, 600 and 800, respectively, data in windy and windless conditions indicates that wind significantly reduces heat flow, because the increase in wind speed leads to more effective convection, thereby helping dissipate heat. When the radiation intensity is 400, it seems that the wind significantly reduces the heat flow. When the radiation intensity is 600, the wind also has a significant cooling effect, but the decrease is slightly smaller compared with the radiation intensity of 400. However, although the wind still reduces the heat flow when the radiation intensity increases to 800, its effect is slightly weaker compared with the other two radiation intensities. Although ventilation reduces the heat flow in all radiation intensity conditions, its relative effect decreases as the radiation intensity increases, meaning that other methods need to be used to further improve indoor thermal comfort when the radiation intensity is high.
Figure 7. Heat flow changes at passenger stations with closed doors and windows
The following comparative analysis can be made based on the data in Figure 7. Even if the air conditioning is not turned on, the indoor heat flow at most measuring points increases when the radiation intensity increases from 400 to 600. For example, the heat flow increases from 62 to 70 at the Measuring point 1, and increases from 57 to 82 at the Measuring point 2, which confirms the statement in the earlier part of this study, i.e., radiation intensity and indoor heat flow are positively correlated. At each radiation intensity, data comparison with air conditioning both turned on and off indicates that heat flow can be significantly increased by turning on the air conditioning, because a large amount of cold air is generated, leading to an increase in indoor heat flow. At the radiation intensity of 400, the air conditioning increases heat flow very significantly. When the radiation intensity is 600, the heat flow also increases by turning on the air conditioning, but the increase is slightly smaller compared with the radiation intensity of 400. Overall, apart from radiation intensity and ventilation, the use of air conditioning should also be considered when considering architectural design and thermal comfort of railway passenger stations. It is not the best cooling method to turn on the air conditioning especially when the radiation intensity is high. Therefore, other methods need to be combined to maintain indoor thermal comfort.
The following analysis can be made based on Table 3 and previous discussions. According to the impact of various factors on thermal comfort sustainability, thermal comfort sensation value of passengers has the greatest impact on the sustainability. Most factors have a direct impact on the sensation value or the sustainability, with a relatively small indirect impact. Analysis shows that thermal comfort sensation value of passengers, human thermal comfort and architectural design factors are in the region of “high impact and low satisfaction”, and their improvements need to be prioritized. Environmental factors, crowd density, and sustainability evaluation are in the region of “low impact and high satisfaction”, which means that their impact is smaller but their satisfaction is higher. From the perspective of the IPA model, the priority is to focus on the above three factors. Although environmental factors, crowd density and sustainability evaluation are important, their current situations are relatively satisfactory, and their improvements can be considered after improving other factors.
Table 3. Influential effect values of different variables for thermal comfort sustainability
|
Variables |
Correlation |
Direct Impact |
Indirect Impact |
Total Impact |
|
Environmental factors |
Between environmental factors and thermal comfort sensation value |
0.175 |
0 |
0.159 |
|
Between environmental factors and thermal comfort sustainability |
0 |
0.085 |
0.085 |
|
|
Architectural design factors |
Between architectural design factors and thermal comfort sensation value |
0.375 |
0 |
0.378 |
|
Between architectural design factors and thermal comfort sustainability |
0 |
0.189 |
0.189 |
|
|
Crowd density |
Between crowd density and thermal comfort sensation value |
0.217 |
0 |
0.214 |
|
Between crowd density and thermal comfort sustainability |
0 |
0.114 |
0.124 |
|
|
Human thermal comfort |
Between human thermal comfort and thermal comfort sensation value |
0.389 |
0 |
0.385 |
|
Between human thermal comfort and thermal comfort sustainability |
0 |
0.212 |
0.214 |
|
|
Sustainability evaluation |
Between sustainability evaluation and thermal comfort sustainability |
0.289 |
0 |
0.286 |
|
Thermal comfort sensation value of passengers |
Between thermal comfort sensation value of passengers and thermal comfort sustainability |
0.523 |
0 |
0.527 |
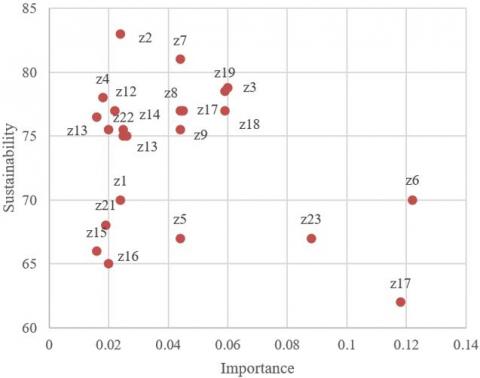
Figure 8. IPA model matrix
The following analysis can be made based on the provided data and the IPA model (Figure 8). In the first quadrant, the importance of factors is greater than 0.044, and their sustainability is greater than 74.7. These factors perform well and should maintain the good performance because they are important. In the second quadrant, the importance of factors is greater than 0.044, but their sustainability is lower than 74.7. Therefore, the priority is to focus on and improve this region. In the third quadrant, the importance of factors is less than 0.044, but their sustainability is greater than 74.7. These factors currently perform well, but they are relatively less important. Nevertheless, the focus on them should be maintained. In the fourth quadrant, the importance and sustainability of factors are lower than the mean value. These factors are not the current focus of attention, but may require attention in the future.
This study first dug into the thermal comfort of railway passenger stations by combining with the theory of human thermal balance and sensation. By comparing data between different sub-regions, radiation intensities and time periods, this research studied the impact of inbound and outbound temperature values, the heat index value and the status of doors and windows of passenger stations on indoor heat flow. Data shows that the use of ventilation and air conditioning has a significant impact on the indoor heat flow. The table data shows the impact of metabolic rate, thermal resistance of clothing and relative wind speed on human thermal comfort at different activity levels. Different states of motion lead to changes in metabolic rate, thereby affecting thermal comfort. By comparing thermal sensation, thermal sensation scale, and the relative thermal index value, four types of thermal sensations were defined, namely, warm, slightly warm, comfortable, and slightly cool.
Furthermore, SEM was used to study the direct and indirect impact of several factors (i.e. environmental factors, architectural design factors, crowd density, and human thermal comfort) on the thermal comfort sustainability. The importance and thermal comfort sustainability of various influencing factors were analyzed using the IPA model. Four quadrants regarding the importance and performance of factors were obtained.
The thermal comfort of railway passenger stations is influenced by multiple factors, including human activity level, indoor and outdoor environments, architectural design, and crowd density. Proper ventilation and use of air conditioning are of great significance for improving thermal comfort. By comprehensively analyzing SEM and the IPA model, the main influencing factors of the thermal comfort sustainability were identified, thereby providing directional suggestions for improving the thermal comfort of railway passenger stations. To achieve the long-term thermal comfort of passengers, the stations should prioritize factors with high importance and current poor performance, and continue to pay attention to and improve other relevant factors.
This paper was funded by 2020 PHD Research Fund project of Zhengzhou University of Light Industry (Grant No.: 2020BSJJ020).
[1] Wang, X., Shi, T., Bai, W., Peng, K., Li, J., Shi, Y. (2022). The research of metaverse application in intelligent railway passenger station. In International Conference on Metaverse, Honolulu, HI, USA, pp. 111-117. https://doi.org/10.1007/978-3-031-23518-4_10
[2] Li, L., Wang, B., Liu, Z., Ni, S. (2023). Research on equipment management system of railway passenger station based on high-precision positioning. In Advances in Smart Vehicular Technology, Transportation, Communication and Applications: Proceedings of VTCA 2022, pp. 147-160. https://doi.org/10.1007/978-981-99-0848-6_11
[3] Liu, X., Fu, H. (2023). Simulation and optimization of inbound passenger flow line in large-scale railway station. In 3rd International Conference on Internet of Things and Smart City (IoTSC 2023), Chongqing, China, 127082A. https://doi.org/10.1117/12.2683895
[4] Borghetti, F., Longo, M., Mazzoncini, R., Somaschini, C., Cesarini, L., Contestabile, L. (2021). Relationship between railway stations and the territory: Case study in Lombardy - Italy for 15-min station. International Journal of Transport Development and Integration, 5(4): 367-378. https://doi.org/10.2495/TDI-V5-N4-367-378
[5] Mengisti, M., Gala, T., Birru, G. (2021). Environmentally conscious least cost multi-criteria decision making for modeling railway network for Eritrea. International Journal of Sustainable Development and Planning, 16(3): 427-436. https://doi.org/10.18280/ijsdp.160303
[6] Nam, S. (2020). A study on the development of path finding algorithm for passenger flow in railway station. International Journal of Transport Development and Integration, 4(4): 344-352. https://doi.org/10.2495/TDI-V4-N4-344-352
[7] Wang, B., Li, L., Ni, S., Chen, D. (2023). Research on equipment operation and maintenance management technology of large railway passenger station. In Advances in Smart Vehicular Technology, Transportation, Communication and Applications: Proceedings of VTCA 2022, pp. 67-77. https://doi.org/10.1007/978-981-99-0848-6_6
[8] Mutani, G., Todeschi, V. (2021). Roof-integrated green technologies, energy saving and outdoor thermal comfort: Insights from a case study in urban environment. International Journal of Sustainable Development and Planning, 16(1): 13-23. https://doi.org/10.18280/ijsdp.160102
[9] Liu, G., Cen, C., Zhang, Q., Liu, K., Dang, R. (2016). Field study on thermal comfort of passenger at high-speed railway station in transition season. Building and Environment, 108: 220-229. https://doi.org/10.1016/j.buildenv.2016.09.003
[10] Mutani, G., Todeschi, V., Beltramino, S. (2022). Improving outdoor thermal comfort in built environment assessing the impact of urban form and vegetation. International Journal of Heat and Technology, 40(1): 23-31. https://doi.org/10.18280/ijht.400104
[11] Sayad, B., Alkama, D., Rebhi, R., Kidar, A., Lorenzini, G., Ahmad, H., Menni, Y. (2021). Enhanced outdoor thermal comfort through natural design technique: In-situ measurement and microclimate simulation. Instrumentation Mesure Métrologie, 20(3): 131-136. https://doi.org/10.18280/i2m.200302
[12] Al-Kayiem, H.H., Mohammed, M.N., Kelly, K., Riyadi, T.W.B., Effendy, M. (2023). Experimental assessment and development of thermal comfort model for implication in tropical climate. International Journal of Computational Methods and Experimental Measurements, 11(1): 35-43. https://doi.org/10.18280/ijcmem.110105
[13] Reza, F., Kojima, S. (2020). Thermal comfort investigation based design considerations for the tropical studio type classroom. International Journal of Sustainable Development and Planning, 15(8): 1179-1185. https://doi.org/10.18280/ijsdp.150804
[14] Yuan, Y., Yue, H., Chen, H., Song, C., Liu, G. (2023). Passenger thermal comfort in the whole departure process of high-speed railway stations: A case study with thermal experience and metabolic rate changes in summer. Energy and Buildings, 291: 113105. https://doi.org/10.1016/j.enbuild.2023.113105
[15] Faraj, L., Ja’afar, M.F.Z.B., Shari, Z. (2023). Evaluating ventilation for thermal comfort in two classrooms types in Malaysian secondary classrooms. International Journal of Sustainable Development and Planning, 18(7): 2069-2078. https://doi.org/10.18280/ijsdp.180709
[16] Alam, M.S., Muthiah, A., Salve, U.R. (2020). Thermal comfort study in Indian railway pantry cars kitchen. Instrumentation Mesure Métrologie, 19(4): 289-295. https://doi.org/10.18280/i2m.190406
[17] Zang, X., Qian, Y., Qu, G., Yuan, Y., Ren, L., Liu, G. (2020). Defining the thermal sensitivity (Griffiths constant) of passengers at Chinese high-speed railway station in transition season. In 16th Conference of the International Society of Indoor Air Quality and Climate (Indoor Air 2020).
[18] Sun, X.B., Gu, H.Y., Tian, Y.F. (2023). Urban building thermal comfort research based on ArcGIS and building parameters: Analyzing and improving measures. International Journal of Heat and Technology, 41(2): 313-322. https://doi.org/10.18280/ijht.410204
[19] Ma, J., Deng, B., Qiao, X., Feng, L. (2015). Analysis of the cooling potential of a passenger lounge under natural ventilation in Northern China. Journal of Railway Engineering Society, 32(4): 96-101. https://doi.org/10.3969/j.issn.1006-2106.2015.04.019
[20] Deb, C., Ramachandraiah, A. (2010). Evaluation of thermal comfort in a rail terminal location in India. Building and Environment, 45(11): 2571-2580. https://doi.org/10.1016/j.buildenv.2010.05.023
[21] Cao, M., Li, Z., Zhao, X., Zhang, L., Duan, X. (2023). Heat deficit mitigation strategies for elevated rail stations in cold regions of China based on thermal comfort assessment. Building and Environment, 228: 109904. https://doi.org/10.1016/j.buildenv.2022.109904
[22] Yang, B., Yang, C., Ni, L., Wang, Y., Yao, Y. (2022). Investigation on thermal environment of subway stations in severe cold region of China: A case study in Harbin. Building and Environment, 212: 108761. https://doi.org/10.1016/j.buildenv.2022.108761
[23] Jia, X., Cao, B., Zhu, Y., Huang, Y. (2021). Field studies on thermal comfort of passengers in airport terminals and high-speed railway stations in summer. Building and Environment, 206: 108319. https://doi.org/10.1016/j.buildenv.2021.108319
[24] Ding, Y., Hou, Y. (2022). Analysis of indoor environment state characteristics of urban rail transit stations based on actual measurements in Chongqing, China. Energy and Buildings, 277: 112544. https://doi.org/10.1016/j.enbuild.2022.112544
[25] Song, H., He, Y. (2019). Experimental study on transportation Junction waiting space environmental comfort level in cold region. Journal of Harbin Engineering University, 40(4): 746-751. https://doi.org/10.11990/jheu.201810003
[26] Li, A., Ma, J., Cui, H., Zhang, X., Zhang, W., Guo, Y. (2020). Relative importance of certain factors affecting the thermal environment in subway stations based on field and orthogonal experiments. Sustainable Cities and Society, 56: 102107. https://doi.org/10.1016/j.scs.2020.102107
[27] Huang, M., Lin, Y. (2017). Thermal comfort of railway station’s waiting room in severe cold regions of China. Energy Procedia, 134: 749-756. https://doi.org/10.1016/j.egypro.2017.09.573
[28] Katavoutas, G., Assimakopoulos, M.N., Asimakopoulos, D.N. (2016). On the determination of the thermal comfort conditions of a metropolitan city underground railway. Science of the Total Environment, 566-567: 877-887. https://doi.org/10.1016/j.scitotenv.2016.05.047
[29] Wang, Y., Xia, X., Yan, R., Chang, Y., Hu, W.T., Zou, T. (2018). Numerical analysis on velocity and temperature profiles in the compartment of a running plateau train in winter. Tiedao Xuebao/Journal of the China Railway Society, 40(5): 38-44. https://doi.org/10.3969/j.issn.1001-8360.2018.05.006
[30] Yu, L., Yu, L., Ma, W., He, L., Li, L., Zhang, Y., Zhang, L. (2015). Optimization of radiation floor system and stratified air conditioning system in winter heating mode at passenger railway station. Journal of Central South University (Science and Technology), 46(5): 1900-1908. https://doi.org/10.11817/j.issn.1672-7207.2015.05.044