Mustaza Ma’a![]() | Indro Pranoto*
| Indro Pranoto*![]() | Samsul Kamal
| Samsul Kamal
© 2023 IIETA. This article is published by IIETA and is licensed under the CC BY 4.0 license (http://creativecommons.org/licenses/by/4.0/).
OPEN ACCESS
The efficiency of various industrial processes is contingent upon the heat transfer enhancement and fluid flow dynamics within horizontal annular heat exchangers. This study, therefore, investigates these factors, utilizing a heater with the capacity to vary between 400 W and 600 W, connected to an alternating current (AC) voltage regulator. Cold water, with flow rates ranging from 2.5 to 5 gallons per minute (GPM), circulates in a closed-loop system. The central objectives of this research are to elucidate the heat transfer characteristics, including heat transfer coefficient, Nusselt number, friction factor, and flow regime, and to derive a new empirical correlation for the Nusselt number (Nu) and the friction factor (f) within a horizontal annular heat exchanger incorporating a central tubular heater. The experimental evidence demonstrates an increase in the heat transfer coefficient (h) and the Nusselt number (Nu) with the rise in Reynolds number (Re). The peak heat transfer coefficient was observed at a heat rate of 450 W, commencing at 1893 W/m2·K when Re=4813 and reaching a maximum of 3886 W/m2·K when Re=10127. Additionally, the mean Nusselt number (Nu) was found to range between 89 at Re=4813 and 183 at Re=10127. Conversely, the friction factor (f) decreased as the Reynolds number (Re) increased. The transition from a laminar to a transitional flow regime was observed at Re=8000. The empirical correlations derived from this study were $N u=0.145 R e^{0.671} \mathrm{Pr}^{0.4}$ and $f=$ $1.4219 R e^{-0.277}$ with mean absolute percentage errors (MAPEs) of $10.64 \%$ and $25.70 \%$, respectively. These findings have the potential to significantly enhance the performance of horizontal annular heat exchangers in various industrial applications.
heat transfer characteristics, heat transfer enhancement, Nusselt number, friction factor, annular heat exchanger, tubular heater
Investigating heat transfer characteristics within annular heat exchangers constitutes a crucial pillar of thermal engineering research. Horizontal annular heat exchangers, devices facilitating heat transfer between two fluids, hold a ubiquitous presence across a myriad of industrial sectors, including power generation, chemical processing, oil and gas exploration, HVAC systems and efficiency of energy [1-3]. The architecture of these exchangers comprises an inner shell that houses the heater and an outer shell that accommodates the cold fluid, establishing a critical thermal gradient [4].
Among the key parameters that govern the heat transfer and fluid flow dynamics within these exchangers is the Reynolds number [5]. This dimensionless entity quantifies the significance of inertial and viscous forces within a fluid. Notably, the Reynolds number, acting as a barometer of fluid turbulence, plays a pivotal role in modulating the heat transfer rate or the heat transfer coefficient from the cold fluid [6]. Moreover, the aspect ratio, defined as the ratio of slit width to the inner shell diameter, is another salient factor influencing heat transfer and flow dynamics within annular heat exchangers [7]. The aspect ratio profoundly affects the flow patterns and turbulence within the annulus, thereby directly impacting the heat transfer coefficient [8].
In the realm of heat exchangers, the horizontal annular variety stands as a compact and efficient archetype, extensively employed across a wide array of industries such as power generation, chemical processing, and oil and gas exploration. The performance of these heat exchangers is inherently influenced by several key factors, notably fluid properties, annulus geometry, flow rates, and patterns of fluid flow [9]. A salient feature of a horizontal annular heat exchanger is the heat transfer mechanism that unfolds within the annulus. In this setup, cold fluid traverses the annulus, while a heater is strategically positioned at the core of the concentric cylinders. The rate of heat transfer in this apparatus is subject to numerous variables including the temperature disparity between the heater surface and the inlet and outlet of the cold fluids, the heat transfer coefficient, the fluid flow rate, and the effective surface area available for heat transfer.
The heat transfer coefficient, a pivotal metric of heat transfer efficiency, is modulated by multiple parameters. Paramount among these are fluid properties, fluid flow patterns, and the roughness of the annulus surface [9]. Fluid attributes such as viscosity, density, and thermal conductivity can exert influence on the heat transfer coefficients by altering fluid flow patterns and the degree of fluid mixing [10].
Flow parameters within annular heat exchangers significantly dictate system performance [11]. The annulus geometry, encompassing its width, length, and shape, influences the flow patterns, pressure drop, and heat transfer coefficient. An elevated fluid flow rate can enhance the Reynolds number, leading to a more turbulent flow and a higher heat transfer coefficient [12].
At lower Reynolds numbers, the fluid flow remains laminar, characterized by smooth, regular movement with minimal turbulence. Here, the dominant viscous forces in the fluid result in suboptimal fluid mixing, resulting in a lower heat transfer coefficient and thus, a lower Nusselt number [13].
However, as the Reynolds number escalates, the fluid flow becomes more turbulent, characterized by chaotic and irregular movement with significant mixing and turbulence. This turbulent flow regime sees an increase in the heat transfer coefficient due to several reasons. Firstly, turbulence creates eddies and vortices that enhance fluid-to-fluid and fluid-to-wall contact, leading to more efficient heat transfer. Secondly, turbulence facilitates fluid mixing, resulting in a more uniform temperature distribution, reduced thermal gradients, and an increased overall heat transfer rate [14]. In conclusion, the relationship between the Reynolds number and the Nusselt number is critical to understanding the heat transfer characteristics of fluids in various applications and for optimizing the design of heat transfer systems. As the Reynolds number increases, a more turbulent fluid flow is observed, leading to increased mixing, a higher velocity gradient, and consequently, a higher convection heat transfer coefficient and Nusselt number.
2.1 Setup of apparatus
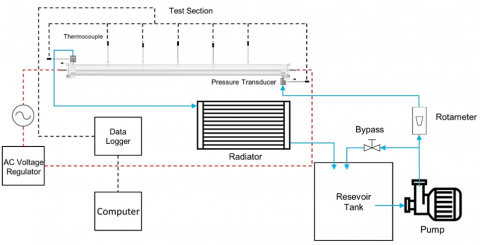
In the test section, there is a heater that is utilized to generate heat running water alongside the test rig. In this experiment employs a tubular heater. It is coupled to the Voltage Regulator to achieve heat variation. A display shows the wattage consumed by the heater. A pressure transducer is also built in the test rig to monitor the pressure decrease during the study. Seven thermocouples are implemented in the test section, with two placed at both the inlet and the outlet specimen. The remaining 5 thermocouples are implanted on the testing rig. Thermocouples serve as instruments that measure temperature at the entry and exit points of a system, in addition to the surface temperature at five different places throughout the test segment. A data logger is utilized to capture experimental results and connect it to a computer to store the findings.
As shown in Figure 1, the research was conducted using the experiment apparatus. Using a closed - cycle pump, this experimental setup delivers a tank of water to the test rig. Fluid moves thru a rotameter, that's utilized to quantify water flow. To regulate the flow of water back to the reservoir tank, a bypass valve is used. Water enters the annulus of the specimen through the inlet and leaves via the exit. Afterward discarding the exit, the cold fluid gets back to the water tank utilizing chillers, as an instance a fan and radiator.
To keep the hot water cool getting passed thru the heater, a cooling setup consists of a radiator and a fan has been used. A tubular heater was employed to heat the working fluid inside the test section's center. To accomplish the required heat variance, a Voltage Regulator hooked up to both end points of the tubular heater is turned on. A screen displays the current, voltage, power, and power-factor values obtained from the investigation.
A water pump for a shallow well with a maximal capacity of 24 liters/min and a maximal head specs of 33 meters is utilized to deplete the reservoir tank's water to the specimen and then return to the reservoir tank via the radiator. An H2O Omega rotameter with a capacity of from 0.5 to five GPM serves to determine the rate of flow.
The temperature sensor which used detect the heat in this investigation is 7-unit type K thermocouples. The thermocouples, which range in size at 18 cm, 34 cm, 50 cm, 66 cm, and 82 cm from the inlet, are installed at the entrance and exit locations, as well as 5 spots along the tubular heater. These thermocouples are employed to measure the outer wall of heater surface temperature. Autonics PSAN-C01CV pressure transducer is utilized for measuring pressure. The intent is to figure out how much pressure loss in the horizontal annular heat exchanger. Throughout the experiment, to record data, a data logger GL820 Graphtec midi logger had been utilized. This was linked to a computer in order to save all experimental data.
Figure 1. The test rig’s schematic diagram
Table 1 shows the detailed dimensions of the specimen. In the test section, a 1000 mm horizontal annular heat exchanger is employed. A clear Plexiglas pipe with an inner diameter of 40 mm and an outer diameter of 50 mm was used in the test section. A cooper heater with an 11 mm diameter is installed in the pipe's centerline. This heater can produce up to 700 W of power at 220 V.
Table 1. Test section’s dimensions
|
No. |
Component |
Dimensions (mm) |
|
1. |
The outer pipe's length |
1000 |
|
2. |
The outer pipe's inside diameter |
40 |
|
3. |
The outer pipe's outside diameter |
50 |
|
4. |
Length of the heater |
1010 |
|
5. |
Diameter of the heater |
12 |
The Omega rotameter has flow rates from 2.5 GPM to 5 GPM with six flow variant to examine the characteristics of flow and heat transfer that occur on the horizontal annular heat exchanger. The bypass valve is twisted to achieve this variation in order to carry out these six flow variations. Meanwhile, 5 heat variations were performed to determine the impact of the heat provided in this investigation by setting the AC Voltage Regulator to 400, 450, 500, 550, and 600 W. A wattmeter displays a variety of variables such as power, current, voltage, and power-factor.
2.2 Procedure for experimentation
The experiment began with the pump being turned on. The device is activated to analyze the state of the experimental setup's leak and the water coolant in a closed loop system. The instrument is calibrated after ensuring that the entire experimental apparatus has no leaks.
The flow is calibrated by comparing 4 Qread data on rotameter Omega to the Qactual from the flow accommodated in the measurement glass. In the meantime, thermocouple calibration is performed by comparing 7 type K thermocouples to standard thermometer at 6 different temperatures. The pressure sensor, on the other hand, is calibrated under static conditions by comparing the reading pressure to the static pressure on the vertical manometer.
The test in this study is concerned with the heater is in simple tube situations. This would be the situation which the heater is really in a straightforward state that does not require outsert as a flow repellent, causing it to become turbulent. All information is maintained in a steady-state state.
In this investigation, the average temperature gained from equation reveals working fluid’s properties in this test.
$T_{m, f}=\frac{T_{f, i}+T_{f, o}}{2}$ (1)
The equation achieves the surface temperature of the heater.
$\bar{T}_s=\frac{\sum T_{s, n}}{n}$ (2)
The rate of mass flow may be calculated by employing the formula.
$\dot{m}=\dot{V} \times \rho$ (3)
The equation is used to calculate the Reynolds number.
$R e=\frac{\rho v D_h}{\mu}$ (4)
The rate of heat may be calculated by employing the formula.
$q=\dot{m} c_p\left(T_{\text {in }}-T_{\text {out }}\right)$ (5)
The convection coefficient of heat transfer (h) may be calculated with applying the formula.
$h=\frac{q}{A\left(T_s-T_f\right)}$ (6)
Furthermore, the equation obtains the Nusselt number (Nu) value.
$N u=\frac{h D_h}{k}$ (7)
This study's calculations relied on uncertainty analysis. Using experimental data, the uncertainty value for the Reynolds number is 0.97 percent. The Nusselt number value is uncertain by 1.26%. And the amount of uncertainty for the friction factor obtained is 1.42%. From several experiments carried out, the standard deviation value was 3.22 so that a repeatability value of 3.49% was obtained.
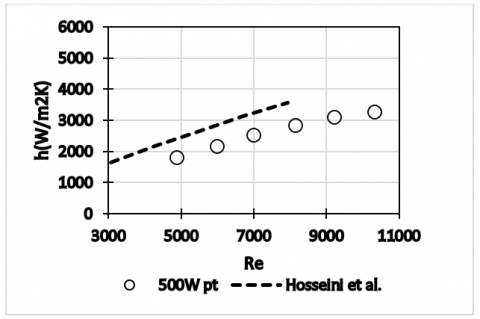
The experiment findings revealed that the convection coefficient of heat transfer (h) rises as the Reynolds number increased. Figure 2 depicts the experiment findings for average heat transfer convection coefficient (h) at 500 W heat rate. This investigation's findings were indeed matched to Hosseini et al. [15]. Hosseini's study's coefficient convection of average heat transfer (h) revealed the same issue. When the Reynolds number rises, so does the value.
The increase in the Reynolds number was induced by an increase in fluid flow rate fluctuations from 2.5 GPM to 5 GPM. As the flow rate increases, so does the Reynolds number. The velocity of the fluid flow increases as the flow increases. This is because the flow crosses the flow cross section more frequently. As a result, increasing the flow increases the Reynolds number.
Furthermore, increasing flow causes the fluid to travel more rapidly on the surface. As a result, fluids in contact with the surface flow and mix more freely, boosting heat transfer. Because the fluid moves faster, it has less time to come into touch with the surface, which reduces the time it takes for the fluid to absorb heat. This allows a large amount of new, cold fluid to flow across the surface. With a faster flow, the heated fluid can be replaced instantly by a new fluid with a large temperature difference between the fluid and the surface. This leads in improved heat transfer and efficiency.
Apart from that, it is also due to the influence of the tubular heater's design, where the heat comes from both ends and collects in the middle of the heater. The Reynolds number rises, then the average Ts temperature distribution decreases. While the Reynolds number increases, the average temperature Tm increase. When the Reynolds number increases, the temperature delta Ts to Tm falls, affecting to heat transfer outcome and increasing the average convection coefficient (h).
Figure 2. Heat transfer coefficient compare to other research
Moreover, it significantly increased at the beginning and then decreased after Re=8000. The difference between these two tests is in the flow velocities measured and the ensuing trends. Hosseini's experiments were conducted at Re=3000 to 8000. While this experiment was conducted from Re=5000 to 10,000. Other differences can be seen from the results of the Hosseini experimental, which show an increasing trend in convection heat transfer coefficient (h), where on average is more linear. Nevertheless, the conclusion of this experiment suggests continued growth at the start. However, after reaching Re=8000 the line leveled off more.
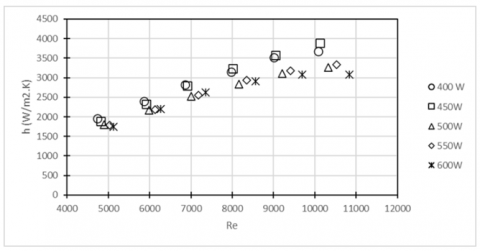
Figure 3. Heat transfer coefficient with rate of heat variant
Figure 3 depicts the overall test results, which displays convection heat transfer coefficient (h) average from all rate of heat variants. The figure describes the variations in heat rate starting from 400, 450, 500, 550, and 600 W. The investigational results indicate that the coefficient convection of average heat transfer (h) achieves the greatest value for the 450 W heat rate variation when compared to the other heat rate variations. However, the coefficient convection of average heat transfer (h) value in the heat rate variant of 600 W is lower than in the other heat rate variations.
None of the test results revealed an increase in heat rate variations, which could lead to a rise in the average coefficient for convection heat transfer (h). According to the experiment results, there was an increase in the variation of the flow rate, indicating an increase in coefficient of average convection heat transfer (h). For a heat rate variation of 450 W, the test results produced the greatest average coefficient for convection heat transfer (h), starting at 1893 W/m2·K at Re=4813 and reaching a maximum of 3886 W/m2·K at Re=10127. Furthermore, the convection heat transfer coefficient (h) averaged from 1954 W/m2·K on Re=4734, which occurred at a heat rate variation of 400 W, up to 3671 W/m2·K on Re=10078, followed by the average coefficient for convection heat transfer (h) value, with average begin at 1783 W/m2·K at Re=5023, which occurs at a heat rate variant of 550 W, and end at 3335 W/m2·K at Re=10532.
At 500 W heat rate variation, the findings of the experiments reveal that the average convection heat transfer coefficient (h) starts at 1806 W/m2·K on Re=4889 and reaches 3261 W/m2·K on Re=10323. Meanwhile, for rate of heat variant of 600 W, convection heat transfer coefficient (h) average value ranges from 1747 W/m2·K for Re=5120 to 3077 W/m2·K for Re=10838.
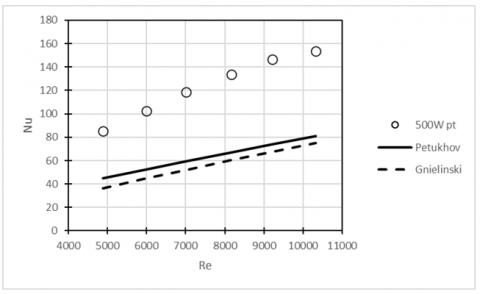
The experiment's findings indicate the value of Nusselt number (Nu) average generated at heat rate variant of 500 W shows in Figure 4. This graph demonstrates based on the results of the experiment, it is well known that Nusselt number (Nu) average rises as the Reynolds number rises. The experiment's findings are compared to empirical correlation results, which are frequently used by other researchers. All of the average Nusselt number (Nu) experimental observations are validated by Petukhov and Gnielinski correlations.
$N u=\frac{(f / 8) R_e P_r}{1.07+12.7(f / 8)^{1 / 2}\left(P_r{ }^{2 / 3}-1\right)}$ (8)
where, $f=\left(0.790 \ln \mathrm{R}_{\mathrm{e}}-1.64\right)^{-2}$, and $3000 \leq R_e \leq 5 \times$ $10^6$.
$N u=\frac{(f / 8)\left(R_e-1000\right) P_r}{1+12.7(f / 8)^{1 / 2}\left(P_r^{2 / 3}-1\right)}$ (9)
Figure 4. Nusselt number average with other correlation
Increase in Nusselt number (Nu) average as a consequence of this experiment, as well as rises in convection heat transfer coefficient (h) average, may be related to the influenced distribution of velocity that occurs inside the boundary. Boundary layer affected by the speed distribution recorded during the experiment. The shape of the border layer raises the Nusselt number (Nu) average, as seen in Figure 4. The average value of the Nusselt number (Nu) in the Petukhov and Gnielinski correlations demonstrates the same tendency. The Nusselt number (Nu) average of the Petukhov and Gnielinski correlations rises as the Reynolds number rises.
The fluid will move more vigorously on the surface as the flow increases. As a result, fluids in contact with the surface flow and mix without restriction, enhancing heat transfer. Because the fluid flows faster, it requires fewer moments to get into contact with the surface, thereby decreasing the duration that required for the fluid to absorb heat. This enables an enormous quantity of new, cold fluid to flow across the surface. With a faster flow, the heated fluid can be replaced instantly by a new fluid with a large temperature difference between the fluid and the surface. This leads in enhanced heat transfer and efficiency.
However, as described in the prior convection heat transfer coefficient (h) average experimental results, discrepancies in experimental observations on the Nusselt number (Nu) average is found in upward trend produced by experiments and empirical correlations, which have a distinct pattern. The upward trend in terms of empirical correlation is closer to a linear trend but not a significant one, while the increasing trend on the Nusselt number (Nu) average of the experimental results has a different trend. That is, it experienced a significant increase from the start and then more sloping after Re=8000.
According to the findings of this study, the resulting Nu value increased more dramatically than the results of empirical correlation, and it even tends to increase with increasing Reynolds number. This is possible because the experimental conditions differ. It could be because of the various flow geometries, surface sizes, and so on. The effect of the Reynolds number range entering the transition domain from laminar to turbulent is another factor that allows for large variances. A modest change in the Reynolds number can result in a considerable change in the convection heat transfer coefficient under these conditions. Transitional regimes can also result in more complicated flow and mixing patterns. All of this contributes significantly to an increase in the convection heat transfer coefficient.
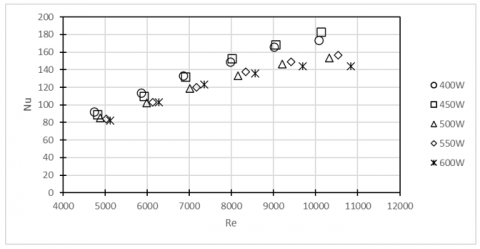
Figure 5. Nusselt number with variant of heat rate
The Nusselt number (Nu) average value's overall result with different heat rate variant can be displayed in Figure 5. The rise of the Nusselt number (Nu) average follows the same pattern for all heat rate variations. From the test results, nothing showed an increase in heat rate variations resulting a rise in the Nusselt number (Nu) average. As a result of this research, it was also discovered that as flow rate variations increased, so did the Nusselt number (Nu). Heat rate variation of 450 W produces the highest Nusselt number (Nu) average value, with Nu values ranging from 89 at Re=4813 to 183 at Re=10127. Furthermore, Nusselt number (Nu) value on average resulted from a 400 W rate of heat variant, starting from 92 at Re=4734 to 173 at Re=10078, followed by Nusselt number (Nu) value on average resulting from a 550 W rate of heat variant, starting at 83 in Re=5023 and reaching 156 in Re=10532.
For the 500 W heat rate variation, the test results show that the average Nusselt number (Nu) value starts at 85 at Re 4889 and reaches 153 at Re=10323. Meanwhile, the lowest Nusselt number (Nu) value on average is obtained from the 600 W heat rate variant, which scores from 81 for Re=5120 to 144 for Re=10838. In the rate of heat, there is a deflection and a variation in the growth in Nusselt number (Nu) average among complete variants. The particular findings point to a flow conversion from a laminar to a transitional regime with various crucial junctures but above Re=8000.
The transition critical point begins at Re=9047 for rate of heat variant 450 W. Meanwhile, at a 400 W heat rate variance, the transition critical point begins at Re=9006. The transition critical point begins at a Reynolds number greater than the rate of heat variant 400 W and 450 W, namely on the Re=9211. Likewise, larger variations in heat rate, including at heat rate of 550 W and 600 W, acquire crucial transition points starting from Re that are more significant, at the Reynolds number of 9416 and 9687. According to these findings, the more the variance in heat rate, the higher the critical point Reynolds number for transition.
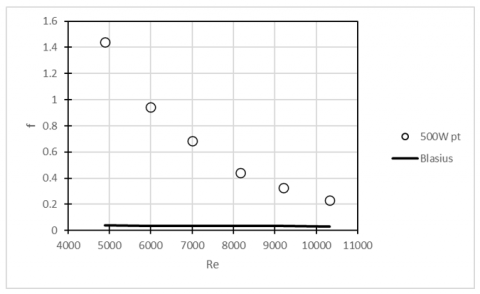
Figure 6. Friction factor with empirical correlation
The results of the experiments showing the average value of the friction factor (f) generated at a heat rate variant of 500 W as illustrated in Figure 6. This graph shows that, based on the results of the tests, friction factor (f) value reduces along with Reynolds number increase. The findings were compared to empirical correlation results, which are frequently used by other researchers. Specifically, the Blasius correlation where in the Blasius correlation, the resulting average friction factor (f) value shows the same trend. The average friction factor (f) value of the Blasius correlation decreases along with Reynolds number increase.
Disparity in friction factor (f) experimental and empirical results is due to the decreasing trend of the experimental and empirical correlations. The decreasing trend in the empirical correlation is closer to a linear decreasing trend but not significant, whereas the decreasing trend in the average friction factor (f) experimental findings is more pronounced. This is due to changes in fluid flow that occur as the Reynolds number increases, transitioning from the laminar to the transition regime. When the flow transitions, the mixing of the fluids becomes more intense, and random fluid movements might break the layers, resulting in thinning. Friction between the fluid and the surface is reduced as a result. As a result, the value of the friction factor (f) decreases. Furthermore, because the resulting inertia force is greater than that of laminar conditions, it can reduce flow friction.
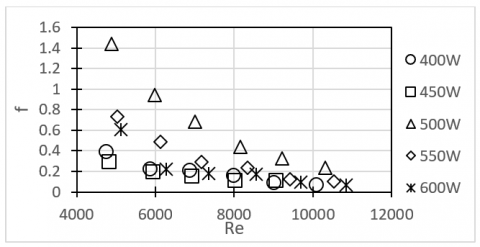
The average friction factor (f) across all heat rate variations used is depict in Figure 7. According to the results of the friction factor (f) obtained from the experiment, the value of friction factor (f) reduces along with Reynolds number increase. The friction factor (f) with the highest value is obtained at a heat rate of 500 W, which starts at 1.439 at Re=4889 and then decreases with increasing Reynolds number. Until it reaches a value of 0.232 at Re=10323.
Figure 7. Friction factor with heat rate variation
The friction factor (f) is then calculated at a heat rate of 550 W with a value of 0.728 at Re=5023. When Reynolds number increase, the value of the friction (f) decreases. As a result, friction factor (f) in an output of 0.098 at Re=10532. At a heat rate of 600 W, the friction factor (f) generated with in experiment starts at 0.608 at Re=5120. When the Reynolds number increases, the friction factor (f) drops, reaching an output of 0.068 at Re=10838.
The next friction factor (f) value is at a heat rate of 400 W. From the experimental results, the friction factor (f) value is 0.398 at Re=4734. Then this value decreases as the Reynolds number increases and ends at a value of 0.074 at Re=10078. Finally, the smallest friction factor (f) value is shown at a heat rate of 450 W, where, from the experimental results, the friction factor (f) value is 0.301 at Re=4813. This value decreases as the Reynolds number increases. As a result, it reaches a value of 0.068 at Re=10127.
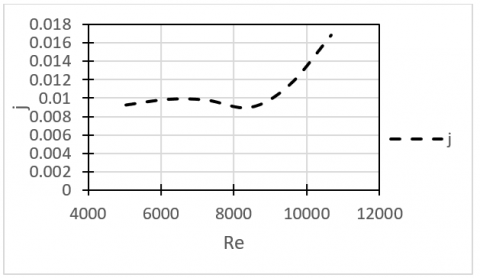
The trend of the experiment results indicates a deflection. According to Everts and Meyer [16], the results of the experiment identify laminar and transition flow regimes. Critical point transition starts at Re=8000. This critical point can also be seen more clearly in Figure 8. In the picture, there are test results showing the value of the Colburn-j factor (j). The Colburn-j factor (j) indicates that the laminar flow regime ends at Re=8000 and the transitional flow regime begins at the Reynolds number [17].
Flow regime have significant impact for heat transfer and friction factor. In the laminar regime flow has lower heat transfer convection. Heat transfer govern by conduction and occurs in thin thermal boundary layers near the surface. In turbulent regime flow has significant heat transfer convection. The flow mix and have better thermal contact between fluid and surface because of higher velocity gradient. For the friction turbulent regime associated with higher friction.
Based on the results of experiments on plain tube conditions, an empirical correlation has been developed to calculate the Nusselt number (Nu) and friction factor (f) values. Empirical correlations are derived based on non-dimensional parameters, which are usually used in dimensional analysis to suggest the Nusselt number (Nu) and friction factor (f) in horizontal annular heat exchangers.
The proposed empirical correlation is based on the experimental research conditions as follows:
(1) The working fluid used is water.
(2) The Reynolds number used ranges from 4000 to 10000.
(3) A heater is used in plain tube conditions.
The empirical correlation proposed in this study, which is used to predict the Nusselt number (Nu) is stated as follows:
$N u=0.145 R e^{0.671} P r^{0.4}$ (10)
Figure 8. Laminar and transition flow regime
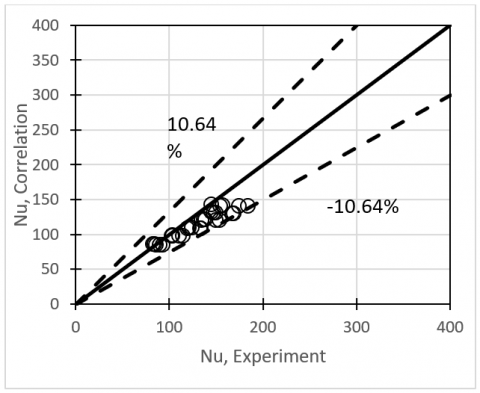
The Nusselt number (Nu) value obtained from the experimental results, Nuexp, is compared with the Nusselt number (Nu) value predicted by empirical correlation, Nucorr, as shown in Figure 9. From the figure, it is plain to see that there is a difference between Nusselt number experiment (Nuexp) value and the Nusselt number correlation (Nucorr) value, where there is a deviation using the mean average percentage error (MAPE) of 10.64% between the experimental (Nuexp) and correlation (Nucorr) Nusselt number values.
Figure 9. Nu values from the correlation and experiment
The same condition also occurs in the friction factor (f). From the experimental results, the development of an empirical correlation for the friction factor (f) was carried out. Based on the experimental conditions above, there is an empirical correlation proposed in this study that is used to predict the friction factor (f) based on equation (5.64), which is stated as follows:
$f=1.4219 R e^{-0.277}$ (11)
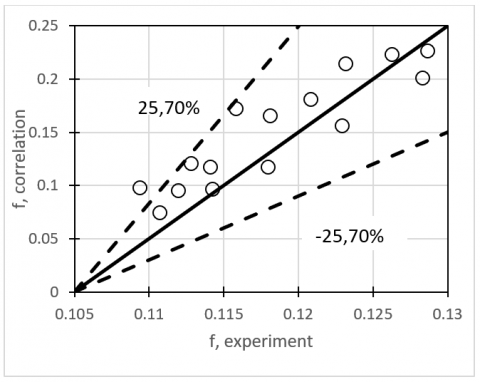
The value of the friction factor (f) obtained from the experimental results, fexp, is compared with the value of the friction factor (f) predicted by the empirical correlation, fcorr, shown in Figure 10. From the figure, it can be clearly seen that there is a difference between the experimental friction factor (fexp) value and the correlation friction factor (fcorr) value, where there is a deviation using the mean average percentage error (MAPE) of 25.70% between the experimental friction factor value (fexp) and the friction factor correlation value (fcorr).
The value of uncertainty has a significant impact on measurement outcomes, data analysis, and empirical correlation. This entails evaluating the possibility for error and variability associated with a study's data, calculations, and assumptions. The high level of uncertainty on the pressure sensor implies that the MAPE results on the friction factor correlation are significantly bigger in the error value. The uncertainty numbers on the rotameter and thermocouple are likewise substantially lower, showing that the MAPE results at the Nusselt correlation have a tiny mistake.
Figure 10. f values of f from the experiment and correlation
In this paper, the experiment described heat transfer characteristics in horizontal annular heat exchanger with central tubular heater. The experiment findings reveal that when Reynolds number rises, it also rises convection coefficient of heat transfer (h) average. Consequently, when Reynolds number rise, it also rises Nusselt number (Nu) average. The test findings revealed the greatest convection heat transfer coefficient (h) average for 450 W heat rate variation, starting at 1893 W/m2·K at Re=4813 and reaching a maximum of 3886 W/m2·K at Re=10127. Heat rate variation of 450 W produces the highest Nusselt number (Nu) average value, with Nu values ranging from 89 at Re=4813 to 183 at Re=10127. However, the average friction factor (f) value reduces as the Reynolds number rises. The results on this experiment indicate flow conditions in the laminar flow regime ends at Re=8000 and the transitional flow regime begins at the Reynolds number. The empirical correlation proposed for Nusselt number in this study is $N u=0.145 R e^{0.671} \operatorname{Pr}^{0.4}$ with 10.64% in MAPE. Meanwhile, the empirical correlation proposed for friction number is $f=1.4219 R e^{-0.277}$ with 25.70% in MAPE This experiment provides an understanding of how heat transfer occurs in a horizontal annular heat exchanger with central tubular heater. The experiment produced the proposed new correlations Nu and f, which can be used in the future as empirical correlation calculations to construct a horizontal annular heat exchanger with central tubular heater in the industrial sector. As a scientific contribution, this novel correlation Nu and f was discovered, particularly in the horizontal annular heat exchanger with central tubular heater. When the experimental results obtained later with this experiment are compared, it is clear that there is room for further research to enhance heat transfer in the horizontal annular heat exchanger with central tubular heater.
This research is funded by Research grant of Doctoral Dissertation Research (PDD) 2023 from Ministry of Education, Culture, Research, and Technology Indonesia with contract number: 3839/UN1/DITLIT/Dit-Lit/PT.01.03/2023 and Domestic Postgraduate Education Scholarship (BPPDN) number: B/67/D.D3.KD.02.00/2019. All contributors would want to express their gratitude to the Heat and Mass Transfer Lab team members and employees from Universitas Gadjah Mada's Department of Mechanical and Industrial Engineering. This study was conducted as part of the Universitas Gadjah Mada's Doctoral Program in Mechanical Engineering.
|
T |
temperature, ℃ |
|
Re |
Reynolds number |
|
D |
diameter, m |
|
Cp |
specific heat, J/kg·K |
|
q |
heat rate, W |
|
h k |
heat transfer coefficient, W/m2·K thermal conductivity, W/m·K |
|
Nu |
Nusselt number |
|
A |
area, m2 |
|
f |
friction factor |
|
Pr |
Prandtl number |
|
v |
flow velocity, m/s |
|
Greek symbols |
|
|
$\rho$ |
mass density of fluid, kg/m3 |
|
$\dot{m}$ |
mass flow rate, kg/s |
|
$\dot{V}$ |
volume flow rate, m3/s |
|
µ |
dynamic viscosity, kg/m·s |
|
Subscripts |
|
|
s |
surface |
|
f |
fluid (aquadest) |
|
h |
hydraulic |
[1] Maa, M. (2015). Distribusi koefisien perpindahan panas konveksi daerah entrance dan fully developed perbandingan empiris dan eksperimen pada double pipe heat exchanger. Jurnal Elektro dan Mesin Terapan, 1(2): 20-28. https://doi.org/10.35143/elementer.v1i2.30
[2] Prinsloo, F.P., Dirker, J., Meyer, J.P. (2018). Heat transfer direction dependence of heat transfer coefficients in annuli. Heat and Mass Transfer, 54: 1145-1161. https://doi.org/10.1007/s00231-017-2212-3
[3] Aly, W.I. (2014). Numerical study on turbulent heat transfer and pressure drop of nanofluid in coiled tube-in-tube heat exchangers. Energy Conversion and Management, 79: 304-316. http://doi.org/10.1016/j.enconman.2013.12.031
[4] Pachegaonkar, S.S., Taji, S.G., Sane, N. (2014). Performance analysis of double pipe heat exchanger with annular twisted tape insert. International Journal of Engineering and Advanced Technology (IJEAT), 3(3): 402-406.
[5] Sheikholeslami, M., Gorji-Bandpy, M., Ganji, D.D. (2016). Effect of discontinuous helical turbulators on heat transfer characteristics of double pipe water to air heat exchanger. Energy Conversion and Management, 118: 75-87. http://doi.org/10.1016/j.enconman.2016.03.080
[6] Pachegaonkar, S.S., Taji, S.G., Sane, N. (2014). Performance analysis of double pipe heat exchanger with annular twisted tape insert. International Journal of Engineering and Advanced Technology (IJEAT), 3(3): 402-406.
[7] Sheikholeslami, M., Gorji-Bandpy, M., Ganji, D.D. (2016). Effect of discontinuous helical turbulators on heat transfer characteristics of double pipe water to air heat exchanger. Energy Conversion and Management, 118: 75-87. http://doi.org/10.1016/j.enconman.2016.03.080
[8] Nabil, R., Sabri, A. (2022). A review on the modification of circular fin and tube heat exchangers through new innovative fin shapes. International Journal of Advanced Technology and Engineering Exploration, 9(93): 1222-1245. http://doi.org/10.19101/IJATEE.2021.875888
[9] Tavousi, E., Perera, N., Flynn, D., Hasan, R. (2023). Heat transfer and fluid flow characteristics of the passive method in double tube heat exchangers: A critical review. International Journal of Thermofluids, 17: 100282. https://doi.org/10.1016/j.ijft.2023.100282
[10] Qian, S., Lou, S., Ge, C., Wang, W., Tian, X., Cai, Y. (2022). The influence of temperature dependent fluid properties on topology optimization of conjugate heat transfer. International Journal of Thermal Sciences, 173: 107424. https://doi.org/10.1016/j.ijthermalsci.2021.107424
[11] Shirvan, K.M., Ellahi, R., Mirzakhanlari, S., Mamourian, M. (2016). Enhancement of heat transfer and heat exchanger effectiveness in a double pipe heat exchanger filled with porous media: Numerical simulation and sensitivity analysis of turbulent fluid flow. Applied Thermal Engineering, 109: 761-774. https://doi.org/10.1016/j.applthermaleng.2016.08.116
[12] Ma’a, M., Rohmat, T.A., Kamal, S. (2020). Current studies of heat transfer enhancement on double pipe heat exchanger. AIP Conference Proceedings, 2248(1): 050006. https://doi.org/10.1063/5.0013350
[13] Bashir, A.I., Everts, M., Bennacer, R., Meyer, J.P. (2019). Single-phase forced convection heat transfer and pressure drop in circular tubes in the laminar and transitional flow regimes. Experimental Thermal and Fluid Science, 109: 109891. https://doi.org/10.1016/j.expthermflusci.2019.109891
[14] Meyer, J.P., Everts, M., Hall, A.T., Mulock-Houwer, F.A., Joubert, M., Pallent, L.M., Vause, E.S. (2018). Inlet tube spacing and protrusion inlet effects on multiple circular tubes in the laminar, transitional and turbulent flow regimes. International Journal of Heat and Mass Transfer, 118: 257-274. https://doi.org/10.1016/j.ijheatmasstransfer.2017.10.125
[15] Hosseini, M., Sadri, R., Kazi, S.N., Bagheri, S., Zubir, N., Bee Teng, C., Zaharinie, T. (2017). Experimental study on heat transfer and thermo-physical properties of covalently functionalized carbon nanotubes nanofluids in an annular heat exchanger: A green and novel synthesis. Energy & Fuels, 31(5): 5635-5644. https://doi.org/10.1021/acs.energyfuels.6b02928
[16] Everts, M., Meyer, J.P. (2018). Heat transfer of developing and fully developed flow in smooth horizontal tubes in the transitional flow regime. International Journal of Heat and Mass Transfer, 117: 1331-1351. https://doi.org/10.1016/j.ijheatmasstransfer.2017.10.071
[17] Ma’a, M., Pranoto, I., Kamal, S. (2022). The phenomenon of flow and heat transfer in annular heat exchanger on plain tube condition. Journal of Advanced Research in Fluid Mechanics and Thermal Sciences, 100(2): 146-156. https://doi.org/10.37934/arfmts.100.2.146156