Peng Li![]() | Yanli Ran*
| Yanli Ran*![]() | Xiumei Li
| Xiumei Li![]() | Ze Han
| Ze Han![]() | Yue Zhang
| Yue Zhang![]() | Liyong Zhang
| Liyong Zhang![]() | Zhijun Du
| Zhijun Du![]() | Xinmiao Wu
| Xinmiao Wu![]()
© 2023 IIETA. This article is published by IIETA and is licensed under the CC BY 4.0 license (http://creativecommons.org/licenses/by/4.0/).
OPEN ACCESS
With intensifying global climate change and human activities, small-to-medium river ecosystems in the northern area of China are confronted with unparalleled thermal stress challenges. These rivers play a pivotal role in regional ecological balance, water resource provision, and biodiversity conservation. Although extant studies have addressed ecological restoration of rivers, most methodologies have predominantly focused on ecological responses under single-factor influences, overlooking the intricate coupling of multiple factors. Furthermore, exploration concerning the central role of biological activity and bio-regulation in thermal adaptability remains inadequate. This study aims to meticulously analyze the thermal equilibrium status of river ecosystems in northern China and proposes an optimized ecological restoration decision-making approach that considers multi-factor coupling. By assessing microbial activity indicators, conducting thermal equilibrium and bio-regulation analyses, and introducing a comprehensive decision-making framework, this research offers a scientific, systematic, and feasible strategy for the ecological restoration of small-to-medium rivers in northern China, serving also as a reference for parameter determination in wheat-corn Subsurface Drip Irrigation (SDI) in the North China Plain and for water-fertilizer management and decision-making.
small-to-medium river ecosystems, northern China, ecological systems, thermal adaptability, microbial activity, bio-regulation, multi-factor coupling, ecological restoration decision-making
Owing to the influences of global climate change and human activities, small-to-medium river ecosystems in northern China (hereinafter referred to as the target river systems) have been confronted with escalating thermal stress challenges [1, 2]. These rivers, besides playing critical roles in water resource provision, biodiversity, and local communities, hold pivotal significance in maintaining regional ecological balance [3-5]. However, challenges to their thermal equilibrium have arisen under the combined influences of various environmental and socio-economic factors, making effective ecological restoration particularly urgent.
Investigation into the thermal equilibrium status of the target river ecosystems in the study area and their ecological restoration bears considerable importance [6-9]. Firstly, such studies aid in deepening the understanding of ecosystem response mechanisms under climate change and human interventions, subsequently providing a scientific foundation for river ecosystem conservation and recovery [10]. Secondly, targeted research can guide local governments and relevant institutions in formulating more rational and efficient environmental protection policies and measures. Lastly, in-depth study into the ecological restoration of these rivers can offer insights and references for similar regions, thereby further advancing global ecological restoration processes [11, 12].
Despite abundant research on river ecological restoration, most methods have predominantly focused on ecological response analyses under single-factor influences, overlooking the intricate coupling of multiple factors [13-19]. Furthermore, traditional methodologies have often lacked in-depth exploration of microbial activity and bio-regulation, both of which play central roles in ecosystem thermal equilibrium status [20-23]. Consequently, current research methodologies may encounter limitations when addressing complex ecological issues.
The SDI technology integrated with water and fertilization stands as an essential measure to alleviate water shortages and enhance fertilizer utilization efficiency in the North China Plain. Given the context of large-scale promotion of SDI in Hebei province and the pressing need for water and fertilization optimization measures, this research delves into the thermal equilibrium state of the target river ecosystems in northern China and proposes an optimized ecological restoration decision-making approach that factors in multi-factor coupling. A new methodology for assessing river ecosystem microbial activity indicators, providing crucial references for ecosystem health, will be introduced. Following this, thermal equilibrium and bio-regulation mechanisms of rivers will be analyzed, revealing their key roles in maintaining ecological stability. Finally, centering on irrigation technology parameter selection for wheat-corn rotation in the North China Plain, water and fertilizer management regulatory mechanisms for crop growth and water consumption utilization, and optimized methods and models for coordinated regulation of water-nitrogen-crops under different hydrological years, a comprehensive decision-making framework will be presented. This framework, considering multi-factor coupling, offers a scientific, systematic, and feasible strategy for ecological restoration of small-to-medium rivers in the study area. Not only will it serve as a valuable reference for research and practices in river ecological restoration but it will also foster enhanced global collaboration in the ecological restoration domain and provide guidance for SDI technology parameter determination and water-fertilizer management and decision-making in the North China Plain.
To comprehensively and deeply understand the response mechanisms of the target river ecosystems under thermal stress, and to offer a more scientific and systematic foundation for their ecological restoration, biological activity indicators for these river ecosystems are measured in five aspects: Calculation of river ecosystem Biological Metabolic Entropy (BME), Fitting relationship between river ecosystem BME and temperature, Calculation of temperature sensitivity of river ecosystem BME, Calculation of river enzyme activity, and Calculation of temperature sensitivity of river enzyme activity.
The BME of ecosystem is an indicator reflecting the energy conversion and utilization efficiency of the biological community within an ecosystem under specific environmental conditions. By determining the BME, the impact of the ecosystem's biology on energy flow and material cycle within river ecosystems is better understood, facilitating an enhanced evaluation of its role in the thermal equilibrium state. Assuming that the BME of the river ecosystem is represented by SU EMA, the respiration rate of river ecosystem biology by C, the carbon of ecosystem biology biomass by LNV, the concentration of titrated hydrochloric acid by VHC, the titration volume of blank treatment by C0, the titration volume of sample treatment by C1, the mass of air-dried soil by l, and the cultivation time by y, the calculation formula for BME of the river ecosystem is given by the following equations:
$S U \quad E_{M A}=C / L N V$ (1)
$C=V_{H V} *\left(C_0-C_1\right) * 22 /(l * y)$ (2)
In the backdrop of global warming, it is crucial to understand the relationship between ecosystem BME and temperature. Such understanding aids in predicting how the biological activity of ecosystems might change under various temperature fluctuation scenarios, thereby guiding ecological restoration strategies. Assuming the BME of the river ecosystem is represented by E, the simulated minimum value by s, the rate constant by j, and the measured temperature by Y, the formula for fitting between the river ecosystem BME and temperature is:
$E=s * r^{j Y}$ (3)
Diverse ecosystem biological communities might exhibit varying sensitivities to temperature. Evaluating their temperature sensitivity can offer insights into which ecosystem biological communities are likely to be more active or inhibited under specific temperature conditions. Such evaluations are essential for devising targeted ecological restoration measures. Assuming river BME is denoted by E and the measured temperature by Y, the formula for calculating the temperature sensitivity W10 of the river ecosystem BME is:
$W_{10}=E_{(Y+10)} / E_Y$ (4)
Enzymatic activity in river water is a direct marker of biological activity within the river ecosystem. This activity can reflect the decomposition rate of organic matter in the river water and the cycling speed of nutrients. By measuring river enzymatic activity, the biogeochemical processes within the river ecosystem can be directly assessed. Assuming soil enzyme activity is denoted by AbSn, corrected soil fluorescence intensity by D, total volume of sample suspension by C, volume of sample suspension added to each microporous plate by C1, dark cultivation time by y, mass of dried soil by l, fluorescence intensity of the sample micropores read by the multifunctional enzyme label instrument by d, fluorescence intensity of blank micropores by dn, quenching factor by w, fluorescence intensity of negative control micropores by da, fluorescence release factor by r, fluorescence intensity of reference standard micropores by de, concentration of reference standard micropores by Va, volume of added reference standard substance by d2, and fluorescence intensity of quenching standard micropores by dw, the formulas for calculating river enzymatic activity are:
$S_n=D * C /\left(r * C_1 * y * l\right)$ (5)
$D=\left(d-d_n\right) / w-d a$ (6)
$r=d_e /\left(V_a * C_2\right)$ (7)
$w=\left(d_w-d_n\right) / d_e$ (8)
Similar to the temperature sensitivity of the ecosystem BME, the temperature sensitivity of river water enzymes can offer insights into which biochemical processes might be more active or inhibited under specific temperature conditions. Assuming the enzymatic activity of the river is denoted by S and the measured temperature by Y, the formula for calculating the temperature sensitivity W10 of river enzymes is:
$W_{10}=S_{(Y+10)} / S_Y$ (9)
In hydrology and river ecology, thermal equilibrium is defined by the balance between the total energy absorbed and released by the river. To accurately reveal how energy is distributed within the river ecosystem, suitable mathematical and physical tools must be chosen. The Bowen ratio represents the value between sensible heat flow and latent heat flow. Through this ratio, it is possible to intuitively understand how energy is distributed between temperature rise (sensible heat) and evaporative cooling (latent heat) in a river ecosystem. This aids in uncovering the key mechanisms of river thermal balance. The formula for the daytime Bowen ratio is presented as:
$\alpha=\frac{G_a}{M R}$ (10)
The big leaf model, an integration of various physical processes, takes into account both the surface energy exchange and turbulent transport of the river. When studying the thermal balance of the target river ecosystems in northern China, a model that encapsulates these complex processes is deemed crucial. Turbulence conductivity and river surface conductivity were also considered during model construction. Turbulence is identified as the main dynamic process influencing river water temperature and energy exchange. Turbulence conductivity precisely describes the heat and moisture transport driven by turbulence. In these rivers, the river surface conductivity plays a pivotal role in heat and moisture exchange, especially during interactions between the river and the atmosphere. Incorporating turbulence conductivity and river surface conductivity can enhance the accuracy and applicability of the big leaf model, making it more adept at describing the thermal equilibrium of these rivers in the north. Assuming turbulence conductivity is represented by hs, river surface conductivity by hv-r, daily evapotranspiration by RYOL, slope of the saturated vapour-temperature curve by ∆, psychrometric constant by ε, net radiation energy by Eb, heat flux by H, average air density by ϑ, specific heat at constant pressure by Vo, vapour pressure difference by COF, turbulent kinetic conductivity by hs, layer conductivity by hv-r, and latent heat coefficient by η. The crux of the big leaf model is energy balance, ensuring that the energy absorbed and released by the river surface is balanced at any given moment. This includes radiation from the sun, background radiation from the atmosphere, river evaporation, and sensible heat exchange. The expression for the big leaf model, which describes heat diffusion overcoming both river surface resistance and turbulence resistance, is provided below:
$R Y_{O L}=\frac{\Delta(E b-H)+\vartheta V_o C O F h_s}{\eta\left[\Delta+\varepsilon\left(1+h_s / h_{v-r}\right)\right]}$ (11)
The slope of the saturated vapour pressure curve can be calculated using the following equation:
$\Delta=\frac{4098\left[0.6108 \exp \left(\frac{17.27 Y}{Y+237.3}\right)\right]}{(Y+237.3)^2}$ (12)
The primary biological regulation factor influencing variations in the big leaf model is the river surface conductivity, denoted as hv-r. Assuming latent heat flux is represented by MR, this factor can be inferred from the inverse calculations of the big leaf model:
$h_{v-r}=\frac{1}{\vartheta v_o / \varepsilon(C O F / M R)+[(\Delta / \varepsilon) \alpha-1] \times 1 / h_s}$ (13)
Assuming the flow velocity of water is represented by c and the frictional flow velocity by ω*, then hs can be calculated as follows:
$h_s=\frac{1}{\left(c / \omega^{* 2}\right)+6.2 \omega^{*-0.67}}$ (14)
Research on river thermal equilibrium is essential for understanding the stability and adaptability of river ecosystems. Evapotranspiration, as a primary energy exchange process, plays a central role in river thermal balance. Traditional thermal equilibrium models might not distinctly differentiate evapotranspiration regulated by energy and physiological processes. By introducing a decoupling coefficient, the model's adaptability to real-world conditions can be enhanced, thereby improving its accuracy and robustness. The decoupling coefficient, Ψ, can be calculated as follows:
$\Psi=\frac{\Delta+\varepsilon}{\Delta+\varepsilon\left(1+h_s / h_v\right)}$ (15)
Figure 1. Conceptual model of biological regulation in small-to-medium river ecosystems in northern China with thermal balance considerations
The Priestley-Taylor (PT) model is a classical, radiation-based evapotranspiration estimation method. Noteworthy is its relative simplicity and sensitive response to environmental variables. In river thermal balance, solar radiation serves as the primary energy source, making direct evapotranspiration measurements potentially challenging and costly. The PT model offers a simplified yet accurate method to estimate river evapotranspiration, with a particular emphasis on the role of radiation in the evapotranspiration process, invaluable for large-scale or continuous observations. The PT model can be written as:
$M R_{\text {rw }}=\frac{\Delta\left(E_b-H\right)}{\Delta+\varepsilon}$ (16)
Figure 1 provides the conceptual model of biological regulation in small-to-medium river ecosystems in northern China taking thermal balance into account.
Given the complexity and vulnerability of northern small-to-medium river ecosystems, a comprehensive multi-factor decision optimization strategy is crucial for their ecological restoration. Decisions based on a single factor may overlook some key environmental, social, or economic elements, potentially leading to the incompleteness or failure of the restoration strategy. An integrated approach considering multiple factors ensures the comprehensiveness of the strategy, addressing all potential influencing factors. Moreover, environmental, social, and economic conditions are continuously evolving. A restoration strategy that considers various influencing factors is better equipped to adapt to these changes, ensuring its long-term success and benefits.
4.1 Economic benefit indicator
Funding is required to support restoration projects, and the economic benefits of investments are vital to ensure sustained financial backing for these projects. By considering economic benefits, it can be ensured that restoration projects deliver both environmental advantages and economic returns. Assuming the discount rate is denoted by f, the year in the range [yl-1,yl) is represented by Sb(yl)=1,2,…, and the initial and operational cost saved during period [yl-1,yl) is denoted by AC(yl), while the maintenance cost is represented by LV(yl), then the calculation formula of the economic benefit indicator BOC is:
$B O C=\sum_{l=1}^Y \frac{A C\left(y_l\right)-L V\left(y_l\right)}{(1+f)^{S b\left(y_l\right)-1}}$ (17)
The ecological restoration cost over time is denoted by o(yl), lvuj(yl) represents the cost of performing ecological restoration maintenance for once on a set of projects zuj, iuj(yl) represents the number of maintenance instances, then the formulas for AC(yl) and LV(yl) are:
$\begin{aligned} & A C\left(y_l\right)= o\left(y_l\right) \sum_{u=1}^b \sum_{j=1}^{j u}\left[s_e^u\left(z\left(y_l\right), y_l\right)-s_j^u\left(z\left(y_l\right), y_l\right)\right] z_j^u\left(y_l\right)\end{aligned}$ (18)
$L V=\sum_{u=1}^b \sum_{j=1}^{j u} l v_j^u\left(y_l\right) i_j^u\left(y_l\right)$ (19)
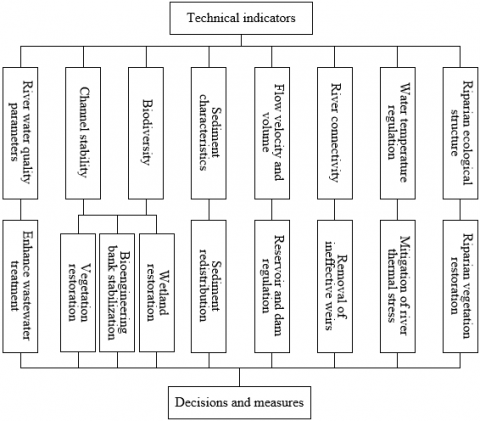
Figure 2. Technical indicators and corresponding decision hierarchical structure
4.2 Technical indicators
Technical factors form the foundation for implementing ecological restoration. Figure 2 illustrates the technical indicators and their corresponding decision hierarchical structure. Ensuring that the most recent and suitable techniques are considered can maximize restoration efficacy while avoiding the adoption of outdated or inappropriate technological methods. Rating techniques are employed to quantify elements at each level. Such evaluations, integrating both expert subjective judgement and empirical data analysis, ensure the scientific and practical nature of decisions. Thus, based on the Analytic Hierarchy Process (AHP), rating techniques were used to quantify the technical indicators, further optimizing decisions on the ecological restoration of small-to-medium river ecosystems in northern China. Assuming the feasibility weight of the u-th ecological system restoration decision option is denoted by Ou, and the feasibility weight of the restoration decision measure zuj is represented by μuj, then the calculation formula is:
$Y A=\sum_{u=1}^b O_u\left(\sum_{j=1}^{j u} \mu_j^u \frac{z_j^u}{\sum_{j=1}^{j u} z_j^u}\right)$ (20)
where,
$\left\{\begin{array}{l}\sum_{u=1}^b O_u=1, O_u \geq 0 \\ \sum_{u=j=1}^{j u} \mu_j^u=1, \mu_j^u \geq 0\end{array}\right.$ (21)
Feasibility weights are allocated based on the relative priorities of ecological restoration decision options and measures. At first, the importance of n ecological system restoration decision options was compared in the context. Then, different alternative optimization decision measures for the same ecological system restoration decision option were compared based on ecological restoration speed and the biodiversity index. To quantify, priority levels and pairwise comparison matrices were employed to assign values to feasibility weights. A total of b+m matrices need to be constructed: a b×b matrix for the ecological system restoration decision option, which can infer Ou, and b matrices for alternative optimization decision measures (u×ju) that can infer μuj. Data in these matrices are further normalized to ensure the final technical indicators for ecological system restoration decisions fall within the [0,1] range.
4.3 Thermal adaptation indicator
Temperature variations in the target rivers are critical for ecosystem health. By considering thermal adaptability, it is ensured that ecological restoration strategies achieve expected outcomes across diverse temperature conditions. The AHP, coupled with rating techniques, was employed to quantify thermal adaptability indicators. The AHP method first decomposes the thermal adaptability issue into various levels and sub-goals. This ranges from overarching restoration objectives to various thermal adaptability sub-objectives, and down to specific restoration strategies or measures. Through AHP's pairwise comparisons, researchers are able to allocate weights to each thermal adaptability indicator, clarifying their relative importance within the overall restoration strategy. By combining the quantified scores and weights of each thermal adaptability indicator, the AHP method produces a comprehensive restoration decision recommendation. Such decisions take into account the specifics of each indicator while reflecting their relative importance. It is assumed that the ratio of thermal adaptability is represented by Eyg(z), photic adaptability ratio by Ecu, water quality ratio by Ese, and climate regulation level ratio by Ebm. Similar to technical indicators, thermal adaptability indicator is essentially the weighted score.
$V A=E_{y g}(z)+E_{c u}(z)+E_{s w}(z)+E_{b m}(z)$ (22)
Assuming the relative importance of each ecological system restoration decision in relation to adaptability categories are represented by ϑyg,u, ϑcu,u, ϑse,u and ϑbm,u. The performance level of each ecological system restoration decision is denoted by ηuyg,u, ηucu,u, ηuse,u and ηubm,u. The specific calculation formulas are given below:
$\left\{\begin{array}{l}E_{y g}(z)=\sum_{u=1}^b \vartheta_{y g, u}\left(\sum_{u=1}^b \eta_{y g, j}^u \frac{z_j^u}{\sum_{j=1}^{j u} z_j^u}\right) \\ E_{c u}(z)=\sum_{u=1}^b \vartheta_{c u, u}\left(\sum_{u=1}^b \eta_{c u, j}^u \frac{z_j^u}{\sum_{j=1}^{j u} z_k^{u j}}\right) \\ E_{s e}(z)=\sum_{u=1}^b \vartheta_{s e, u}\left(\sum_{u=1}^b \eta_{s e, j}^u \frac{z_j^u}{\sum_{j=1}^{j u} z_j^u}\right) \\ E_{b m}(z)=\sum_{u=1}^b \vartheta_{b m, u}\left(\sum_{u=1}^b \eta_{b m, j}^u \frac{z_j^u}{\sum_{j=1}^{j u} z_j^u}\right)\end{array}\right.$ (23)
4.4 Sustainability indicator
A restoration strategy focused narrowly or solely on short-term effects may lead to long-term ecological or societal challenges. Taking sustainability into account ensures that restoration projects not only cater to present needs but also anticipate future changes and challenges. In the context of ecological restoration for the target rivers, sustainability proves pivotal. Sustainability is not just pivotal for evaluating the success of a restoration strategy but also concerns long-term ecological, social, and economic benefits. The regenerative capacity of an ecosystem reflects its ability to self-recover after disturbances, while its degradation capability denotes the rate at which the ecosystem loses its functions or structures under continuous or temporary stresses. Through the quantification of these two factors, a more accurate assessment of the actual effectiveness and long-term stability of ecological restoration strategies can be made. To provide a comprehensive and in-depth evaluation of the sustainability of ecological restoration, this study incorporates methods focusing on the ecosystem's regenerative capacity, degradation capability, and considerations for maintenance cycles.
$A A=\frac{1}{Y} \sum_{l=1}^Y \sum_{u=1}^b O_u \sum_{j=1}^{j u} A_u\left(y_l\right) * F_u\left(y_l\right)$ (24)
It is assumed that the feasibility weight for the u-th ecological system restoration decision option is represented by Ou, and the regenerative capacity of the x-th ecological system restoration project at time yl is denoted by Au(yl), then there is:
$A_u\left(y_l\right)=\frac{z_j^u\left(y_l\right)}{W_u-z_e^u}$ (25)
The ecosystem's degradation capability at time yl is represented by Fu(yl), then its formula is:
$F_u\left(y_l\right)=\frac{s_j^u\left(z\left(y_0\right), y_0\right)}{s_j^u\left(z\left(y_l\right), y_l\right)}$ (26)
4.5 Final optimization model
Upon considering the four multi-factor coupled influencing factors, a multi-objective optimization problem for ecological restoration decisions of the target river systems is presented as follows:
$\begin{aligned} & M A X \quad\{-R V,-U V, B O C, Y A, V A, A A\} \\ & \text { a.y. }\left\{\begin{array}{l}R V \leq R V_0 \\ U V \leq U V_N \\ \sum_{j=1}^{j u} z_j^u+z_e^u=W_u \\ B O C>0\end{array}\right.\end{aligned}$ (27)
Figure 3 displays the flowchart of the algorithm for solving the optimization model.
Figure 3. Flowchart of the solution algorithm of optimization model
Focusing on the questions of parameter optimization of wheat-corn irrigation technology, the regulatory mechanisms of water and fertilizer management on crop growth and water consumption, and the optimization of coordinated regulation methods and models of SDI in different hydrological years on the North China Plain, this study proposed a novel method for estimating the microbial activity indicators of rivers, offering essential references for the health status of ecosystems. Furthermore, the thermal balance and biological regulatory mechanisms of rivers were analyzed, revealing their critical role in maintaining ecological stability. As seen from Table 1, an exponential relationship between the biological respiration rate and temperature of the target river ecosystems was identified. This relationship can be described by the given regression equations. The rate constants in the regression equations for each river type ranged from 5.39 to 6.53, indicating that microbial activity varies similarly with temperature changes, yet subtle differences remain. The marsh river showed the highest rate constant, suggesting that its biological respiration rate increases most significantly within a certain temperature range. Conversely, the rate constant for mountain rivers was the lowest, indicating a slower response to temperature changes. These data suggest that the temperature sensitivity of different types of river ecosystems varies, likely related to their respective ecological environments and compositions.
Table 1. Relationship between biological respiration rate and temperature in target river systems
|
River Type |
Regression Equation |
Rate Constant (×10-2) |
Determination Coefficient |
P |
|
Mountain River |
y=238.42e0.0534T |
5.39 |
0.985 |
0.011 |
|
Forest River |
y=213.25e0.0586T |
5.87 |
0.986 |
0.023 |
|
Meadow River |
y=169.23e0.0587T |
6.23 |
0.974 |
0.028 |
|
Desert River |
y=205.39e0.0585T |
5.89 |
1.000 |
0.004 |
|
Marsh River |
y=179.56e0.0623T |
6.53 |
1.000 |
0.005 |
Table 2. Temperature sensitivity of biological respiration rate of target river systems in different temperature intervals
|
River Type |
Temperature Interval |
Temperature Sensitivity |
|
Mountain River |
10-20 |
1.62 |
|
20-30 |
1.69 |
|
|
Forest River |
10-20 |
2.14 |
|
20-30 |
1.72 |
|
|
Meadow River |
10-20 |
1.62 |
|
20-30 |
1.89 |
|
|
Desert River |
10-20 |
1.63 |
|
20-30 |
1.86 |
|
|
Marsh River |
10-20 |
1.82 |
|
20-30 |
1.89 |
Table 2 presents the temperature sensitivity of biological respiration rates in different temperature intervals. This sensitivity index assists in understanding how the biological respiration rate changes within varying temperature ranges. Within the 10-20℃ temperature range, the temperature sensitivity of the forest river's biological respiration rate was found to be the highest, reaching 2.14, indicating that microbial activity increases the fastest in this range. However, within the 20-30℃ temperature range, the temperature sensitivity of most rivers falls between 1.72 and 1.89, suggesting a slowdown in the growth rate of microbial activity.
In conclusion, a clear relationship between the biological respiration rate and temperature of the target river ecosystems was established, with variations observed among different river types. Simultaneously, temperature sensitivity changes with both river type and temperature range, demonstrating varying responses of microbial activities to temperature among different river types.
Table 3 presents the regression equations between the BME and temperature in the target river ecosystems. BME, an essential indicator describing the energy conversion efficiency and disorder of organisms, offers insights into the health and functionality of ecosystems. An exponential relationship between the BME and temperature was shown across all river types. The highest rate constant was observed in marsh rivers, at 7.28, suggesting that the increase in BME in marsh river ecosystems is the most rapid when temperature rises, indicating potential heightened sensitivity to temperature changes. Meadow rivers, on the other hand, had the smallest rate constant at 5.48, possibly indicating a relatively weaker response to temperature variations.
Table 3. Relationship between BME and temperature in target river systems
|
River Type |
Regression Equation |
Rate Constant (×10-2) |
Determination Coefficient |
P |
|
Mountain River |
y=118.32e0.0552T |
5.52 |
0.985 |
0.023 |
|
Forest River |
y=92.58e0.0612T |
6.14 |
0.978 |
0.032 |
|
Meadow River |
y=88.42e0.0588T |
5.48 |
0.976 |
0.043 |
|
Desert River |
y=114.36e0.0642T |
6.12 |
1.000 |
0.002 |
|
Marsh River |
y=97.52e0.0714T |
7.28 |
0.986 |
0.014 |
Table 4 showcases the temperature sensitivity of BME across different temperature ranges. Within the 10-20℃ range, the temperature sensitivity of the BME in marsh rivers was the highest, reaching 2.23, further confirming the pronounced sensitivity of marsh rivers to temperature shifts. In the 20-30℃ range, the temperature sensitivity for most rivers lay between 1.59 and 1.89. However, when compared to Table 2, a more uniform temperature sensitivity of BME was observed, with no notable highs or lows.
In conclusion, a distinct exponential relationship was identified between the BME and temperature in the target river ecosystems, with subtle differences observed among various river types. Marsh rivers might be the type most sensitive to temperature fluctuations, as both their rate of change in BME and their temperature sensitivity appeared relatively high.
Table 4. Temperature Sensitivity of BME of target river systems in different temperature intervals
|
River Type |
Temperature Interval |
Temperature Sensitivity |
|
Mountain River |
10-20 |
1.58 |
|
20-30 |
1.82 |
|
|
Forest River |
10-20 |
2.14 |
|
20-30 |
1.59 |
|
|
Meadow River |
10-20 |
1.62 |
|
20-30 |
1.89 |
|
|
Desert River |
10-20 |
1.84 |
|
20-30 |
1.81 |
|
|
Marsh River |
10-20 |
2.23 |
|
20-30 |
1.89 |
Table 5. Temperature sensitivity of enzymes in target rivers across different temperature ranges
|
River Type |
Temperature Interval |
Denitrified Enzyme |
Phosphatase |
β-Glucosidase |
Sulfur Oxidase |
Cell Wall Hydrolase |
|
Mountain River |
10-20 |
1.57 |
1.72 |
1.89 |
1.78 |
1.58 |
|
20-30 |
1.49 |
1.56 |
1.67 |
1.65 |
1.34 |
|
|
Forest River |
10-20 |
1.56 |
1.51 |
1.78 |
1.62 |
1.52 |
|
20-30 |
1.51 |
1.12 |
1.52 |
1.32 |
1.69 |
|
|
Meadow River |
10-20 |
1.49 |
1.58 |
1.78 |
1.47 |
- |
|
20-30 |
1.53 |
1.34 |
1.52 |
1.43 |
- |
|
|
Desert River |
10-20 |
1.55 |
1.48 |
1.63 |
1.35 |
1.32 |
|
20-30 |
1.48 |
1.52 |
1.34 |
1.56 |
1.39 |
|
|
Marsh River |
10-20 |
1.47 |
1.38 |
1.58 |
1.62 |
1.78 |
|
20-30 |
1.42 |
1.59 |
1.42 |
1.72 |
1.56 |
Table 5 displays the temperature sensitivity of five enzymes in two temperature ranges (10-20℃ and 20-30℃) across different river types. Cellulose hydrolase was not detected in meadow rivers, which might be attributed to specific ecological characteristics of these rivers or potentially lower enzyme activity within its ecosystem. Within the 10-20℃ range, β-glucosidase showed a relatively higher temperature sensitivity in most river types. For the 20-30℃ range, the highest temperature sensitivity of cellulose hydrolase was observed in forest rivers, reaching 1.69, while the lowest was noted in mountain rivers, at 1.34. A greater sensitivity for most enzymes in the lower temperature range (10-20℃) than in the 20-30℃ range was recorded.
In Table 6, an aggregation of the temperature sensitivities of the five enzymes for each river type is provided. The highest sensitivity of cellulose hydrolase was documented in marsh rivers, standing at 1.75, suggesting that marsh river ecosystems might particularly rely on the activity and function of cellulose hydrolase. The highest temperature sensitivity for β-glucosidase was found in meadow rivers, at 1.68, while the lowest was in marsh rivers, registering at 1.42.
In conclusion, when compared with data on biological respiration rate and BME, the temperature sensitivity of enzyme activity provides researchers with more specific and detailed insights into ecosystem function and health. Temperature is determined to be a key factor impacting the functionality and health of river ecosystems, holding significant implications for ecological restoration and management.
Table 6. Temperature sensitivity of enzymes in target rivers
|
River Type |
Denitrified Enzyme |
Phosphatase |
Β-Glucosidase |
Sulfur Oxidase |
Cell Wall Hydrolase |
|
Mountain River |
1.56 |
1.63 |
1.69 |
1.56 |
1.39 |
|
Forest River |
1.62 |
1.32 |
1.58 |
1.52 |
1.58 |
|
Meadow River |
1.51 |
1.54 |
1.68 |
1.42 |
- |
|
Desert River |
1.52 |
1.52 |
1.52 |
1.49 |
1.34 |
|
Marsh River |
1.48 |
1.53 |
1.42 |
1.56 |
1.75 |
Table 7. Correlation between temperature sensitivity of enzymes in target rivers and climatic factors
|
Climatic Factors |
Denitrified Enzyme |
Phosphatase |
β-Glucosidase |
Sulfur Oxidase |
Cell Wall Hydrolase |
|
Average annual temperature |
-0.924* |
0.073 |
-0.946* |
-0.056 |
0.263 |
|
Average annual rainfall |
-0.879* |
0.256 |
-0.918* |
0.324 |
0.265 |
Table 7 illustrates the correlation between the temperature sensitivity of enzymes in target rivers and two primary climatic factors: average annual temperature and average annual rainfall. A significant negative correlation is observed between the average annual temperature and the temperature sensitivity of denitrified enzyme and β-glucosidase. This suggests that as the average annual temperature rises, the temperature sensitivity of these two enzymes decreases. No significant correlation was found between the average annual temperature and the temperature sensitivity of sulfur oxidase or cellulose hydrolase. A noteworthy negative correlation was also seen between the average annual rainfall and the temperature sensitivity of denitrified enzyme and β-glucosidase. This implies that with an increase in rainfall, the temperature sensitivity of these enzymes also reduces. No significant correlation was detected between average annual rainfall and other enzymes.
From these findings, it can be inferred that there is a notable negative correlation between the average annual temperature and the temperature sensitivity of certain enzymes, suggesting that with global warming, the temperature sensitivity of some enzymes might decrease. More specifically, the function of denitrified enzyme and β-glucosidase might be affected in warmer conditions. An increase in average annual rainfall might also reduce the temperature sensitivity of some enzymes. This could be related to changes in river hydrological characteristics induced by increased rainfall, such as flow rate, depth, and dissolved oxygen. These correlations provide an indication that climate change, especially changes in temperature and rainfall patterns, might impact the function and health of river ecosystems. Understanding these correlations is particularly crucial in the context of global warming for predicting and managing future changes in river ecosystems. This also underscores the interplay between climatic factors and internal ecosystem functions, holding significant relevance for ecological restoration and management.
Figure 4. Analysis of the thermal equilibrium state of target river ecosystems under restoration decision optimization
Field experiments and model simulations were conducted, and a comprehensive decision optimization framework was proposed, which took into account the coupling of various factors. This provides scientific, systematic, and feasible strategies for the ecological restoration of northern small-to-medium rivers. Figure 4 depicts the thermal equilibrium state of these river ecosystems when subject to restoration decision optimization. The x-axis represents "Available Heat", while the y-axis corresponds to "Thermal Equilibrium State". As can be seen from the figure, data points (circles) are clustered around the straight line (indicating restoration decision optimization), suggesting that during the actual ecological restoration process, the system's thermal equilibrium state is positively correlated with available heat. Most of the data points are close to or on the optimization line, indicating that the decision optimization framework proposed is effective in most instances. Few points that deviate from the optimization line might be due to specific external factors or internal ecological changes, signifying that the decision optimization framework needs continuous adjustments and refinements in practical applications.
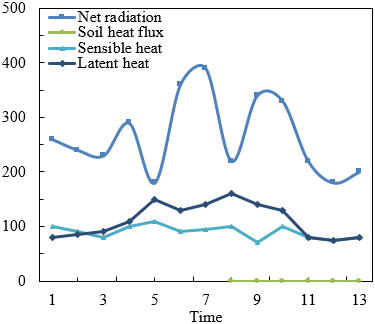
Figure 5. Energy scenarios of target river ecosystems under restoration decision optimization
Figure 5 illustrates the different energy scenarios of target river ecosystems under restoration decision optimization. The x-axis denotes months, while the y-axis represents energy values. Different lines stand for different types of energy. "Net Radiation" has the highest values among all energy types, showing distinct seasonal fluctuations. Between May and July, net radiation peaks, whereas during other times, especially January, November, and December, it remains relatively stable. "Latent Heat" and "Sensible Heat" both demonstrate relatively steady trends, with their energy values being comparatively low. "Heat Flux" maintains a low level throughout the entire period. Under the conditions of restoration decision optimization, energy patterns and trends specific to the target river ecosystems are exhibited. This evidences that when influenced by the optimization strategy, the energy dynamics of the ecosystem can remain in a relatively stable and orderly state.
The main focus of this research has been on the exploration of the thermal equilibrium state of small-to-medium river ecosystems in northern China. For these states, a comprehensive ecological restoration decision optimization scheme was proposed. Field experiments and model simulations were carried out, revolving around the optimal parameters of wheat-corn irrigation technology in the North China Plain, the regulation mechanisms of water and fertilizer management on crop growth and water consumption utilization, and the co-regulation methods and model optimization of SDI water-nitrogen-crops in different hydrological years. Through tabulated data, the temperature sensitivity of five enzymes in these river ecosystems across different temperature ranges was analyzed. It was observed that various river types, such as mountainous rivers and forest rivers, demonstrate distinct enzyme sensitivity at different temperatures. Correlation analysis was performed to study the relationship between annual average temperature, annual average rainfall, and the thermal sensitivity of enzymes. Some factors displayed significant correlation, providing further clues for the exploration of the thermal equilibrium state. The charts provided depict the thermal equilibrium state of the ecosystem under the comprehensive decision optimization framework, as well as the dynamic changes under different energy scenarios.
Within these river ecosystems, the thermal equilibrium state represents a complex system influenced by numerous factors. The temperature sensitivity of different river types, the association with climatic elements, and the thermal equilibrium state after restoration decision optimization all highlight the central role of thermal equilibrium within these ecosystems. The comprehensive decision optimization framework presented is capable of effectively managing and regulating these factors, ensuring the maintenance of a healthy and stable state post-restoration. This multi-factor coupling method offers a scientific, systematic, and viable restoration strategy for these river ecosystems. It is hoped that this approach will furnish valuable insights for future ecological restoration and management, as well as providing a reference for determining the shallow drip irrigation technology parameters for wheat-corn in the North China Plain and for water and fertilizer management decisions.
We gratefully acknowledge the financial support from Water Conservancy Science and Technology Project of Hebei (Grant No.: 2023-28 and 2022-09).
[1] Zhang, M., Chadwick, M.A. (2022). Influences of elevated nutrients and water temperature from wastewater effluent on river ecosystem metabolism. Environmental Processes, 9(3): 43. https://doi.org/10.1007/s40710-022-00597-5
[2] Liao, Y., Fan, J., Zhang, H., Zhang, S., Chen, D. (2022). Evaluation index system for ecological revetment impact on river ecosystem in plain river network at lower reaches of the Yangtze River. Water Resources Protection, 38(4): 189-194.
[3] Zulkarnaini, Yuliasamaya, Syafriadiman. (2021). Mangrove ecosystem biodiversity in Malacca strait and its economic values to local community: A case study in Riau coastline. International Journal of Sustainable Development and Planning, 16(8): 1519-1528. https://doi.org/10.18280/ijsdp.160813
[4] Kurzhykayev, Z., Shutkarayev, A.V., Barinova, G.K., Assylbekova, A.S., Popov, V.A. (2023). Assessing the ecological and biological forage base of the Tobol River: Implications for planktonic and benthic communities. International Journal of Design & Nature and Ecodynamics, 18(3): 605-611. https://doi.org/10.18280/ijdne.180312
[5] Andersen Cirera, K. (2022). Spatial equity in river access. Measuring the public space potential of urban riverbanks in Valdivia, Chile. International Journal of Sustainable Development and Planning, 17(1): 1-12. https://doi.org/10.18280/ijsdp.170101
[6] Cardenas, M.B., Doering, M., Rivas, D.S., Galdeano, C., Neilson, B.T., Robinson, C.T. (2014). Analysis of the temperature dynamics of a proglacial river using time-lapse thermal imaging and energy balance modeling. Journal of Hydrology, 519: 1963-1973. https://doi.org/10.1016/j.jhydrol.2014.09.079
[7] Chávez, S., Terres, H., Lizardi, A., López, R., Lara, A., Vaca, M. (2021). Energetic, exergetic and entropy evaluation in the solar distillation. Journal of Physics: Conference Series, 1723(1): 012011. https://doi.org/10.1088/1742-6596/1723/1/012011
[8] Qi, J., Lee, S., Du, X., et al. (2021). Coupling terrestrial and aquatic thermal processes for improving stream temperature modeling at the watershed scale. Journal of Hydrology, 603: 126983. https://doi.org/10.1016/j.jhydrol.2021.126983
[9] Zhou, H., Zhang, L., Liu, X., Liang, D., Zhu, Q., Gou, Y. (2022). Study of the Relationship between High Mountain Asia Snow Cover and Drought and Flood in the Yangtze River Basin during 1980–2019. Remote Sensing, 14(15): 3588. https://doi.org/10.3390/rs14153588
[10] Evstigneev, V.P., Lemeshko, N.A., Ostroumova, L.P. (2020). Hydrological regime of the Black and Azov Seas catchment under the global warming. IOP Conference Series: Earth and Environmental Science, 438(1): 012008. https://doi.org/10.1088/1755-1315/438/1/012008
[11] Modica, C.J., Lapierre, S.G. (2012). Estimation of kerogen porosity in source rocks as a function of thermal transformation: Example from the Mowry Shale in the Powder River Basin of Wyoming. AAPG bulletin, 96(1): 87-108. https://doi.org/10.1306/04111110201
[12] Wu, C., Ju, M. (2021). International experience of river ecological restoration and its enlightenment to the Yangtze River Protection. Water Resources Protection, 37(3): 136-144. http://doi.org/10.3880/j.issn.1004-6933.2021.03.021
[13] Tang, Y., Ren, X., Kong, L., Yan, Y. (2021). Application of integrated urban river management strategy in Ejingshui River ecological restoration. Water Resources Protection, 37(6): 88-93. http://doi.org/10.3880/j.issn.1004-6933.2021.06.014
[14] Zhang, J., Ma, J., Zhang, Z., et al. (2022). Initial ecological restoration assessment of an urban river in the subtropical region in China. Science of The Total Environment, 838: 156156. https://doi.org/10.1016/j.scitotenv.2022.156156
[15] Xiao, H., Jia, J., Chu, Q., Liu, L. (2021). Effect of river ecological restoration by symbiotic system of aquatic plants. IOP Conference Series: Earth and Environmental Science, 621(1): 012086. https://doi.org/10.1088/1755-1315/621/1/012086
[16] Duan, L.S., Xiang, M.S., Yang, J., Wei, X.H., Wang, C.J. (2020). Dynamics and change features of the eco-environment restoration in the worst hit area of a strong earthquake. International Journal of Sustainable Development and Planning, 15(6): 819-825. https://doi.org/10.18280/ijsdp.150604
[17] Duan, L.S., Xiang, M.S., Yang, J., Wei, X.H., Wang, C.J. (2020). Eco-environmental assessment of earthquake-stricken area based on Pressure-State-Response (P-S-R) model. International Journal of Design & Nature and Ecodynamics, 15(4): 545-553. https://doi.org/10.18280/ijdne.150412
[18] Andersen Cirera, K. (2022). Spatial equity in river access. Measuring the public space potential of urban riverbanks in Valdivia, Chile. International Journal of Sustainable Development and Planning, 17(1): 1-12. https://doi.org/10.18280/ijsdp.170101
[19] Raimondi, F., Marchioni, M.L., Dresti, C., Kian, D., Mambretti, S., Becciu, G. (2021). Urban flood risk management: Impact of combined strategies. International Journal of Environmental Impacts, 4(3): 219-230. https://doi.org/10.2495/EI-V4-N3-219-230
[20] Zhang, X., Liu, K., Wang, S., et al. (2022). Spatiotemporal evolution of ecological vulnerability in the Yellow River Basin under ecological restoration initiatives. Ecological Indicators, 135: 108586. https://doi.org/10.1016/j.ecolind.2022.108586
[21] Liu, S., Shao, Q., Ning, J., Niu, L., Zhang, X., Liu, G., Huang, H. (2022). Remote-sensing-based assessment of the ecological restoration degree and restoration potential of ecosystems in the upper yellow river over the past 20 years. Remote Sensing, 14(15): 3550. https://doi.org/10.3390/rs14153550
[22] Zhai, L., Cheng, S., Sang, H., Xie, W., Gan, L., Wang, T. (2022). Remote sensing evaluation of ecological restoration engineering effect: A case study of the Yongding River Watershed, China. Ecological Engineering, 182: 106724. https://doi.org/10.1016/j.ecoleng.2022.106724
[23] Zhang, X., Zhang, X., Zhang, Z., Zhang, J., Fan, P. (2020, November). Measures, methods and cases of river ecological restoration. IOP Conference Series: Earth and Environmental Science, 601(1): 012025. https://doi.org/10.1088/1755-1315/601/1/012025