Nanyang Zhang![]()
© 2023 IIETA. This article is published by IIETA and is licensed under the CC BY 4.0 license (http://creativecommons.org/licenses/by/4.0/).
OPEN ACCESS
With the burgeoning demand for high-precision and high-efficiency production, the optimisation of tool cutting parameters has become increasingly paramount. For the first time, a model rooted in thermodynamic response has been proposed, offering a scientific basis for the optimisation of numerical control tool cutting parameters. By conducting an in-depth analysis of the thermal energy produced during the cutting process, this model, through state-of-the-art sensor technology, captures real-time temperature variations in the cutting zone, thereby elucidating thermal flow characteristics under varying cutting parameters. Employing machine learning algorithms, optimal cutting speeds, cutting depths, and feed rates for specific workpiece materials can be predicted and recommended. Preliminary experimental validations indicate that, when compared to conventional optimisation methods, the thermodynamic response-based model significantly enhances cutting efficiency, reduces workpiece thermal deformation, and extends the tool's lifespan. This investigation paves the way for a novel perspective and methodology for the intelligent optimisation of future numerical control tool cutting parameters.
thermodynamics, numerical control tool, cutting parameters, machine learning, temperature capture, thermal flow, parameter prediction
Over the past few decades, unprecedented technological advancements have been witnessed in modern manufacturing. Numerical control cutting technology, a significant facet of these transformations, has robustly underpinned the precision machining and manufacturing of workpieces [1, 2]. Throughout this evolution, thermodynamic responses during the cutting process increasingly became a focal point of research, given its direct implications for machining quality, tool durability, and overall production efficiency [3-7]. However, in spite of continuous advancements, the accurate and real-time capture and optimisation of this response remains a challenge faced by many engineers and researchers.
One core tenet of manufacturing has always been the persistent enhancement of production efficiency while ensuring product quality. This necessitates a profound understanding of various influencing factors in the cutting process [8-10]. Particularly, comprehension of thermodynamic properties during cutting, and their effects on the cutting tools and workpieces, not only offers guidance on enhancing cutting outcomes but also aids in prolonging the lifespan of tools and reducing production costs [11-15]. Moreover, with the continuous progression of manufacturing technologies, the demand for such intricate studies has only amplified, rendering this line of inquiry pivotal for both technological advancement and economic benefits across the industry.
Historical studies in the realm of cutting thermodynamics have certainly reaped considerable successes. Yet, these conventional methods largely remained anchored in macro-level heat conduction analyses [16, 17]. Microscopic factors, such as the heat carrying capacity of chips and the temperature effects on cutting tools, often pivotal in real cutting scenarios, have frequently been overlooked. Furthermore, traditional methods reveal certain limitations in parameter optimization [18-20]. Typically relying on empirical data or static models, they lack adaptability to real-time data and specific application scenarios, consequently curbing their accuracy and widespread utility.
In light of these observations, an in-depth investigation into numerical computations for chip heat carrying has been conducted, aiming to capture minute variations in thermal energy generated during the cutting process. Factors affecting the temperature of cutting tools have been exhaustively examined, with underlying physical mechanisms comprehensively interpreted. Based on these findings, a novel model considering the impacts of thermal flow characteristics on the temperature of cutting tools has been formulated. This model distinctly portrays thermal flow characteristics under varied cutting parameters. To further enhance the precision of parameter optimisation, machine learning combined with an enhanced simulated annealing algorithm has been employed, predicting optimal cutting speeds, depths, and feed rates for specific workpiece materials. In essence, this research provides a novel methodology and perspective for the thermodynamic optimisation of numerical control cutting technology, promising significant economic benefits for actual production.
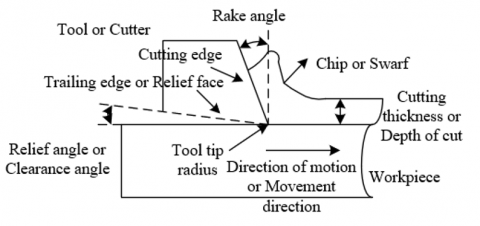
In the realm of manufacturing, particularly within numerical control machining, the thermodynamic response's management and control are of paramount importance. This thermodynamic response during the cutting process directly correlates to the machining quality, tool durability, and overall production efficiency. Numerical computation of the heat carried by chips aids in mastering the heat distribution and accumulation during the machining process. Such insights are critical for adjusting cutting parameters, such as cutting speed, depth, and feed rate, aiming for enhanced efficiency and superior quality. Concurrently, excessive thermal stress might precipitate premature tool wear or damage. A profound understanding of the heat carried by chips, through numerical computations, facilitates manufacturers in optimising thermal loads during the cutting procedure, thus extending the lifespan of tools. Figure 1 depicts a schematic of the cutting model.
Figure 1. Schematic of the cutting model
The thermodynamic response in the cutting process embodies a complex system, wherein both cutting force and cutting temperature are modulated by various factors, especially the three fundamental elements of cutting - speed, depth, and feed rate. To predict and control the thermal response during the cutting process accurately, a model delineating the relationship between this response and its influencing factors is imperative. In this context, a specific energy model during cutting is introduced for heat computations. Fundamentally, the specific energy articulates the energy required per unit material removal. Calculating the heat in cutting based on specific energy, aligned with the overall volume of removed material, permits a more precise representation of heat sources in the machining process. Furthermore, as both cutting force and temperature oscillate with changes in cutting parameters, this specific energy model encapsulates such fluctuations, furnishing more precise data support for parameter optimisation. Let the adjusted specific energy be represented by ra,v, the specific energy of the workpiece material by ra, constants by gv,i, and the correction factor for the material's specific energy by ω. The ensuing expression articulates the specific energy model:
${{r}_{a,v}}={{r}_{a}}\cdot g_{v,i}^{-\omega }$ (1)
Multiple facets interact in the cutting process, including friction, plastic deformation, and thermal conduction. By basing calculations on the specific energy and the total volume of removed material, one can streamline the complex thermodynamic system without compromising the impact of primary heat sources. Essentially, the calculation of heat in cutting, rooted in specific energy and the total volume of removed material, distils the complexity of the cutting process into several pivotal parameters. Let the volume of the chips be represented by Ca, the heat numeric of the chips by WSH, and the heat distribution coefficient of the chips by ESH. The following expressions elucidate the heat calculation:
${{W}_{x}}={{r}_{a,v}}\cdot {{C}_{a}}\cdot g_{v,i}^{-\omega }$ (2)
${{W}_{SH}}={{E}_{SH}}\cdot {{r}_{a,v}}\cdot {{C}_{a}}\cdot g_{v,i}^{-\omega }$ (3)
Temperature fluctuations in the cutting zone serve as a pivotal parameter during the machining process, impacting the wear rate of the tool, the quality of machining, and the integrity of the workpiece. Advanced sensor technologies have been employed to capture these fluctuations in real-time. Temperature variations at the tool-workpiece and tool-chip interfaces can be detected using infrared thermography, a technique that translates surface infrared emissions into temperature values. This non-invasive method permits real-time monitoring of temperatures at the tool and workpiece contact regions. The internal temperature changes within the shear zone can be approximated through Raman scattering spectroscopy, which offers thermal data of materials. Optical fibre sensors, on the other hand, can be integrated into the tool's core, facilitating real-time temperature readings within.
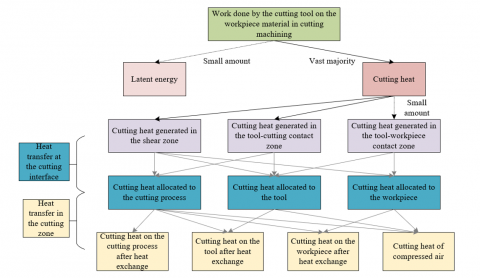
Figure 2. Thermal energy analysis process during cutting
The thermal shifts experienced by cutting tools during operations epitomise a complex thermodynamic phenomenon, influenced by myriad interacting factors. Tools may frequently transition between active and idle states, especially in interrupted or intermittent cutting scenarios (Figure 2). Such regular transitions inhibit swift thermal equilibrium between heat absorption and dissipation, culminating in heat accumulation on the tool edges. Concurrently, as substantial material is sheared off, significant heat is generated, which traverses between the tool and the workpiece, elevating the tool's temperature. Assuming the total heat absorbed by the cutting tool is represented by WGDTO, the heat dissipated is denoted as WGDAB, and the heat absorbed by the tool is illustrated by eWGDDI, the process can be articulated as:
$W_{TO}^{GD}=W_{AB}^{GD}-W_{DI}^{GD}$ (4)
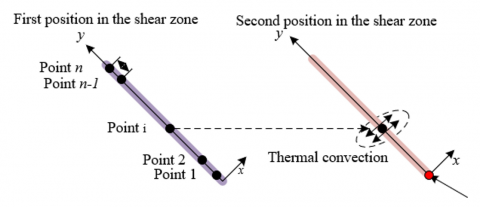
Heat generation and propagation during cutting are vital factors affecting the quality of machining, tool longevity, and workpiece integrity. Given the assumption that there is no heat exchange externally during machining, the analysis of internal heat sources and modes of heat transfer becomes paramount. Significant heat is generated at the contact zone due to friction and plastic deformation when the tool engages with the workpiece. This heat remains one of the primary sources during the cutting process. As material undergoes shearing to form chips, additional heat arises from friction at the tool-chip contact region. Material shear deformation during cutting elevates its internal energy, releasing it as heat - the principal heat source within the shear zone (Figure 3).
Figure 3. Heat transfer schematic in the shear zone
Heat produced in the shear zone is expelled by the chips, and as these chips migrate, this heat is convected to other parts of the cutting region. Additionally, coolants or compressed air used during cutting can convectively remove some heat, cooling the machining zone. Assuming the convective heat transfer from the cutting tool is represented by WGDTR, the heat exchange area of the cutting tool by SGD, the contact surface temperature of the cutting tool by YGD, the temperature of compressed air by YKQ, the heat exchange time for the cutting tool by yTR, the radiative heat transfer from the cutting tool by WGDRA, the emissivity of the cutting tool surface by vGD, and the surrounding temperature by YAR, the convective heat transfer value generated in the shear zone can be expressed as:
$W_{TR}^{GD}={{\beta }_{TR}}\cdot {{S}_{GD}}\left( {{Y}_{GD}}-{{Y}_{KQ}} \right){{y}_{TR}}$ (5)
Under elevated temperatures, heat from the shear zone might also be radiatively transferred to the surrounding environment. Although this mode remains relatively minor, under specific cutting conditions, it becomes salient. The radiative heat value from the shear zone can be determined as:
$W_{RA}^{GD}={{v}_{GD}}\cdot \delta \cdot {{S}_{GD}}\left( {{Y}_{GD}}-{{Y}_{AR}} \right){{y}_{TR}}$ (6)
Understanding the actual heat absorbed by the tool aids researchers and engineers in fine-tuning the cutting parameters, thereby mitigating tool temperature, enhancing tool lifespan, and ensuring impeccable workpiece machining. The heat distribution coefficient represents how cutting heat is allocated between the tool and other components, typically ranging between 0 and 1. The total generated heat encapsulates all heat produced during cutting due to friction between the tool and workpiece, the tool and chips, and material shear deformation. Multiplying the two gives the actual heat absorbed by the tool. Assuming the heat distribution coefficient of the cutting tool is represented by EGDg, it can be articulated as:
$W_{AB}^{GD}={{W}_{x}}\cdot E_{g}^{GD}$ (7)
Upon contact between the cutting tool and workpiece, the tool absorbs heat, causing internal temperature fluctuations. To sidestep the complexities of direct heat measurement and provide a methodology in sync with actual cutting operations, this study has chosen to calculate the total absorbed heat based on the internal temperature changes of the cutting tool. Assuming the specific heat capacity of the cutting tool material is represented by VGD, the mass of the cutting tool by YGD, and the original temperature of the cutting tool by VGD, it can be articulated as:
$W_{TO}^{GD}={{V}_{GD}}\cdot {{L}_{GD}}\left( {{Y}_{GD}}-{{{{Y}'}}_{GD}} \right)$ (8)
Incorporating the heat distribution, total heat absorbed by the tool, and the tool's thermo-physical properties, the temperature of the cutting tool during unit cutting time can be expressed as:
$Y_{G D}=\frac{r_{a, v} \,\,C_a g_{v, i}^{-\omega}\,\,+\,\,\beta_{T R} \,\,S_{G D} \,\,y_{T R} \,\,\,Y_{K Q}\,\,+\,\,v_{G D} \,\,\delta \,\,S_{G D} \,\,y_{T R} \,\,Y_{A R}\,\,+\,\,V_{G D}\,\, L_{G D}\,\, Y_{G D}}{\beta_{T R}\,\,\, S_{G D} \,\,y_{T R}\,\,+\,\,V_{G D}\,\,\, L_{G D}}$ (9)
Cutting operations are inherently nonlinear and dynamic, entailing various physical phenomena. Temperature variations in tools directly influence wear rates and overall performance. Insights into how thermal flow characteristics impact cutting temperature offer a theoretical foundation for optimising cutting parameters, including cutting speed, feed rate, and cutting depth. Thus, constructing a model that comprehensively considers these thermal flow characteristics can more precisely simulate temperature distribution and variations during actual cutting processes. This aids in predicting tool lifespan, minimising downtime, and enhancing production efficiency. Additionally, it enables the formulation of more effective cooling strategies, such as selecting appropriate coolants or adjusting cooling methods.
Considering the heat convection factor of the shear band formed during chip creation, let y=jΔy, and it is assumed that the chip formation phase is represented by j. The formula for calculating the heat variation of cutting tools is provided by:
$W_{D I}=\frac{\eta y m_v\left(Y_{P R-u}\,\,\,\,\,\,+Y_{S E-L O-F R}\,\,\,\,\,\,\,\,\,\,\,\,\,-Y_{S E-P R-u}\,\,\,\,\,\,\,\,\,\,\right)}{\Delta f}$ (10)
${{Y}_{SE-LO-DI}}=\frac{{{W}_{DI}}}{\Delta lv}$ (11)
The temperature at any given point within the shear zone can be calculated through:
${{Y}_{SE-LO}}={{Y}_{SE-LO-FR}}-{{Y}_{SE-LO-DI}}$ (12)
Thus, the total temperature rise of point u within the shear zone can be calculated using:
${{Y}_{SE-PR-u}}={{Y}_{PR-u}}+{{Y}_{SE-LO}}$ (13)
During cutting, the primary heat sources stem from friction between the tool and workpiece, as well as the tool and chip, coupled with material shear deformation. Altering cutting parameters (like cutting speed, feed rate, and cutting depth) can vary the rate and location of heat generation. Thermal flow characteristics denote the heat distribution methods between the tool, workpiece, and chip, as well as how heat propagates within these components. This encompasses heat conduction, convection, and radiation. Figure 4 illustrates the principles of thermal flow characteristic analysis. Altering cutting parameters, for example by increasing cutting speed, might generate more heat, simultaneously impacting its distribution within the cutting area. Through the developed temperature model considering thermal flow characteristics, the effects of different cutting parameters on these characteristics can be analysed. This allows for simulations of thermal flow characteristics under varied cutting parameters. Numerical methods further clarify how cutting parameters influence these characteristics, thus providing a basis for their optimisation.
Figure 4. Principles of thermal flow characteristic analysis
For the optimal recommendation of cutting speeds, cutting depths, and feed rates tailored to specific workpiece materials, this research has undertaken the prediction of cutting parameters, integrating machine learning with a refined simulated annealing algorithm. The improvements to the algorithm covered herein predominantly focus on model perturbation, state acceptance, and cooling methodology.
A pivotal component in the simulated annealing process, model perturbation dictates the algorithm's capability to evade its current solution and probe further into the solution space, thereby circumventing premature convergence to local optima. Within this study, enhancements to model perturbation derive from the existing Fast Simulated Annealing (FSA) algorithm, amalgamated with the non-uniform mutation strategy of genetic algorithms.
The FSA algorithm is an enhanced version of the traditional simulated annealing, accelerating convergence through rapid temperature and solution updates, thereby efficiently achieving optimal solutions. Assuming that the subscripts for cutting speed, cutting depth, and feed rate are represented by u, the current model parameters are represented by lu, and the perturbed model parameters are represented by lu'. A uniformly distributed random number in the (0,1) interval is represented by e. The range of values for lu is denoted by [luMIN,luMAX], and it is required that the perturbed model parameters fall within the range lu'∈[luMIN,luMAX]. The sign function is represented by SGN(), and the perturbation factor is represented by tuu. Thus, the expression for the Fast Simulated Annealing algorithm is:
${{t}_{u}}={{Y}_{j}}SGN\left( e-0.5 \right)\left[ {{\left( 1+{1}/{Yj}\; \right)}^{\left| 2e-1 \right|}}-1 \right]$ (14)
${{{l}'}_{u}}={{l}_{u}}+{{t}_{u}}\left( {{l}_{uMAX}}-{{l}_{uMIN}} \right)$ (15)
In genetic algorithms, the non-uniform mutation strategy correlates the magnitude of mutation with evolutionary iteration counts. As iterations increment, the mutation amplitude tapers, permitting broad exploration in earlier phases and meticulous local searches subsequently. Drawing upon this non-uniform mutation strategy ensures adaptive mutation amplitude adjustments to cater to varying optimization challenges and solution space characteristics. With a random number between (0,1) represented by e, the current temperature state by y, the maximum iteration count, associated with highest and lowest temperatures, by B, and the shape factor by η, the refined algorithm expression post-perturbation is:
${{t}_{u}}=e{{\left( 1-{y}/{B}\; \right)}^{\eta }}SGN\left( e-0.5 \right)$ (16)
${{{l}'}_{u}}={{l}_{u}}+{{t}_{u}}\left( {{l}_{uMAX}}-{{l}_{uMIN}} \right)$ (17)
State acceptance, another cornerstone of the simulated annealing algorithm, determines the acceptance of newly generated solutions during the exploration process. In this work, the acceptance criterion has transitioned from a sole consideration of absolute energy changes to also accounting for relative energy shifts, yielding marked improvements. Traditional FSA predominantly hinges upon the energy difference between the new and the current solution (absolute difference) to ascertain the acceptance of the new solution. Conventionally, if the new solution possesses lower energy, it gets accepted; however, even with higher energy, there's a certain probability of acceptance contingent on the energy discrepancy and the current "temperature". With the energy difference denoted by ΔR, temperature by Y, and real number by g, the acceptance probability formula in the FSA is:
$O={{\left[ 1-{\left( 1-g \right)\Delta R}/{Y}\; \right]}^{{1}/{\left[ 1-g \right]}\;}}$ (18)
The amended approach, while considering the energy differences between the two solutions, also takes into account the ratio of this difference to the current energy (relative difference). This implies that the probability of accepting the new solution correlates not only with the absolute energy disparity but also with the magnitude of the present energy. With non-negative real numbers represented by β and α, the objective function of the new model by R, and that of the current model by R1, the acceptance probability formula accounting for relative energy change is:
$O={{\left[ 1-\left( {g\Delta R}/{Y}\; \right)\left( {R_{1}^{\beta }}/{{{R}^{\alpha }}}\; \right) \right]}^{{1}/{g}\;}}$ (19)
The cooling technique is an indispensable facet of the simulated annealing algorithm, as it governs the algorithm's search dynamics and convergence properties. In this investigation, the Very Fast Simulated Annealing (VFSA) algorithm's cooling strategy has been harnessed to better suit the needs of predicting cutting parameters. In VFSA, the temperature updating strategy is architected to diminish more rapidly, facilitating a swifter shift of the search focus from global to local. This cooling strategy is commonly paired with a particular probability distribution, like the Cauchy distribution or other long-tailed distributions, to determine the acceptance of new solutions. With the initial temperature state denoted by Y0, constant by V, iteration count by J, and parameters to be inverted by L, the VFSA's temperature updating method is expressed as:
$Y\left( j \right)={{Y}_{0}}\text{exp}\left( -V{{J}^{{1}/{L}\;}} \right)$ (20)
Given the temperature decay factor represented by β, the cooling technique is calculated as:
$Y\left( j \right)={{Y}_{0}}{{\beta }^{j}}$ (21)
The steps for predicting cutting parameters such as cutting speed, cutting depth, and feed rate, leveraging machine learning and the enhanced simulated annealing algorithm, are detailed below:
(1) Data Collection and Pre-processing: Extensive data related to cutting speed, cutting depth, feed rate, tool wear, processing quality, workpiece materials, etc., is amassed. Data undergoes cleansing, standardisation, and normalisation to ensure its quality and applicability.
(2) Feature Selection and Machine Learning Model Training: Features pivotal for predicting cutting parameters are handpicked based on correlation and importance indices. The selected features train the machine learning model to assure robust predictive capabilities.
(3) Initialization of Simulated Annealing Parameters: Initial temperature, terminal temperature, and cooling speed, amongst other simulated annealing parameters, are determined based on data and problem attributes.
(4) Prediction via Enhanced Simulated Annealing Algorithm: The current model parameters are perturbed by integrating the FSA algorithm with the non-uniform mutation strategy of genetic algorithms, yielding novel cutting parameters. Acceptance probabilities are recalibrated to include relative energy changes, determining the acceptance of the newly produced solution. Temperature updates leverage the VFSA's cooling strategy. The internal loop of the algorithm sets a threshold and integrates a memory function to retain the optimal solution identified thus far.
(5) Evaluation and Recommendation: The best solution identified by the simulated annealing algorithm, i.e., the optimal combination of cutting parameters, undergoes evaluation through the machine learning model. Recommendations for the best cutting speed, cutting depth, and feed rate tailored to specific workpiece materials are then made.
Through this comprehensive process, it is affirmed that predictions made for cutting parameters, founded on machine learning paired with the enhanced simulated annealing algorithm, are precise, efficient, and practical, facilitating the recommendation of optimal cutting speeds, depths, and feed rates for specific workpiece materials.
Figure 5. Computed temperature fluctuation curves during the chip formation process
The graph in Figure 5 displays the computed temperatures at the shear zone measurement points under different percentages of chip advancement processes. The x-axis represents the percentage of the chip advancement process, while the y-axis indicates the calculated temperature values. The graph includes five lines, representing 10%, 20%, 40%, 60%, and 80% chip advancement percentages.
From the figure, it can be observed that during the early stages of chip advancement, the temperature in the shear zone gradually increases due to the rise in cutting action and friction, characterizing this phase as a heating stage. In the intermediate phase, the temperature peaks as the cutting action and friction stabilize, establishing a thermal equilibrium. In the later stages of chip advancement, the temperature begins to drop due to the reduction in cutting action and friction, indicating a cooling phase.
It is evident that the chip advancement process undergoes three phases - heating, stabilization, and cooling - at all percentage levels. However, there are slight variations in the manifestations of these stages at different advancement percentages. Notably, temperature changes are more pronounced at 60% and 80% advancement percentages. This can be attributed to factors such as cutting parameters, tool material, workpiece material, and other relevant aspects.
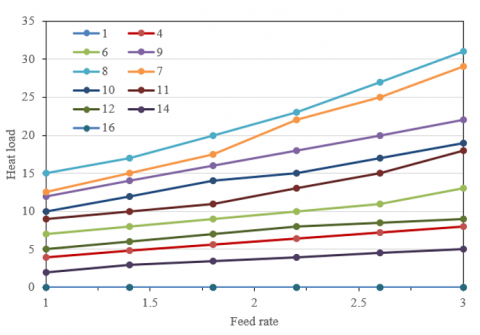
Figure 6 depicts the variation of the heat carried by chips with changes in feed rate. The x-axis represents the feed rate, while the y-axis signifies the heat load. The figure includes multiple lines, each representing different measurement or experimental conditions.
Figure 6. Variation of heat carried by chips with feed rate
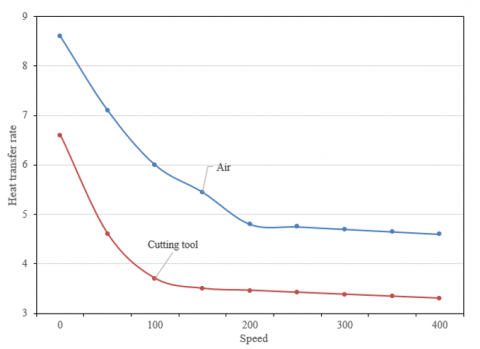
Figure 7. Variation of tool heat transfer rate and ambient heat transfer rate with speed during cutting
From the graph, it is evident that as the feed rate increases, the heat load carried by the chips also rises correspondingly. This is because a larger feed rate implies that more material is being removed, leading to a greater generation of heat. Different measurement or experimental conditions, including cutting speed, cutting depth, tool type, etc., influence the heat load differently. Under certain conditions, an increased feed rate results in a more significant increase in the heat load. Intersection points in the graph indicate specific feed rates where the heat response becomes more pronounced under certain conditions. This can be associated with material properties, the wear level of the tool, or the use of cutting fluids.
Figure 7 illustrates the variation of the heat transfer rate from the tool and from the air during the cutting heat transfer process, as a function of speed. The x-axis denotes the speed, while the y-axis indicates the heat transfer rate. The blue line in the figure represents the heat transfer rate of the tool, and the red line corresponds to the heat transfer rate of the air.
From the graph, it's evident that as the cutting speed increases, the efficiency of heat exchange between the tool and the workpiece diminishes. This is due to the reduced contact time between the tool and the workpiece at higher speeds, resulting in a decrease in the efficiency of heat transfer. The heat transfer rate of the air remains relatively stable, indicating that the cooling effect of the air on the tool is consistent across different cutting speeds. At the intersection point, the heat transfer efficiency of both the tool and the air is equal. This implies that at this speed, both the air and the workpiece contribute equally to cooling the tool. Before this point, the tool primarily relies on direct contact with the workpiece for cooling; after this point, the cooling effect from the air begins to surpass that of direct contact with the workpiece.
In conclusion, cutting speed significantly impacts the heat transfer rate of the tool, whereas it has a minor effect on the air's heat transfer rate. When determining cutting parameters, considering these heat exchange efficiencies is crucial to ensure tool stability and workpiece quality.
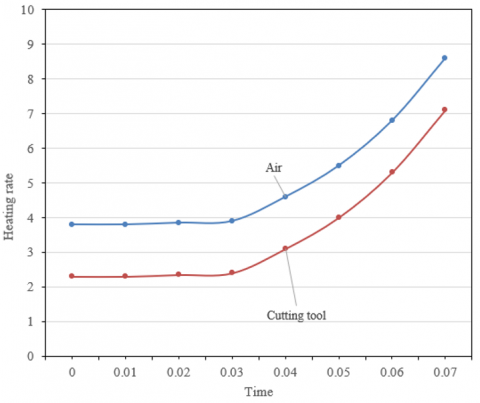
Figure 8. Tool and ambient air heat transfer rates as a function of time during cutting
Figure 8 depicts the variation of the heat transfer rate from the tool and from the air as time progresses during the cutting heat transfer process. The x-axis represents time, and the y-axis denotes the heat transfer rate. The blue line in the figure indicates the heat transfer rate of the tool, and the red line represents the heat transfer rate of the air.
From the graph, it's evident that as the cutting process continues, the efficiency of heat exchange between the tool and the workpiece gradually increases. This can be attributed to the increase in the contact surface between the tool and the workpiece, the cumulative heat effect, and tool wear. While the heat transfer rate of the air also shows an increasing trend, its growth rate is relatively slower. This suggests that the cooling effect of the air remains relatively consistent throughout the cutting process. At the intersection point, the heat transfer efficiency of both the tool and the air is equal. This marks a turning point, after which the cooling effect from the air starts to dominate, surpassing that of direct contact between the tool and the workpiece.
In summary, as the cutting process progresses, the heat transfer rate from the tool gradually increases, while that from the air grows at a relatively slower pace. Considering the changes in these two heat exchange efficiencies is essential when determining cutting parameters and cooling strategies, ensuring tool longevity and machining quality.
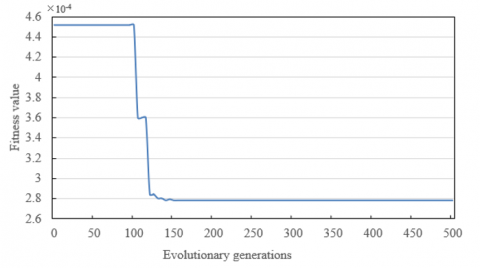
Figure 9. Calculation process of the improved simulated annealing algorithm based on machine learning
Figure 9 illustrates the changes in the optimization objective (cutting parameters) as the number of iterations increases during the computational process of an enhanced simulated annealing algorithm based on machine learning. The graph indicates that, during the initial stages of iteration (approximately from 0 to 150 times), there's a rapid decline in the optimization objective. This is followed by a steady decrease from around 150 to 300 iterations. After 300 iterations, the objective function remains largely stable, with no significant fluctuations.
Analysis suggests that in the early stages of the algorithm, due to the rapid cooling strategy of the Variable Fast Simulated Annealing (VFSA) combined with model perturbation from machine learning, there's a widespread global search. This results in a quick drop in the optimization objective during the initial iterations. As iterations progress, especially between 150 to 300 times, the algorithm's focus shifts towards a more detailed local search. This is associated with the decrease in temperature in simulated annealing, adjustments in the state acceptance strategy, and non-uniform variations in the perturbation strategy. After 300 iterations, with the optimization objective remaining mostly stable, it indicates that the algorithm has likely identified an optimal solution, and further iterations haven't yielded a better one. This phenomenon aligns with the characteristics of the simulated annealing algorithm, where as the temperature drops to a certain level, the acceptance probability of new solutions significantly decreases, leading the algorithm towards stability.
Table 1 lists the results of four different algorithms in determining cutting parameters. These include: Simulated Annealing, Enhanced Simulated Annealing, Differential Evolution, and an Enhanced Simulated Annealing combined with machine learning. As shown in the table, the performance of the four algorithms is quite similar for certain parameters, such as cutting speed and cutting depth. This suggests that different optimization algorithms can identify similar optimal or near-optimal solutions for these parameters. Differences arise in feed speed, tool tip radius, and the amount of cutting fluid used, resulting from the intrinsic strategies and characteristics of each algorithm. However, the machine-enhanced simulated annealing provides a more balanced and comprehensive solution, with smaller prediction errors.
Table 1. Comparison of different algorithms for determining cutting parameters
|
Algorithm |
Cutting Speed (m/min) |
Cutting Depth (mm) |
Feed Speed (mm/rev) |
Tool Tip Radius (mm) |
Cutting Fluid Rate (ml/min) |
|
Simulated Annealing |
68.78 |
2.65 |
0.252 |
0.784 |
149.8 |
|
Enhanced Simulated Annealing |
68.89 |
2.67 |
0.365 |
0.562 |
178.4 |
|
Differential Evolution |
68.87 |
2.64 |
0.583 |
0.489 |
159.8 |
|
Machine-Enhanced Simulated Annealing |
69.17 |
2.66 |
0.484 |
0.635 |
158.1 |
This study primarily explores an optimisation model for numerical control tool cutting parameters based on thermodynamic response and machine learning. A profound analysis was conducted on the thermal energy generated during the cutting process, with a focus on the relationship between specific cutting energy and the total volume of removed material. The changes in tool temperature during the cutting process and their influencing factors were thoroughly investigated. To reveal the thermal flow characteristics under different cutting parameters, a cutting tool temperature model, considering thermal flow features, was established. Lastly, cutting parameters were predicted using a combination of machine learning and the simulated annealing algorithm, recommending optimal cutting speeds, cutting depths, and feed speeds for specific workpiece materials.
Experimental results indicate that during the cutting process, significant temperature elevations of the tool occur due to its contact with the workpiece, thermal accumulation, and other factors. Over time, the heat transfer efficiency between the tool and air alters, reaching a point where the cooling effect of air surpasses the direct contact between the tool and workpiece. Comparisons among several algorithms were also presented. Notably, the approach combining an enhanced simulated annealing algorithm with machine learning demonstrated notable superiority in predicting cutting parameters.
An optimisation model for numerical control tool cutting parameters, founded on thermodynamic response and machine learning, introduces a novel research method in the field of cutting machining. This research not only delves deep into the thermal dynamics of the cutting process but also successfully merges machine learning techniques with traditional algorithms for predicting cutting parameters, offering substantial theoretical backing for selecting cutting parameters in practical production. Particularly, the union of machine learning with the simulated annealing algorithm uncovers immense potential in optimising cutting parameters. Employing this method, efficient, accurate, and stable cutting machining can be achieved, ensuring tool lifespan and processing quality.
[1] Xu, W.H., You, T.G., Mu, F.W., Shen, Z.G., Lin, J.J., Huang, K., Zhou, M., Yi, A.L., Qu, Z.Y., Suga, T., Han, G.Q., Ou, X. (2021). Thermodynamics of ion-cutting of β-Ga2O3 and wafer-scale heterogeneous integration of a β-Ga2O3 thin film onto a highly thermal conductive SiC substrate. ACS Applied Electronic Materials, 4(1): 494-502. https://doi.org/10.1021/acsaelm.1c01102
[2] Hu, X.L., Shao, F., Wang, R.W. (2020). Wear mechanism of WC-Co cemented carbide tool in cutting Ti-6Al-4V based on thermodynamics. Journal of Wuhan University of Technology-Mater. Sci. Ed., 35(5): 973-979. https://doi.org/10.1007/s11595-020-2344-z
[3] Shao, F., Wang, Y.T., Xiao, Y.Q., Xiao, L.H., Zhang, K. S., Cai, Q. (2016). Wear of PCBN tool when cutting materials difficult-to-cut based on thermodynamics solubility. Key Engineering Materials, 693: 1207-1215. https://doi.org/10.4028/www.scientific.net/KEM.693.1207
[4] Shao, F., Wang, Y.T., Li, J.H. (2016). Diffusion wear and oxidation wear of PCBN Tool when cutting materials difficult-to-cut based on thermodynamics solubility. In Materials Science Forum, Trans Tech Publications Ltd., 836: 242-249. https://doi.org/10.4028/www.scientific.net/MSF.836-837.242
[5] Shao, F., Wang, Y.T., Wang, Y.H., Qun, C. (2015). Wear of PCBN tool when cutting materials difficult-to-cut based on thermodynamics entropy. Metallurgical and Mining Industry, 7(4): 381-389.
[6] Buchkremer, S., Klocke, F. (2017). Compilation of a thermodynamics based process signature for the formation of residual surface stresses in metal cutting. Wear, 376-377: 1156-1163. https://doi.org/10.1016/j.wear.2016.11.013
[7] Shao, F., Wang, Y.T., Zou, L.J., Wu, Y.Y., He, C. (2014). Diffusion and oxidation wear of superhard cutting tool based on thermodynamics enthalpy. Advanced Materials Research, 941: 2389-2392. https://doi.org/10.4028/www.scientific.net/AMR.941-944.2389
[8] Shao, F., Wang, Y.T., Zou, L.J., Wu, Y.Y., He, C. (2014). Diffusion and oxidation wear of superhard cutting tool based on thermodynamics solubility. In Advances in Mechatronics, Robotics and Automation II, 536-537: 1417-1420. https://doi.org/10.4028/www.scientific.net/AMM.536-537.1417
[9] Shao, F., Wang, Y.T., Zou, L.J., Wu, Y.Y., Sun, D. (2014). Diffusion and oxidation wear of superhard cutting tool based on thermodynamics. Applied Mechanics and Materials, 556: 511-514. https://doi.org/10.4028/www.scientific.net/AMM.556-562.511
[10] Shao, F., Wang, Y.T., Zou, L.J., Wu, Y.Y., He, C. (2014). Diffusion wear of PCBN tool when cutting materials difficult-to-cut based on thermodynamics. Applied Mechanics and Materials, 494-495: 525-528. https://doi.org/10.4028/www.scientific.net/AMM.494-495.525
[11] Shao, F., Wang, Y.T., Zou, L.J., Wu, Y.Y., Sun, D. (2014). Diffusion and oxidation wear of PCBN tool when cutting materials difficult-to-cut based on thermodynamics. Applied Mechanics and Materials, 538: 54-57. https://doi.org/10.4028/www.scientific.net/AMM.538.54
[12] Kabaldin, Y.G., Bashkov, A.A. (2023). Self-organization and friction in cutting. Russian Engineering Research, 43(4): 451-456.
[13] Bjerke, A., Hrechuk, A., Lenrick, F., Markström, A., Larsson, H., Norgren, S., M’Saoubi, R., Bjork, T., Bushlya, V. (2021). Thermodynamic modeling framework for prediction of tool wear and tool protection phenomena in machining. Wear, 484-485: 203991. https://doi.org/10.1016/j.wear.2021.203991
[14] Kondratenko, V.S., Kadomkin, V.V., Naumov, A.S., Velikovskiy, I.É. (2022). Modern technologies for the laser cutting of micro-and optoelectronics materials. Journal of Optical Technology, 89(2): 113-120. https://doi.org/10.1364/JOT.89.000113
[15] Bjerke, A., Lenrick, F., Norgren, S., Larsson, H., Markström, A., M'Saoubi, R., Petrusha, I., Bushlya, V. (2022). Understanding wear and interaction between CVD α-Al2O3 coated tools, steel, and non-metallic inclusions in machining. Surface and Coatings Technology, 450: 128997. https://doi.org/10.1016/j.surfcoat.2022.128997
[16] Powell, J., Petring, D., Kumar, R.V., Al-Mashikhi, S.O., Kaplan, A.F.H., Voisey, K.T. (2008). Laser–oxygen cutting of mild steel: The thermodynamics of the oxidation reaction. Journal of Physics D: Applied Physics, 42(1): 015504. https://doi.org/10.1088/0022-3727/42/1/015504
[17] Lei, M.K., Miao, W.L., Zhu, X.P., Zhu, B., Guo, D.M. (2021). High-performance manufacturing enabling integrated design and processing of products: A case study of metal cutting. CIRP Journal of Manufacturing Science and Technology, 35: 178-192. https://doi.org/10.1016/j.cirpj.2021.06.003Get rights and content
[18] Zhu, L.B., Cao, H.J., Huang, H.H., Liu, Z.F. (2019). Air Cooling system thermodynamic analysis and thermal balance control of dry cutting machine tool. Jixie Gongcheng Xuebao/Journal of Mechanical Engineering, 55(5): 204-211.
[19] Qiu, L., Du, Y., Wu, L., Wang, S., Zhu, J., Cheng, W., Tan, Z.P., Yin, L., Liu, Z.K., Layyous, A. (2019). Microstructure, mechanical properties and cutting performances of TiSiCN super-hard nanocomposite coatings deposited using CVD method under the guidance of thermodynamic calculations. Surface and Coatings Technology, 378: 124956. https://doi.org/10.1016/j.surfcoat.2019.124956
[20] Widjaja, G., Bohlouli, A., Voronkova, O., Mahdavian, L. (2023). Investigation of thermodynamic parameters, combustion, and emissions of produced biodiesel fuel (from waste oil by heterogeneous nano-catalyst of stone cutting factory sludge) and its combination with diesel fuel. Journal of Thermal Analysis and Calorimetry, 148(15): 7781-7793. https://doi.org/10.1007/s10973-023-12270-6