Nizar F.O. Al-Muhsen![]() | Osamah R.S. Al-Khafaji*
| Osamah R.S. Al-Khafaji*![]() | Firas Basim Ismail
| Firas Basim Ismail![]()
© 2023 IIETA. This article is published by IIETA and is licensed under the CC BY 4.0 license (http://creativecommons.org/licenses/by/4.0/).
OPEN ACCESS
A comprehensive multi-dimensional computational fluid dynamics (CFD) analysis was conducted on a flat plate heat sink, equipped with four perforated fins. This study aimed to optimize the thermal performance by exploring the effects of the geometry and placement of the perforations within the fins. The heat transfer was modelled under conduction for the heat sink body, and natural convection for the enclosure. The investigation focused on the combined influence of the shape of the fin perforations (circular, square, triangular) and their spatial positioning (bottom, middle, top) on the overall thermal performance. It was observed that the temperature gradients (ΔT) from the bottom to the top of the fins were significantly enhanced with the introduction of perforations. Notably, the smallest ΔT of 2.64℃ was recorded with circular perforations, independent of their placement within the fin matrix. Conversely, the highest ΔT of 12.58℃ was observed when the perforations were triangular in shape. Furthermore, an increase in ΔT was noted when all perforation matrices were relocated from the top to the bottom of the fins. Interestingly, the heat transfer coefficient was found to be higher when the heat sink made use of perforated fins. However, the effect of the perforations' shape and placement on this coefficient was found to be less significant. In conclusion, optimal thermal performance was achieved with circularly perforated fins. The buoyancy effect within the enclosure and in the vicinity of the fins was amplified when the heat sink's fins were top-positioned and circularly perforated. This resulted in a 15.6% increase in ΔT, but also a 29.6% increase in the heat transfer coefficient, indicating an overall enhancement in thermal performance under most tested conditions.
computational fluid dynamics (CFD), perforated fins, perforation shape, perforation position, natural convection heat transfer, heat transfer coefficient, temperature difference
The rapid evolution of modern technology has placed increasing demands on researchers to develop innovative heat dissipation systems that can effectively manage the significant heat output of high-tech electronic systems, such as high-speed microprocessors [1]. These systems necessitate highly efficient thermal management solutions to maintain optimal operation and prevent severe thermal damage.
Conventional heat sinks, equipped with plate fins, have been extensively utilized in the electrical and electronic applications industry [2]. Their wide use is primarily attributed to their ease of manufacture, cost-effectiveness, and their ability to enhance the heat transfer coefficient (h) between the system and its surroundings. However, such conventional heat removal methodologies have proven to be inadequate in handling the heat dissipation demands of advanced high-tech systems [3, 4]. Their wide use is primarily attributed to their ease of manufacture, cost-effectiveness, and their ability to enhance the heat transfer coefficient (h) between the system and its surroundings. However, such conventional heat removal methodologies have proven to be inadequate in handling the heat dissipation demands of advanced high-tech systems [5, 6]. This has prompted various efforts to improve the mechanical design of plate fins using different techniques to optimize their thermal performance [7-10]. A notable example of these adopted strategies is the incorporation of perforations into solid fins. The impact of perforations on the thermal performance of flat-plate heat sinks has been the subject of extensive numerical and experimental investigations [3, 11].
Several studies have been reviewed by Ahmed et al. [3] and Kumar et al. [11], focusing on strategies to enhance the thermal performance of utilized heat sinks. These studies primarily examined the influence of fin shapes and orientations, perforation geometry, and the use of microchannels on the heat dissipation rate of the cooling systems. Notably, most of the studies reviewed by Ahmed et al. [3] and Kumar et al. [11], and a majority of related research, have not explored the combined effect of varying perforation shapes and positions on the thermal performance of a heat sink equipped with flat-plate fins. Ibrahim et al. [12] observed significant increases in the heat transfer from the heat source to the fin tip when different shapes of perforations were applied to the tested solid fin. Their findings revealed that the greatest ΔT, 51.29%, was achieved with circular perforations, followed by 45.57% and 42.28% for rectangular and triangular perforations, respectively, in comparison to solid fins. Moreover, the impact of perforation surface area on h and temperature distribution across the tested fins was experimentically investigated by Awasarmol and Pise [13] and Al-Doori [14]. Their findings suggest a decrease in ΔT and an increase in h as the perforation surface area increased. The obtained results were largely attributed to the enhanced heat conduction within the perforated fins and the turbulent airflow near the fins' surfaces.
In this context, computational fluid dynamics (CFD) modelling with three-dimensional (3D) geometry has been increasingly employed as an effective tool for visualizing aerodynamic flow and temperature distribution within and near solid and perforated fins [15, 16]. Feng et al. [17] introduced a novel heat sink (HS) equipped with a crossed flat-plate fin array, tested under conditions of natural convection and radiation heat transfer. A numerically simulated model, validated experimentally, was utilized to investigate the system's thermal performance. The authors reported superior thermal performance of the proposed HS compared with conventional parallel fin HS. Further, a CFD simulation model using the ANSYS Fluent commercial code was carried out to evaluate the thermal performance (average Nu) of an HS equipped with wavy fins, comparing the results with a flat-plate HS [18]. The numerical outcomes were primarily analyzed and discussed in terms of wave number and amplitude of the fins. The authors concluded that heat transfer from the fins' surface to the turbulent air flow increased with the use of wavy fins, and thermal resistance was reduced as wave number and amplitude increased. Hussain et al. [19] numerically investigated the impact of curvature profile at the junction of the HS and fin-base, as well as airflow direction, on the thermal resistance of a flat-plate HS using the ANSYS Fluent code. The proposed CFD model exhibited superior thermal performance compared to the conventional HS.
Employing the RNG-based k-epsilon turbulent flow model and Navier-Stokes equations, major airflow parameters of the 3D fluid flow and convective heat transfer from solid and perforated fin arrays mounted on a flat-plate heat source were predicted [20]. The numerical investigation indicated superior heat transfer when linear holes were used compared to solid fins. This reduction in weight also improved thermal performance, potentially beneficial for mobile micro and high-tech applications. A CFD model was implemented on a pin fin geometry matrix to estimate optimal thermal design in terms of perforation forms and diameters [21]. The numerical investigation revealed that manipulation of dimensions, such as perforation height and diameter, are required for optimal design. The study concluded that the Nusselt number (Nu) increased and average temperature decreased compared to the original design. Al-Damook et al. [22] numerically analyzed the thermal performance of a pin fin HS with multiple circular perforations. An increase in Nu value by approximately 11% was observed when the number of perforations was increased compared to the solid fin. This also enhanced the temperature distribution over the fins body, leading to increased heat transfer between the surface and the surrounding.
There exists an algorithm proposed by Balachandar et al. [23] that targets optimized design for superior thermal performance. This algorithm is accompanied by a validated computational fluid dynamics (CFD) model, which is employed to numerically analyze the impact of elliptical perforations on the heat dissipation rate of solid fins within the utilized heat sink (HS) relative to the surrounding environment. The result demonstrated improved performance of perforated fins compared to solid fins. Furthermore, the post-processing results suggested that the dimensions and positions of the ellipse's perforations could potentially affect the heat transfer rate from the source to the surrounding environment. Al-Essa and Al-Hussien [24] investigated the effects of the orientation and geometry of two square perforations on the thermal performance of horizontal fins. To numerically resolve the presented problem, the variational approach finite element technique was adopted. The authors concluded that the thermal resistance of the solid fin decreased with the utilization of square perforations. Moreover, the heat dissipation rate was enhanced when the perforations were oriented horizontally, compared to the inclined fin.
The majority of the reviewed works, which encompass both numerical and experimental investigations, focus on optimizing the thermal performance of different types of HSs. Numerous numerical investigations have highlighted the use of multidimensional CFD modeling tools. However, few numerical studies have been conducted that investigate the combined effect of the perforations' positions and shapes on the heat transfer by conduction and natural convection on a flat plate HS. Specifically, the numerical simulation of conduction heat transfer from the heat source to the HS fins (both solid and perforated) and the natural convection heat transfer from the fins to the ambient environment, present challenges in terms of design and numerical calculation. This work proposes a developed CFD model for natural convection and conduction heat transfer to numerically investigate the combined influence of the perforations’ shapes and their positions on the thermal performance of the flat plate HS. Additionally, the effect of the generated turbulent flow in the vicinity of the fins surfaces on the thermal performance of the proposed HS is examined, and the resulting data are discussed and analyzed. Validation of the proposed CFD model is achieved through additional experimental work.
The actual test rig and schematic diagram of the flat-plate HS is shown in Figure 1, which is comprising the measurements and control systems. Because the main aim of this study is to conduct a numerical investigation for the proposed CFD model, set of experiments were carried out to validate the proposed model. An aluminium HS equipped with four solid flat-plate fins were used. SolidWorks computer program was used to design the proposed HS before it was exported to the ANSYS Fluent code version 2019 R1 for meshing the computational model, and then conducting the numerical simulation. Each fin vertically connected to the HS base, and the exact dimensions of each fin are 1.0 mm thickness, 200 mm for length, and 50 mm for width. The required heat source was generated by using a 500Ω electric heat element, and 0.5 kW DC power supply that was used to control the supplied power accurately based on the needs of each testing condition. The output voltage and current were set according to the required heat flux of the previously designed testing conditions.
A digital oscilloscope was used to ensure the accuracy of the supplied power according to the designed experiments for this study. Besides, the flat-plate fins were connected vertically to a horizontal aluminium HS base. The thermal contact between the HS base and fins was assured by using a thermo-paste between the contact surfaces. Equal distances of 6.5 cm were set between the flat-plate fins aiming to achieve an even heat distribution from the heat source to the fins. A thermal insulation made of fiberglass wool with aluminium foil as a heat reflector was set at the bottom of the heat sink as shown in Figure 1. The low thermal conductivity of ≤0.034 W/m.K is to ensure that the heat sink base is fully insulted and the heat only flows from heat source to the fins. At each test, eight K-type thermocouples were used to measure the fin surface temperature (Tfin) of the flat-plate fins at the evenly distributed locations. The K-type thermocouple temperature resolution is 0.1℃. In addition, digital thermocouple thermometers type HT-9815 were used to display and measure the real-time temperature from the surfaces during the conducted experiments. The thermocouple thermometer’s accuracy is ±1℃.
Figure 1. HS test rig schematic diagram, an actual photo with major annotations and SolidWorks design (side-view) with dimensions details
3.1 Geometry
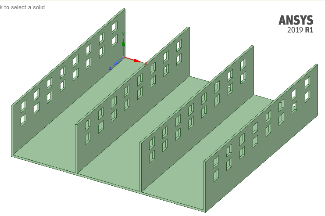
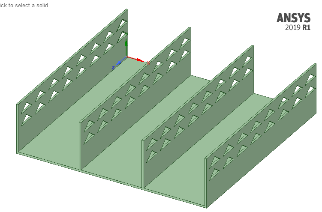
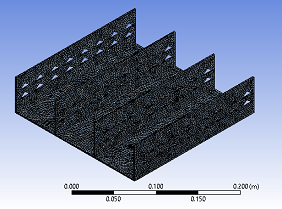
The proposed flat-plate heat sink geometry was designed by using a SolidWorks software program and numerically examined using ANSYS Fluent code version 2019 R1. The dimensions of the proposed model were set based on the tested geometry where the required validation for the proposed numerical CFD model was performed. Three perforation zones (positions) were chosen, namely as a top, middle, and bottom, as shown in Figure 2. Besides, three perforations shapes were selected, namely circle, square, and triangle, to be tested at each perforation position in a testing matrix. The perforations were arranged in a regular matrix made of two rows and multi-columns. In order to make comparable testing conditions, the cut surface area of 78.5 mm2 was set to be the same for all the used perforations.
|
(a) Top circular perforation |
(d) Top square perforation |
(g) Top triangular perforation |
|
(b) Mid. circular perforation |
(e) Mid. square perforation |
(h) Mid. triangular perforation |
|
(c) Bot. circular perforation |
(f) Bot. square perforation |
(i) Bot. triangular perforation |
Figure 2. Computational meshes and geometries (a-i) for the used perforated HSs
3.2 Computational mesh
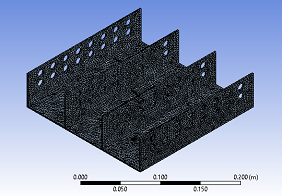
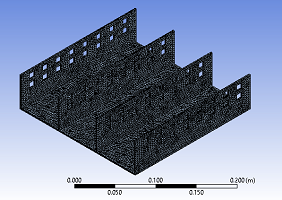
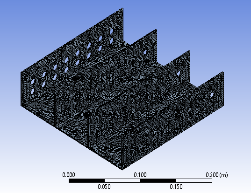
Figure 2 shows the adopted geometries and computational meshes of the perforated flat-plate HS with circular perforated fins. The HS enclosure was also included, as shown in Figure 3. A pre-processing meshing tool in the ANSYS Fluent was used to generate the computational mesh for the proposed CFD model comprising the HS and enclosure. Four mesh resolutions were tested to tackle the best mesh accuracy, starting from element numbers of 350e3 to 500e3 with an increment of 50e3 elements, as shown in Table 1(a). The mesh size of 400e3 elements was chosen because it gives the best possible simulation results and minimum calculation run time. As shown in Figure 3, the mesh consists of tetrahedral grids. However, at the sharp edges, where the triangular perforation was used, hexahedral grids were adopted for mesh stability. In general, the element size was set to 3.0 mm; meanwhile, the cell size at the sharp edges was set to be 2.0 mm. Consequently, the total elements’ number comprised in the selected mesh was 400e3 elements. Table 1(a) shows the mean value of ΔT between the HS base and enclosure. Moreover, the Nusselt number (Nu) values of the convective heat transfer were used to ensure the best elements’ number for the proposed CFD model in terms of calculation's time cost and computer's hardware complexity. It can be noticed from Table 1(a) that the difference in temperature between the HS surfaces and the enclosure (Tfin-T∞) and Nu values are stable after the element number is increased from 350e3 to 400e3 and go on reaching 500e3. Accordingly, the number of elements of 400e3 was chosen for conducting the CFD simulation for this study. Table 1(b) shows that a Tetrahedral element type with a growth rate of 1.2 are used. The maximum and minimum element sizes are 0.001 m and 0.00085 m respectively.
|
(a) Enclosure HS mesh domain and resolution |
(b) Perforated fin’s mesh domain and resolution |
Figure 3. Enclosure computational mesh and a zoomed in mesh sample for a circular-perforated HSs
Table 1. Mesh division statements (a) and mesh details (b)
|
(a) The Mesh Division Statements |
|||
|
Elements Number |
Tfin-T∞ |
Nu |
|
|
350,000 |
22.3 |
13.78 |
|
|
400,000 |
21.56 |
12.81 |
|
|
450,000 |
21.53 |
12.78 |
|
|
500,000 |
21.54 |
12.76 |
|
|
(b) The Mesh Details |
|||
|
Item |
Specifications |
||
|
Element type |
Tetrahedral |
||
|
Growth rate |
1.2 |
||
|
Max size |
0.001 m |
||
|
Min size |
0.00085 m |
||
|
skewness |
0.31 |
||
3.3 Boundary and initial conditions
The experimental testing conditions of this study were used to set up the boundary and initialization conditions of the proposed CFD model. An enclosure of air covered the model to create a contact region between the heat sink surfaces and air inside the enclosure, which represent the interface region to enrol the convection heat transfer and buoyancy effect phenomenon. At the beginning of the calculation, the enclosure air temperature and pressure were set at 298 K and 101.325 kPa, respectively, as listed in Table 2. Besides, the major air properties were selected and set up at the standard ambient air conditions. The metal properties of the aluminium HS were set, as shown in Table 3. Equal initial surface temperatures were set for all the HS surfaces to be at 300 K. The initial calculation pressure and temperature were set to be similar to the enclosure initial conditions (To=298 K and Po=101.325 kPa) while the airflow was set at a static condition (0.0 m/sec) inside the enclosure and near the fins' surfaces, as shown in Table 2. This is because selecting these options to make the numerical calculations more stable, and the results are closer to the real-time outcomes [25]. The bottom side of the model (heat sink base) was set up to be a fixed wall, and five supplied heat fluxes were used. The supplied heat fluxes of 1.0, 1.5, 2.0, and 2.5 kW/m2 were adopted for the experimental validation and numerical investigation. The numerical analysis was considered by depending on the SIMPLE algorithm method to couple the velocity and pressure. In addition, the second-order upwind scheme method was used to increase the accuracy of the discretizing of the convective terms in the governed equations. The convergence limits were set at 10e-4 for the momentum equations and 10e-6 for energy equations. Besides, the convergence criteria for residuals was set at 10e-8. It worth to be mentioned that the Boussinesq approximation was used to simulate the buoyancy effect of the ambient air caused by the natural convection heat transfer from the HS surfaces to enclosure air.
Table 2. CFD simulation initial and boundary conditions
|
Ambient temperature |
298 K |
Initial inlet pressure (Po=Pgauge) |
0.0 kPa |
|
Ambient pressure |
101.325 kPa |
Applied heat fluxes in (W/m2) |
1000, 1500, 2000, 2500 |
|
HS base temperature |
300 K |
Initial air velocity |
0.0 m/sec |
|
Initial fin surface temperature |
300 K |
Humidity |
36 % |
|
Perforation shape |
circular, rectangular, triangular |
Perforation position |
bottom, middle, top |
|
Convergence criteria |
10-8 |
||
Table 3. Properties of air and aluminum
|
Air |
Aluminum |
||
|
Viscosity (kg/m.sec) |
1.79 e-05 |
Material name (aluminum) |
1060-H12 |
|
Density (kg / m3) |
1.22 |
Density (g/mm3) |
0.002705 |
|
Specific heat (J/kg.℃) |
1006.43 |
Specific heat (J/kg.℃) |
900 |
|
Thermal conductivity (W/m. K) |
0.0242 |
Thermal conductivity (W/m.K) |
230 |
3.4 Numerical modelling: Governing equations
The investigated CFD model involved three governing stages of heat transfer from the heat source to the surrounding. Firstly, direct supplies of heat flux were applied at the bottom surface of the proposed HS base. Five values of the subjected heat flux were chosen, as shown in Table 2. Secondly, the supplied heat would be transferred by conduction inside the HS body, starting from the HS base toward the fins. Finally, the heat would be transferred by convection from the HS surfaces (base and fins) to the surrounded atmosphere (HS enclosure). Besides, the heat transfer by convection from the HS surfaces would be carried out by the working fluid (air) via the buoyancy effect. The turbulent flow nearby the surfaces and at the vicinity of perforations could also play an important role in improving the convection heat transfer. Therefore, in order to mathematically govern the three main stages of the aforementioned heat transfer methods, the governing equations from Eq. (1) to Eq. (12) were used. These governing equations can be described and summarized as follows:
1. Continuity equation can be expressed, as shown in Eq. (1).
$\frac{\partial u}{\partial x} i+\frac{\partial v}{\partial y} j+\frac{\partial w}{\partial z} k=0$ (1)
2. The Momentum equations for the three-dimension coordinates are defined in Eqns. (2)-(4).
$-\frac{\partial p}{\partial x}+\mu\left(\frac{\partial^2 u}{\partial x^2}+\frac{\partial^2 u}{\partial y^2}+\frac{\partial^2 u}{\partial z^2}\right)=\rho\left(u \frac{\partial u}{\partial x}+v \frac{\partial u}{\partial y}+w \frac{\partial u}{\partial z}\right)$ (2)
$-\frac{\partial p}{\partial y}+\mu\left(\frac{\partial^2 v}{\partial x^2}+\frac{\partial^2 v}{\partial y^2}+\frac{\partial^2 v}{\partial z^2}\right)=\rho\left(u \frac{\partial v}{\partial x}+v \frac{\partial v}{\partial y}+w \frac{\partial v}{\partial z}\right)$ (3)
$-\frac{\partial p}{\partial z}+\mu\left(\frac{\partial^2 w}{\partial x^2}+\frac{\partial^2 w}{\partial y^2}+\frac{\partial^2 w}{\partial z^2}\right)=\rho\left(u \frac{\partial w}{\partial x}+v \frac{\partial w}{\partial y}+w \frac{\partial w}{\partial z}\right)$ (4)
3. Energy equation for the fluid phase flow can be represented by Eq. (5).
$u \frac{\partial T}{\partial x}+v \frac{\partial T}{\partial y}+w \frac{\partial T}{\partial z}=\frac{\mathrm{k}}{\rho c}\left(\frac{\partial^2 T}{\partial x^2}+\frac{\partial^2 T}{\partial y^2}+\frac{\partial^2 T}{\partial z^2}\right)$ (5)
4. Energy equation for the solid phase state can be represented by Eq. (6).
$0=\left(\frac{\partial^2 T}{\partial x^2}+\frac{\partial^2 T}{\partial y^2}+\frac{\partial^2 T}{\partial z^2}\right)$ (6)
The entire flow of the air through the perforations and near the wall of the HS fins was assumed as a turbulent flow. Therefore, Re-Normalisation Group k-epsilon (RNG k-ε) turbulence model was used to numerically investigate and analyse the turbulence flow inside the enclosure [25]. It is worth to be mentioned that the Boussinesq approximation was used for the proposed model to simulate the buoyancy effect of the moving air caused by the density variation throughout the convection heat transfer. The governing equations of the turbulent flow can be defined in Eqns. (7)-(10), and for Boussinesq approximation is defined in Eqns. (11) and (12).
A- RNG k-ε mathematical model.
$\frac{\partial(\rho k)}{\partial t}+\operatorname{div}(\rho k U)=\operatorname{div}\left[a_k \mu_{e f f} \operatorname{grad} k\right]+\tau_{i j} \cdot S_{i j}-\rho \varepsilon$ (7)
$\frac{\partial(\rho k)}{\partial t}+\operatorname{div}(\rho \varepsilon U) =\operatorname{div}\left[a_{\varepsilon} \mu_{e f f} \operatorname{grad} \varepsilon\right] +C_{1 \varepsilon} \frac{\varepsilon}{k} \tau_{i j} \cdot S_{i j}-C_{2 \varepsilon} \rho \frac{\varepsilon^2}{k}$ (8)
$\tau_{i j}=2 \mu_t S_{i j}-\frac{2}{3} \rho k \sigma_{i j}$ (9)
$\mu_{e f f}=\mu+\mu_t, \mu_t=\rho C_\mu \frac{k^2}{\varepsilon}$ (10)
where: $C_\mu=0.0845, a_k=a_{\varepsilon}=1.39, C_{1 \varepsilon}=1.42, C_{2 \varepsilon}=1.68$
B- Boussinesq approximation.
$\overline{u_i^{\prime} u_j^{\prime}}=2 v_t S_{i j}-\frac{2}{3} k \sigma_{i j}$ (11)
$-\overline{u_j^{\prime} T_a^{\prime}}=\frac{C p v_t}{P r_t} \cdot \frac{\partial T_a}{\partial x_j}$ and $\mathrm{S}_{\mathrm{ij}}=\frac{\partial u_i}{\partial x_j}+\frac{\partial u_j}{\partial x_i} / 2$ (12)
where: Sij is the mean strain rate tensor.
In order to obtain a better understanding of the heat flow inside the fin's body and regions near fins surfaces and the enclosure, a numerical investigation was conducted for the proposed CFD model. In this section, the CFD model was first validated by comparing the experimental and numerical temperature distribution results of the solid fin. Secondly, an overall uncertainty analysis for the measurement devices of the tested HS was performed. Finally, the verified CFD model was used to numerically investigate the combined effect of the perforation shapes namely circular, square, and triangular and their positions namely bottom, middle, and top on the HS thermal performance.
4.1 Model validation
To ensure the accuracy of the proposed CFD model, the achieved numerical results of the solid fins’ HS were validated experimentally [19], as shown in Figure 4. Comparisons between the experimental and numerical results of the measured temperature at the fins’ surfaces were performed in this study. The comparisons comprised four heat flux values used as a heat source for the proposed HS. It can be noticed from Figure 4 that the fins surface temperatures show an acceptable match between the acquired experimental and numerical results. The maximum differences of 1.7% and 2.14% are noticed when the supplied heat flux of 2000 W/m2 is used. Whereas, a smaller variance percentage can be observed by less than 1.0% when the supplied heat fluxes of 1000 and 2500 W/m2 are used. The variance between the experimental and numerical results could be mainly attributed to the assumptions made for the CFD model, such as an adiabatic boundary condition and static air mass inside the enclosure. Adiabatic boundary conditions mean that the heat cannot be transferred from the enclosure domain and HS base to the surrounding [26]. Assuming a non-moving mass of air inside the enclosure as an initial condition could play a significant role in the results’ variations. Both reasons can lead to the rise of the Tfin caused by greater heat conducted inside the fins body when the condition is adiabatic [27]. Another reason is the value of the supplied power, which could slightly different at the actual testing compared with the accurate value of the CFD settings.
Figure 4. Comparison between the experimental and numerical Tfin results of the solid fins HS
4.2 Uncertainty analysis
The uncertainty of the measurement apparatuses for different thermocouple measurement points was calculated based on Eqns. (13), (14) and (15) [28, 29].
The average value of the measurement $(\overline{\boldsymbol{X}})$ is shown in Eq. (13).
$\bar{X}=\frac{\sum X_m}{n}$ (13)
where, n is the number the measurements, and the measured value is Xm. The standard deviations (SD) for the measurements are calculated from Eq. (14).
$S D=\sqrt{\frac{\sum_{m=1}^n\left(X_m-\bar{X}\right)^2}{(n-1)}}$ (14)
The uncertainty values (U) are calculated from Eq. (15).
$U=\frac{S D}{\sqrt{n}}$ (15)
The uncertainty values of thermocouple one (T1) to thermocouple 12 (T12) are listed in Table 4. The experiments comprised all the tested powers from 1000W to 2500W. As shown in Table 4, the maximum uncertainty value was obtained as ±0.69℃ at T10 and T11 in the validation experiments of the HSs' that is equipped with the non-perforated fins. In contrast, the minimum uncertainty value was attained as ±0.12℃ at T7 in the performed validation experiments. The major uncertainties found in the validation experiments could be attributed to the errors in the used testing devices such as the used k-type thermocouples and the fins measurements. Some reading errors were noticed in the temperature differences in the conducted experiments with a maximum error percentage of 0.23%. The physical dimensions of the fins array were measured using an accurate measuring tape for the lengths with an error in the measured dimensions of about 0.6%. According to the manufacturer's datasheet, the error percentage of the used plate thickness measurement is 0.25%. The losses in the transferred heat by conduction between the HS surface and the thermocouple ends were disregarded. Moreover, the error caused by the internal resistance of the aluminium plate was also ignored. Based on the presented preceding errors, the overall error percentage in the measurement does not exceed the limit of 2% which can be considered within the acceptable common limit.
Table 4. Uncertainty values of the measurement equipment (Thermocouples: T1-T12) for different supplied power
|
Thermocouple NO. |
U (Uncertainty) [℃] |
|||
|
1000 W |
1500 W |
2000 W |
2500 W |
|
|
T1 |
0.37 |
0.65 |
0.48 |
0.50 |
|
T2 |
0.55 |
0.65 |
0.43 |
0.34 |
|
T3 |
0.46 |
0.63 |
0.56 |
0.43 |
|
T4 |
0.50 |
0.61 |
0.62 |
0.23 |
|
T5 |
0.59 |
0.63 |
0.34 |
0.23 |
|
T6 |
0.52 |
0.48 |
0.65 |
0.46 |
|
T7 |
0.54 |
0.42 |
0.25 |
0.12 |
|
T8 |
0.44 |
0.58 |
0.46 |
0.33 |
|
T9 |
0.56 |
0.52 |
0.34 |
0.34 |
|
T10 |
0.42 |
0.69 |
0.47 |
0.24 |
|
T11 |
0.37 |
0.69 |
0.66 |
0.31 |
|
T12 |
0.65 |
0.60 |
0.48 |
0.25 |
4.3 Temperature distribution and heat transfer coefficient
The numerical results of the proposed CFD model will be presented and discussed as follows. Section 5.2.1 reports the effect of the perforations’ positions (bottom, middle, top) on the thermal performance of the used HS. Section 5.2.2 will discuss the effect of the used perforation geometry (circular, triangular, square) on the thermal performance of the adopted HS. The combined effect of the perforation position and geometry on the natural convection heat transfer inside the enclosure, and the behaviour of the conduction heat transfer will be discussed and analysed with the aforementioned subsections.
Figure 5. HSs’ temperature distribution contours of the enclosure and fins at 1000 W/m2 heat supply
4.3.1 Effect of perforations positions
Figures 5-8 show the contour of the temperature distribution of air inside the boundary of the determined enclosure (air), and the aluminium fins of the tested HS. The results of the adopted supplied heat fluxes from 1000W/m2 to 2500W/m2 are demonstrated in Figures 5-8, respectively. Three perforations shapes (circular, triangular and square) are used. At each shape, three positions (bottom, middle and top) are examined. As shown in Figures 5-8, generally, the enclosure temperature distribution of the nonperforated HS is more even compared to the perforated HS. In contrast, the top layer temperature of the HS enclosure is reduced when the HS fins are perforated at all the supplied heat fluxes. In terms of the position, the top layer temperature reduces when the perforation position is moved from bottom to top. Whereas the bulk air temperature of the enclosure becomes hotter when the perforations position moved from top to bottom. This may explain the buoyancy effect in raising the warm air upward making the enclosure top layer warmer [30]. Consequently, the rising airflow is increased carrying more heat from the heat sink to surroundings. Besides, it can be observed that the turbulent flow is generated at the enclosure and perforation vicinity. Practically, increasing the amount of the generated turbulent flow at the vicinity of the perforations could potentially enhance the convection heat transfer from the HS surfaces to the enclosure. This could raise the bulk air temperature, and partially increases the buoyancy effect in enhancing heat dissipation rate from the heat source to surroundings. Nevertheless, over increasing the turbulent flow more than the required limits could adversely affect the buoyancy effect, and then partially suppresses the gained improvement in the heat dissipation rate. Practically, the nature of turbulent flow has a rounding shape, which can partly barrier the buoyant air. This can partly trap the warmer air near the HS base leaving the top layer colder when the positions of the perforations are moved from bottom to top, as shown in Figures 5-8.
Figure 6. HSs’ temperature distribution contours of the enclosure and fins at 1500 W/m2 heat supply
Figure 7. HSs’ temperature distribution contours of the enclosure and fins at 2000 W/m2 heat supply
Figure 8. HSs’ temperature distribution contours of the enclosure and fins at 2500 W/m2 heat supply
It can be observed that the position of the used perforations could influence the conduction and the convection heat transfer of the proposed perforated HS, as shown in Figures 5-8. In this study, the fin top surface temperature is used as reasonable indications to evaluate the perforation position effect on the HS thermal performance. On other word, greater Tfin at the fin top means greater heat is transferred by conduction, and consequently a larger heat would be dissipated to the surrounding [31]. Therefore, if the heat could be transferred faster from the heat source to the HS fins, this could result in better thermal performance, which is the main aim of the proposed CFD model for this study. The enhanced thermal performance with the use of move of perforations from bottom to top could be attributed to two main reasons. Firstly, the nonperforated bottom two third at the top position gives more media for heat to be transferred inside fin’s body increasing the whole Tfin including fins top.
Rising the Tfin alongside the HS fins could increase the bulk air temperature and at the perforations' vicinity. This reduces the air density at these regions and then increase the air mass flow rate enhancing the heat transfer by convection from the HS to enclosure. This could consequently increase the heat transfer by conduction from the heat source to the fins as it largely depends on two points temperature differences which are targeted fin’s surface temperature and heat source surface temperature [32]. Secondly, the even temperature distribution over the HS surfaces could play a significate role in increasing the heat dissipation rate from the HS to the surrounding. Increasing the turbulence flow inside and at the vicinity of used perforations could potentially increase the carried heat for the HS to the enclosure.
4.3.2 Effect of perforation shapes
In order to highlight the influence of the perforation shape and its associated effect with their position on the HS thermal performance, the numerical results of the CFD models are organized into bar charts as shown in Figures 9-12. In addition to the value of the temperature difference (ΔT=Tbase-Ttop) which are shown in Figures 10-12(a), the results of h are demonstrated in Figures 9-12(b). The value of h is calculated according to Equation 16 [27] based on the mean value of the Tfin and T∞. It can be noticed from Figures 9-12(a) that the value of ΔT is the smallest for solid fins at all the tested conditions meanwhile it tends to increase when the HS fins are perforated. Moreover, the value of ΔT is generally increased when the position of the perforations is moved from the bottom to top at most of the used perforation shapes and tested supplied heat fluxes (1000 W/m2-2500 W/m2). Particularly, the value of ΔT starts increasing at circular perforations and become greater when the square perforations are used whereas the maximum ΔT is recorded at the triangular perforation, as shown in Figures 9-12(a). Compared to solid fins, the minimum ΔT increment is about 15.6% when fins are circular perforated and top positioned at 2000 W/m2. Whereas the maximum ΔT of 143.5% is noticed when fined are triangular perforated and bottom located at 1500 W/m2.
$\dot{Q}=h \cdot A_s \cdot\left(T_{\text {fin,mean }}-T_{\infty}\right)$ (16)
The performance of the temperature distribution over the used fins could be attributed to three main reasons. Firstly, the removed mass of metal due to perforations could reduce the heat transfer by conduction inside the perforated fins compared with the solid fins [33]. This might result in less heat transferred from the HS base to the top of the fins where the Ttop is measured. When the perforation position is moved downward near the HS base, the impact of the reduced thermal conductivity became greater rising the value of ΔT. This is caused by the heat accumulation that might occur at the bottom of the HS fins due to the decreased thermal conductivity at this region of the fins. Secondly, at the bottom perforations and at all perforation shapes, the supplied heat could be highly trapped at the bottom side of the fins where the HS base is also hot. This means the enclosure air at that part is also hot compare to the other rest of the enclosure. This could potentially reduce the buoyancy effect due to the reduced ΔT between the air film near the fins and enclosure air which could potentially decrease the turbulence at this region [34]. As a result of this, the heat transferred by convection is reduced leaving the top of the fins at minimum temperature value. On the other side, when the perorations moved upward, the ΔT between air film and the enclosure become bigger increasing the buoyancy effect. Consequently, the heat dissipation rate is increased resulting in a smaller value of ΔT and a greater value of h. Thirdly, perforation shape plays a significant role in the thermal performance of the proposed CFD model. It was proven that the circular perforation could significantly enhance the turbulence flow at the vicinity of the perforations at the natural convection heat transfer [35]. This could be clearly noticed from Figures 9-12 when the value of ΔT is the smallest at the circular perforation shape compare to that of square and triangular perforations. Consequently, the temperature distribution could be more even over the HS fins, and as a result, the value of h is grater at the circular perforations compared with that of solid, triangular and square perforations.
Figures 9-12(b) show that the value of h increases when all the perforations are used compare with the solid fins at all the supplied heat fluxes. The h increment is ranging between approximately 10% to 29.6% when the HS fins are circular perforated and top positioned at supplied heat flux between 1000 W/m2 to 2500 W/m2. This enhanced h performance is more consistent in terms of perforations positions when the triangle perforation shape is used. However, the uneven Tfin distribution and extremely elevated ΔT could significantly deteriorate the gained improvement in the HS thermal performance. Similarly, for the square perforated HS, the h is greater compare to the circular perforated HS and solid HS but the ΔT value demonstrates less even distribution over the HS fins, as shown in Figures 9-12(a). Less even temperature distribution over the HSs’ surfaces could lead to creating two surfaces’ regions, less heated and overheated, which can result in two major facts. Firstly, the less heated surfaces will increase the penalty in the amount of the exchanged heat between the surfaces and the enclosure. This is caused by smaller air density differences between the air film near the HS surfaces and the surrounded air of the enclosure [36] as both regions are relatively cooled. Secondly, meanwhile, the threshold region, which is located between the less and overheated regions, works optimally, the overheated regions could adversely perform thermally. This could be also attributed to the reduced density difference between air film near the overheated fin surfaces and the surrounded zones. This could significantly decrease the flow of heat from HS to the enclosure reducing the value of h and thus less heat dissipation rate. Consequently, the thermal performance represented by the heat dissipation rate from the fin surface to the surrounding could be considerably reduced. This gives the optimum thermal performance to the circularly perforated HS at all the tested supplied power. When the HS fins are circular perforated, the temperature is more evenly distributed compared to the other perforated fins and h is higher than the solid fins. As a result, the proposed CFD model with circular perforated and top positioned fins can be considered the best in terms of the overall thermal performance of the proposed heat sink CFD model.
(a)
(b)
Figure 9. (a) Temperature difference (Tbase – Ttop), (b) Heat transfer coefficient (h) at 1000 W/m2 heat supply
(a)
(b)
Figure 10. (a) Temperature difference (Tbase – Ttop), (b) Heat transfer coefficient (h) at 1500 W/m2 heat supply
(a)
(b)
Figure 11. (a) Temperature difference (Tbase – Ttop), (b) Heat transfer coefficient (h) at 2000 W/m2 heat supply
(a)
(b)
Figure 12. (a) Temperature difference (Tbase – Ttop), (b) Heat transfer coefficient (h) at 2500 W/m2 heat supply
A new multi-dimensional CFD model is proposed aiming to improve the thermal performance of a flat-plate heat sink equipped with solid and perforated flat-plate fins. To ensure the accuracy of the CFD model, the attained numerical results of the solid fins were experimentally validated. The numerical investigation was conducted under natural convection heat transfer environment and at a wide range of supplied heat fluxes (1000, 1500, 2000, and 2500 W/m2). Accordingly, the associated effect of the perforations' shapes and their positions on the thermal performance was numerically investigated. The perforations’ shapes were adopted namely circular, square, and triangular. For each perforation shape, three positions were chosen namely bottom, middle and top to put a perforations matrix. The major conclusions can be outlined as follows:
1. When the heat sink fins are perforated, the temperature distribution inside the heat sink enclosure is less even. The turbulent flow is developed inside the enclosure and near fins surfaces. The temperature difference between the bottom and top of the fins is increased. In terms of the perforation shape, the circular perforation performs the best compared to the other perforation shapes although the temperature difference is slightly greater by about 20% than the solid fin which is caused by the reduction in the thermal conductivity. Regarding the perforation position, the top position demonstrated the best thermal performance as it balanced between the down weight merit, developed turbulent flow and more uniform distribution temperature over the heat sink fins’ surfaces. On the other side, regardless of the position of the perforations, the triangular perforation performed the worst where the maximum temperature difference is noticed. It increases by about 148% compared to that of solid fins.
2. The heat transfer coefficient is increased when the heat sink’s fins are perforated regardless of the perforations’ shapes and positions compared with solid fins. The behavior of the heat transfer coefficient is enhanced when the circular perforation shape is used, and the position of the perforation’s matrices are moved to the top. The heat transfer coefficient increases by 10.7% and 29.6% at the middle and top positions respectively. The increase in the heat transfer coefficient could be attributed to the enhanced heat dissipation rate to the enclosure air. This could be caused by the turbulence flow generated at the enclosure and vicinity of the circular perforations carrying extra heat from the fin’s surfaces to the surrounded air. When the triangular perforation is used, the heat transfer coefficient is also increased by 13.8% but the uneven fins temperature distribution and the extremely elevated temperature difference can significantly cancel out the gained enhancement. Therefore, regarding the heat dissipation rate from the heat source to the surroundings, heat transfer coefficient and the overall temperature distribution over the fins, it can be concluded that the overall thermal performance performs the best among the other proposed models when the fins are circularly perforated and positioned at the top.
[1] Obaid, A.J., Hameed, V.M. (2023). An experimental and numerical comparison study on a heat sink thermal performance with new fin configuration under mixed convective conditions. South African Journal of Chemical Engineering, 44: 81-88. https://doi.org/10.1016/j.sajce.2023.01.009
[2] Karaeva, A., Magaril, E., Al-Kayiem, H.H. (2023). Review and comparative analysis of renewable energy policies in the European Union, Russia and the united states. International Journal of Energy Production and Management, 8(1): 11-19. https://doi.org/10.18280/ijepm.080102
[3] Ahmed, H.E., Salman, B.H., Kherbeet, A.S., Ahmed, M.I. (2018). Optimization of thermal design of heat sinks: A review. International Journal of Heat and Mass Transfer, 118: 129-153. https://doi.org/10.1016/j.ijheatmasstransfer.2017.10.099
[4] Abbas, A.S., Mohammed, A.A. (2023). Enhancement of plate-fin heat exchanger performance with aid of (RWP) vortex generator. International Journal of Heat and Technology, 41(3): 780-788. https://doi.org/10.18280/ijht.410336
[5] Shaeri, M.R., Bonner, R.W. (2019). Analytical heat transfer model for laterally perforated-finned heat sinks. International Journal of Heat and Mass Transfer, 131: 1164-1173. https://doi.org/10.1016/j.ijheatmasstransfer.2018.11.138
[6] Lopes, A.M.G., Costa, V.A.F. (2019). Improved radial plane fins heat sink for light-emitting diode lamps cooling. Journal of Thermal Science and Engineering Applications, 12(4): 041012. https://doi.org/10.1115/1.4045695
[7] Nilpueng, K., Wongwises, S. (2021). Thermal performance investigation of a plate fin heat sink equipped with twisted tape and perforated twisted tape. Journal of Thermal Science and Technology, 16(2): JTST0024-JTST0024. https://doi.org/10.1299/jtst.2021jtst0024
[8] Kusuma, A.C., Harsito, C., Rachmanto, R.A., Arifin, Z. (2021). The effect of copper-aluminium perforated heat sink to improve solar cell performance. IOP Conference Series: Materials Science and Engineering, 1096(1): 012048. https://doi.org/10.1088/1757-899x/1096/1/012048
[9] Gupta, D., Saha, P., Roy, S. (2021). Computational analysis of perforation effect on the thermo-hydraulic performance of micro pin-fin heat sink. International Journal of Thermal Sciences, 163: 106857. https://doi.org/10.1016/j.ijthermalsci.2021.106857
[10] Sahel, D., Bellahcene, L., Yousfi, A., Subasi, A. (2021). Numerical investigation and optimization of a heat sink having hemispherical pin fins. International Communications in Heat and Mass Transfer, 122: 105133. https://doi.org/10.1016/j.icheatmasstransfer.2021.105133
[11] Kumar, S., Kumar, A., Darshan Kothiyal, A., Singh Bisht, M. (2018). A review of flow and heat transfer behaviour of nanofluids in micro channel heat sinks. Thermal Science and Engineering Progress, 8: 477-493. https://doi.org/10.1016/j.tsep.2018.10.004
[12] Ibrahim, T.K., Mohammed, M.N., Mohammed, M.K., Najafi, G., Sidik, N.A.C., Basrawi, F., Abdalla, A.N., Hoseini, S.S. (2018). Experimental study on the effect of perforations shapes on vertical heated fins performance under forced convection heat transfer. International Journal of Heat and Mass Transfer, 118: 832-846. https://doi.org/10.1016/j.ijheatmasstransfer.2017.11.047
[13] Awasarmol, U.V., Pise, A.T. (2015). An experimental investigation of natural convection heat transfer enhancement from perforated rectangular fins array at different inclinations. Experimental Thermal and Fluid Science, 68: 145-154. https://doi.org/10.1016/j.expthermflusci.2015.04.008
[14] Al-Doori, W. (2011). Enhancement of natural convection heat transfer from the rectangular fins by circular perforations. International Journal of Automotive and Mechanical Engineering (IJAME), 4: 428-436. http://dx.doi.org/10.15282/ijame.4.2011.5.0035
[15] Nada, S., Said, M. (2019). Effects of fins geometries, arrangements, dimensions and numbers on natural convection heat transfer characteristics in finned-horizontal annulus. International Journal of Thermal Sciences, 137: 121-137. https://doi.org/10.1016/j.ijthermalsci.2018.11.026
[16] Chiu, H.C., Youh, M.J., Hsieh, R.H., Jang, J.H., Kumar, B. (2023). Numerical investigation on the temperature uniformity of micro-pin-fin heat sinks with variable density arrangement. Case Studies in Thermal Engineering, 44: 102853. https://doi.org/10.1016/j.csite.2023.102853
[17] Feng, S.S., Shi, M., Yan, H.B., Sun, S., Li, F.C., Lu, T.J. (2018). Natural convection in a cross-fin heat sink. Applied Thermal Engineering, 132: 30-37. https://doi.org/10.1016/j.applthermaleng.2017.12.049
[18] Bouchenafa, R., Mohammed, H.A., Saim, R. (2019). Numerical study of the thermal and hydraulic performances of heat sink made of wavy fins. Mechanics and Mechanical Engineering, 23(1): 150-161. https://doi.org/10.2478/mme-2019-0021
[19] Hussain, A.A., Freegah, B., Khalaf, B.S., Towsyfyan, H. (2019). Numerical investigation of heat transfer enhancement in plate-fin heat sinks: Effect of flow direction and fillet profile. Case Studies in Thermal Engineering, 13: 100388. https://doi.org/10.1016/j.csite.2018.100388
[20] Shaeri, M.R., Yaghoubi, M. (2009). Numerical analysis of turbulent convection heat transfer from an array of perforated fins. International Journal of Heat and Fluid Flow, 30(2): 218-228. https://doi.org/10.1016/j.ijheatfluidflow.2008.12.011
[21] Huang, C.H., Chen, M.H. (2019). An estimation of the optimum shape and perforation diameters for pin fin arrays. International Journal of Heat and Mass Transfer, 131: 72-84. https://doi.org/10.1016/j.ijheatmasstransfer.2018.11.019
[22] Al-Damook, A., Kapur, N., Summers, J.L., Thompson, H.M. (2015). An experimental and computational investigation of thermal air flows through perforated pin heat sinks. Applied Thermal Engineering, 89: 365-376. https://doi.org/10.1016/j.applthermaleng.2015.06.036
[23] Balachandar, C., Arunkumar, S., Madhumitha, R., Venkatesan, M. (2019). MANFIS–GA heat transfer analysis and optimization of fins with elliptical perforation. Iranian Journal of Science and Technology, Transactions of Mechanical Engineering, 43(1): 567-577. https://doi.org/10.1007/s40997-018-0179-4
[24] Al-Essa, A.H., Al-Hussien, F.M.S. (2004). The effect of orientation of square perforations on the heat transfer enhancement from a fin subjected to natural convection. Heat and Mass Transfer, 40(6): 509-515. https://doi.org/10.1007/s00231-003-0450-z
[25] Balachandar, C., Arunkumar, S., Madhumitha, R., Venkatesan, M. (2019). MANFIS–GA heat transfer analysis and optimization of fins with elliptical perforation. Iranian Journal of Science and Technology, Transactions of Mechanical Engineering, 43(1): 567-577. https://doi.org/10.1007/s40997-018-0179-4
[26] Senthilkumar, P., Suyambazhahan, S., Suresh, P.R., Velraj, R. (2021). Enhancement of heat transfer performance in an aluminum heat sink using different nanocoatings. Journal of Enhanced Heat Transfer, 28(3): 41-61. https://doi.org/10.1615/JEnhHeatTransf.2021036375
[27] Çengel, Y.A., Ghajar, A.J. (2015). Heat and Mass Transfer, Fifth Edition. McGraw-Hill, New York, USA.
[28] Arat, H., Arslan, O., Ercetin, U., Akbulut, A. (2021). Experimental study on heat transfer characteristics of closed thermosyphon at different volumes and inclination angles for variable vacuum pressures. Case Studies in Thermal Engineering, 26: 101117. https://doi.org/10.1016/j.csite.2021.101117
[29] Senturk Acar, M., Arslan, O. (2018). Performance analysis of a new hybrid cooling–drying system. Environmental Progress & Sustainable Energy, 37(5): 1808-1828. https://doi.org/10.1002/ep.12832
[30] Karlapalem, V., Dash, S.K. (2023). On the enhancement of natural convection heat transfer with multi-branching fins. International Journal of Thermal Sciences, 183: 107868. https://doi.org/10.1016/j.ijthermalsci.2022.107868
[31] Ding, Y.D., Zhang, W.H., Deng, B., Gu, Y.H., Liao, Q., Long, Z.Z., Zhu, X. (2022). Experimental and numerical investigation on natural convection heat transfer characteristics of vertical 3-D externally finned tubes. Energy, 239: 122050. https://doi.org/10.1016/j.energy.2021.122050
[32] Balaji, C., Srinivasan,, B., Gedupudi, S. (2021). Heat Transfer Engineering Fundamentals and Techniques. Elsevier Inc. https://doi.org/10.1016/C2018-0-02085-X
[33] Deshmukh, R., Raibhole, V. (2023). Investigation of a natural convection heat transfer enhancement of a different shaped pin fin heat sink for different vertical fin spacing. Heat and Mass Transfer, 1-18. https://doi.org/10.1007/s00231-023-03395-3
[34] Jiu, Y., Fan, H.M., Wang, W. (2022). Investigation of a novel natural convection heat sink for LEDs based on U-shaped mini-heat pipe arrays. Applied Thermal Engineering, 204: 118000. https://doi.org/10.1016/j.applthermaleng.2021.118000
[35] Al-khafaji, O.R.S., Al-Muhsen, N.F. (2020). Associated effect of perforation position and diameter on thermal performance of plane fin under natural convection environment. Jurnal Teknologi, 82(5). https://doi.org/10.11113/jt.v82.14157
[36] Li, H.Y., Hu, C.Z., He, Y.C., Tang, D.W., Wang, K.M., Huang, W.G. (2021). Effect of perforated fins on the heat-transfer performance of vertical shell-and-tube latent heat energy storage unit. Journal of Energy Storage, 39: 102647. https://doi.org/10.1016/j.est.2021.102647