Gang Deng | Jin Chen![]() | Zaohong Zhou*
| Zaohong Zhou*![]() | Hongyan Chen
| Hongyan Chen![]()
© 2023 IIETA. This article is published by IIETA and is licensed under the CC BY 4.0 license (http://creativecommons.org/licenses/by/4.0/).
OPEN ACCESS
Drawing upon the voluntary agreement mechanism for emission reduction, an evolutionary game model has been developed between construction firms and building energy efficiency service companies. This model seeks to elucidate the drivers that prompt construction firms to engage in voluntary energy efficiency agreements and compels energy efficiency service companies to deliver superior services under varied socio-economic conditions. Insights were derived from extensive study and enhancement of game theory. The study reveals that the convergence of the game system to a favorable Evolutionarily Stable Strategy (ESS) is contingent on the associated benefits and costs for both entities when rendering the service. Furthermore, the efficacy and distribution of energy efficiency incentives play a pivotal role. To foster the sustainable growth of decarbonization within construction entities and the market for building energy services, participants of the game ought to bolster technological advancements, cement collaboration between industrial, academic, and research sectors, augment transparency in information dissemination, and elevate consciousness regarding societal responsibility, energy conservation, and environmental protection. This model provides valuable insights for policymakers to frame effective strategies that boost engagement from all game participants, thereby fostering the growth of the building energy conservation sector. It also offers a robust framework for future collaborative efforts between industry, academia, and research establishments.
voluntary agreement, carbon emissions, energy service company, evolutionary game
During the 75th General Debate of the United Nations General Assembly, a solemn commitment was made by China to "achieve peak carbon and carbon neutrality" [1]. With its rapid urbanisation and swift economic progression, China has been identified as the world's largest carbon emitter [2], resulting in immense pressure to curb emissions [3]. Notably, the construction industry, a pivotal component of China's economic propulsion, has consistently been accountable for approximately 50% of the nation's direct and indirect carbon emissions [4]. As such, the green and energy-efficient advancement of the construction sector is deemed crucial in meeting the dual carbon objective [5]. This study seeks to investigate the potential for construction companies and energy conservation service entities to establish a voluntary emission reduction accord, facilitated by effective governmental incentive policies, thereby fostering optimal emission reduction efficiency and aiding in the realisation of carbon peaking and neutrality targets.
Historically, efforts have been made by China to identify effective methods of reducing energy consumption and addressing climate change. These methods have been categorised into three paradigms: mandatory, market-based, and voluntary [6]. Traditional approaches encompassed enforced emission reductions through stringent "top-down" governance paradigms, which were observed to induce elevated administrative costs and diminished flexibility [7], potentially detrimentally impacting economic growth. An alternative, the Energy Performance Contract (EPC) model, serves as a market-oriented approach to regulate energy efficiency and emission reductions. In this framework, energy saving service entities, commonly referred to as ESCOs, are engaged to deliver an array of services, from energy project design to project financing and energy management, thereby generating revenue [8]. Nonetheless, it has been noted that the building energy efficiency service market in China remains nascent, with ESCOs encountering elevated risks due to considerable initial investments, extensive payback periods, and technical limitations [9]. Additionally, the predominant objective of ESCOs to attain maximum economic gains could potentially result in the delivery of subpar services for short-term profitability. This inclination has led to prevalent information asymmetry and augmented investment risks, thereby impeding the adoption of energy-efficient services by property owners [10].
With the global surge in sustainable development concepts and an elevated societal awareness towards environmental conservation [11, 12], voluntary environmental behaviour has garnered increased attention from diverse governmental bodies and societal organisations [13]. This has been demonstrated to stimulate enterprises' proactive environmental protection measures, advocating its viability as an environmental governance strategy [14]. Subsequently, the emergence of the voluntary agreement mechanism was observed [15]. Despite its potential benefits, such as the prevention of pollution, enhancement of the economy, and fostering of innovations [16-18], criticisms regarding its lack of motivation and insufficient binding force have been highlighted [19], suggesting its mere ceremonial implementation rather than producing tangible outcomes [20].
In examining the literature, a wealth of studies on building energy efficiency service markets and voluntary agreements has been noted. However, a limited exploration of the interaction between the energy efficiency service markets and voluntary environmental regulations exists. It has been observed that the behavioural decisions of energy efficiency service firms significantly influence the trajectory of the energy efficiency market, as well as the engagement of building firms in voluntary accords [21]. In this context, employing evolutionary game theory, an evolutionary game model is constructed in this research, centred around the utility of voluntary accords and energy efficiency services between building energy service firms and building entities. Analysing simulation outcomes under diverse scenarios aims to offer insights and policy recommendations for enhancing China's building energy efficiency service market and advocating voluntary energy efficiency agreements. The overarching goal remains the promotion of China's low-carbon transition in the building industry and the swift realisation of the "double carbon" objective.
2.1 Hypothesis formulation
Hypothesis 1: The impact of the energy management market on the engagement of building enterprises in voluntary agreements is explored. Only "fully voluntary implementation" type of voluntary agreements is taken into account, implying an absence of direct governmental intervention in the form of incentives or penalties. By default, enterprises are assumed to achieve the emission reduction targets set out in the voluntary agreements.
Hypothesis 2: The game model involves two primary players: construction enterprises and energy service companies. The likelihood of a construction enterprise opting to "engage in the voluntary agreement" is represented by x (0≤x≤1), while the probability of choosing to abstain is 1-x. Conversely, the probability of an energy management entity deciding to "deliver qualified services" is denoted by y (0≤y≤1), and the likelihood of "providing unqualified services" is represented by 1 - y.
Hypothesis 3: Upon the selection by building enterprises to engage in voluntary agreements, and the decision by energy efficiency service companies to offer qualified services, the following outcomes are anticipated. Given that consumers are perceived as rational and, to an extent, willing to incur higher costs for low-carbon products [21], the construction entity reaps additional revenue Re and compensates the energy efficiency service firm the foundational labour charge Fl. Furthermore, the building firm obtains a fraction of the voluntary agreement incentive V, as stipulated contractually (represented by a). Meanwhile, the energy efficiency service entity incurs an elevated service provision cost Ch but receives the labour charge Fl in addition to a portion (1-a) of the voluntary agreement incentive V. The constraint for this scenario is denoted as 0<a<1.
Hypothesis 4: In the event that a construction enterprise opts for engagement in the voluntary agreement, while the energy service company delivers non-qualified services, the construction entity incurs a loss Fd in the pursuit of the mandated emission reduction target. Additionally, the building enterprise garners extra revenue Re and disburses labour costs Fl. In such a scenario, the energy service firm defaults on the stipulated contract, not partaking in the "energy efficiency benefit sharing". Consequently, all proceeds V from the voluntary agreement are directed towards the building entity. The energy efficiency service firm is compensated solely with the fundamental labour charge Fl and disburses a reduced cost Clalong with penalty fees P to the building company. A constraint here is that Ch>Cl.
Hypothesis 5: If a construction entity refrains from participating in a voluntary agreement, it accumulates merely the basic revenue Rb. Depending on its modus operandi, the energy efficiency service entity incurs either a heightened Ch or diminished Cl operational cost, accompanied by penalty charges P.
See Table 1 for symbols and descriptions.
Table 1. Symbols and descriptions
|
Symbols |
Meaning and Description |
|
x |
The likelihood that a construction enterprise engages in the voluntary agreement is represented by x. Conversely, the probability of abstaining from participation stands at 1–x, where 0≤x≤1 |
|
y |
For the energy service company, the probability of committing to the provision of qualified services is denoted by y. The contrasting likelihood of refraining from providing such services is 1-y, subject to 0≤y≤1 |
|
V |
Rewards are designated for the fulfillment of the voluntary agreements |
|
Rb |
Construction enterprises inherently derive standard benefits from their production activities |
|
Re |
Additional advantages accrue to construction enterprises that opt for low-carbon production methodologies |
|
a |
In terms of the voluntary agreement incentives, the construction enterprises are allocated a fraction denoted by a. Conversely, the share apportioned to the energy service enterprise is 1-a |
|
Ch |
Energy service enterprises face elevated costs when they commit to delivering high-quality services |
|
Cl |
Alternatively, these enterprises encounter reduced expenditures when they choose to provide services of a lesser quality |
|
Fl |
The foundational labour compensation extended by construction enterprises to energy service entities is a consistent metric |
|
Fd |
Construction enterprises may incur supplementary costs when they independently endeavour to achieve emission reduction |
|
P |
In the event that an energy service enterprise delivers subpar, or low-quality services, a compensatory mechanism may be invoked to redress the inadequacies |
2.2 Construction of the payoff matrix
Drawing upon the preceding variables and hypotheses, a payoff matrix was formulated to capture the interactions between construction companies and energy service companies. As depicted in Table 2, each subsequent row delineates the utilities associated with the construction company and the energy service company respectively.
Table 2. Game theoretic payoff matrix for interactions between construction and energy service companies
|
Energy service company |
Construction Company |
|
|
Participation (x) |
No Participation (1-x) |
|
|
High Quality Services (y) |
Re–Fl+a*V, Fl-Ch+(1-a)*V |
Rb, -Ch |
|
Low Quality Services (1-y) |
Re–Fl –Fd+V+P, Fl–Cl -P |
Rb+P, -Cl-P |
3.1. Evolutionary game stability: Analysing the replicator equations
From the previously defined evolutionary game payoff matrix, expected benefits B1, B2, for construction firms with strategies either favouring or disfavouring "participation in voluntary agreements" were derived. Additionally, an average expected profit B̅ was determined as:
$\begin{gathered}B_1=y\left[R_e-F_l+\mathrm{a} * \mathrm{~V}\right]+(1-y)\left(R_e-\right. \left.F_l-F_d+V+P\right)\end{gathered}$ (1)
$B_2=y * R_b+(1-y)\left(R_b+P\right)$ (2)
$\bar{B}=x B_1+(1-x) B_2$ (3)
A By referencing the Malthusian dynamic equation [Webull], the replicator dynamic equation, capturing the behavioural strategy of construction firms, was extracted:
$\begin{gathered}B(x)=d x / d t=x(1-x)\left[(y-1) F_d-\right.\left.F_l-R_b+R_e+(a y-y+1) V\right]\end{gathered}$ (4)
In a similar vein, the expected benefits E11, E12 and the average expected benefits E̅ for energy service companies, choosing either to "provide qualified services" or "provide non-qualified services", were established as:
$E_1=x\left[F_l-C_h+(1-a) * V\right]+(1-x)\left(-C_l\right)$ (5)
$E_2=x\left(F_l-C_l-P\right)+(1-x)\left(-C_l-P\right)$ (6)
$\bar{E}=y E_1+(1-y) E_2$ (7)
Subsequently, the replicator dynamic equation, characterising the behavioural strategy of energy service companies, was deduced:
$\begin{gathered}E(y)=d y / d t=y(y-1)\left[C_h-C_l-P+\right. (a x-x) V]\end{gathered}$ (8)
Incorporating these findings, a two-dimensional dynamical system, denoted as L, was derived from equations B(x) and E(y):
$\left\{\begin{array}{l}d x / d t=x(1-x)\left[(y-1) F_d-F_l-R_b+R_e+(a y-y+1) V\right. \\ d y / d t=y(y-1)\left[C_h-C_l-P+(a x-x) V\right]\end{array}\right.$ (9)
In the two-dimensional dynamical system L, while dx/dt=0 and dy/dt=0, we can get (0, 0), (1, 0), (0, 1), (1, 1), (x* , y*) are the equilibrium points of the system, where $x^*=\frac{C_h-C_l}{(1-\mathrm{a}) \mathrm{V}}, y^*=$ $\frac{F_d+F_l+R_b-R_e-V}{F_d+(1-a) V}$. So there are 5 equilibrium points of the system L.
3.2. Analysing the stability of strategies within the evolutionary framework
Guided by Friedman's theoretical framework [22], the Jacobi matrix, denoted as J, was derived:
$J=\left[\begin{array}{ll}B_{11} & B_{12} \\ B_{21} & B_{22}\end{array}\right]$ (10)
For this matrix, the following elements were determined:
$\begin{aligned} B_{11}= & (1-2 x)\left[(y-1) F_d-F_l-R_b+\right. R_e+(a y-y+1) V\end{aligned}$ (11)
$B_{12}=x(1-x)\left[F_d+(a-1) V\right]$ (12)
$B_{21}=y(1-y)(1-a) V$ (13)
$B_{22}=(2 y-1)\left[C_h-C_l-P+(a x-x) V\right]$ (14)
Upon examination of the Jacobi matrix, values for B11, B12, B21 and B22 at the five equilibrium points were ascertained, as depicted in Table 3.
Table 3. Equilibrium points and corresponding eigenvalues
|
Equilibrium Points |
B11 |
B12 |
B21 |
B22 |
|
(0, 0) |
–Fd–Fl–Rb+Re +V |
0 |
0 |
–Ch +Cl+P |
|
(1, 0) |
Fd+Fl+Rb–Re–V |
0 |
0 |
–Ch +Cl+P–a*V+V |
|
(0, 1) |
–Fl–Rb+Re+a*V |
0 |
0 |
Ch–Cl-P |
|
(1, 1) |
Fl+Rb–Re–a*V |
0 |
0 |
Ch –Cl–P+a*V–V |
|
(x*, y*) |
0 |
-M |
-N |
0 |
where $M=\frac{-\left(C_h -C_l-P\right) *(F d +a * V - V) *\left(C_h-C_l-P+ a * V -V\right)}{(1-a)^2 V^2}, N=$ $\frac{(1-a) V\left(-F_l-R_b+R_e+a * V\right)\left(F_d+F_l+R_b-R_e-V\right)}{\left(F_d+a * V-V\right)^2}$
For a strategy to be deemed Evolutionarily Stable (ESS), it is essential that the rank of the Jacobi matrix is negative and its determinant remains positive. Intriguingly, the equilibrium point (x*, y*) was found not to adhere to this criterion.
Table 4. Stability analysis for Scenario 1
|
ESS |
Scenario 1 |
||
|
Fl+Fd>Re-Rb+V & Cl–P<Ch |
|||
|
Tr (J) |
Det (J) |
Stability |
|
|
(0, 0) |
- |
+ |
ESS |
|
(1, 0) |
+ |
± |
No |
|
(0, 1) |
± |
+ |
No |
|
(1, 1) |
± |
± |
Saddle point |
Table 5. Comprehensive equilibrium point analysis
|
|
ESS |
Condition 1 |
Condition2 |
|
Scenario 1 |
(0, 0) |
Fl+Fd>Re-Rb+V |
Cl+P<Ch |
|
Scenario 2 |
(1, 0) |
Fl+Fd<Re-Rb+V |
Ch–Cl>(1-a)V+P |
|
Scenario 3 |
(0, 1) |
Fl>Re-Rb+a*V |
Cl+P>Ch |
|
Scenario 4 |
(1, 1) |
Fl<Re-Rb+a*V |
Ch–Cl<(1-a)V+P |
|
Scenario 5 |
No |
Fl+Fd-V<Re-Rb<Fl–a*V |
P<Ch –Cl<(1-a)V+P |
An exploration of the remaining equilibrium points revealed five distinct scenarios, with the first scenario being elucidated upon in Table 4.
An analogous approach was employed to assess the stability attributes for points within the subsequent four scenarios. An exhaustive summary of the conditions discerned for each scenario is illustrated in Table 5.
To bolster the scientific rigour and objectivity of the simulation outcomes, parameter values were assigned at random, grounded in assumptions delineated in the preceding section. It is imperative to note that these values do not emulate actual financial figures from real building companies or energy service entities.
4.1. Analysis of dynamic evolution
Scenario 1:
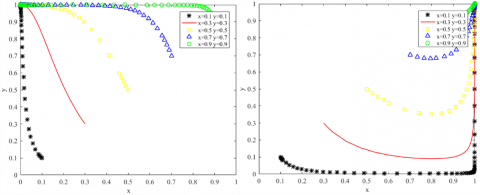
Parameters were set as: Fl=60, Fd=20, Re=120, Rb=100, V=50, Ch=50, Cl=20, a=0.7 and P=10. The simulated outcomes, presented in Figure 1, suggest that the building company does not achieve a marked rise in excess revenue from low-carbon production through energy efficiency retrofits. Furthermore, the energy service firm faces heightened expenses to maintain service quality, with the shared energy efficiency incentives falling short. Consequently, their interactive behaviour converges to the least favourable equilibrium point (0, 0).
Scenario 2:
With parameters defined as Fl=60, Fd=20, Re=140, Rb=100, V=50, Ch=50, Cl=20, a=0.8 and P=10, the simulations, also visible in Figure 1, indicate consumers' increased willingness to expend on low-carbon products. While building entities can augment their economic returns via low-carbon production, the incentive structures still discourage energy efficiency service firms from optimizing their offerings. The mutual dynamics evolve towards the sub-optimal equilibrium (1, 0).
Scenario 3:
Parameters were adjusted to: Fl=60, Fd=20, Re=120, Rb=100, V=50, Ch=50, Cl=20, a=0.7 and P=40. As demonstrated in Figure 2, despite the construction entity's stagnant revenue prospects, a stringent penalty system for default was introduced, compelling the energy efficiency service firm to adhere to quality benchmarks. Their collective dynamics gravitate towards another sub-optimal equilibrium (0, 1).
Figure 1. The simulation results of Scenario 1 and Scenario 2
Figure 2. The simulation results of Scenario 3 and Scenario 4
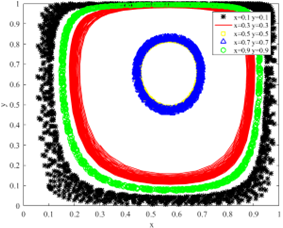
Figure 3. The simulation results of scenario 5
Scenario 4:
Upon setting parameters to Fl=60, Fd=20, Re=140, Rb=100, V=50, Ch=50, Cl=20, a=0.5 and P=10, Figure 2 reveals that low-carbon initiatives of building firms markedly enhance their economic yield. Additionally, concessions in energy efficiency service contracts bolster the motivation for service entities to elevate service standards. This interaction culminates in the optimal equilibrium (1, 1).
Scenario 5:
For parameters such as Fl=60, Fd=20, Re=140, Rb=100, V=50, Ch=50, Cl=20, a=0.3 and P=10, the simulations, showcased in Figure 3, elucidate the construction firms' active pursuits of low-carbon production. However, mild penalties for defaults might tempt some energy service companies to compromise on service excellence for cost-saving, compelling construction firms to revert to high carbon emission models. This induces a cyclic oscillation in the strategies adopted by both entities.
4.2. Sensitivity analysis of pivotal factors
To discern the conditions under which building companies and energy efficiency service entities might opt for voluntary agreements or proffer high-quality energy efficiency services for a low-carbon transition, pivotal variables within the model were methodically adjusted. This modification was primarily aimed at redirecting the outcomes of the two "non-ideal" states, scenario 1 and scenario 2, towards a desired or ideal state. Subsequent analysis explored the influences of individual parameter shifts on the evolutionary outcomes. It was postulated that the initial values for both x and y consistently remain at 0.3.
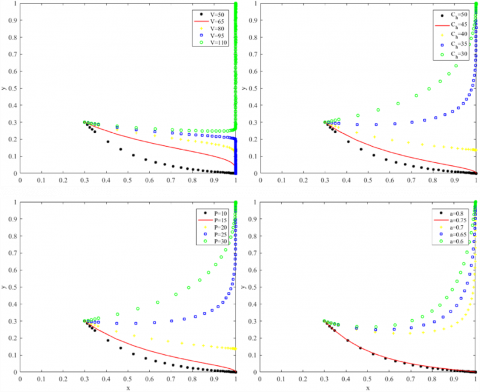
Figure 4. The sensitivity analysis of Scenario 1
Figure 5. The sensitivity analysis of Scenario 2
Figure 6. The sensitivity analysis of Scenario 3
Scenario 1:
Upon the foundation established in Scenario 1, Fl, Fd, Re, V, Ch, and P were identified as the critical variables. Asymptotic adjustments followed by simulations were undertaken, with results exhibited in Figure 4. As gleaned from the figure, diminishing labour costs (Fl), lowered costs associated with achieving independent emission targets (Fd), augmented benefits of low-carbon production (Re), and the amplification of energy-saving incentives (V) all seem to galvanise construction enterprises towards participation in voluntary accords. Notably, a spike in energy efficiency incentives incites service companies to elevate their service quality, aligning with energy efficiency accords. A contraction in the expenses tied to energy efficiency services (Ch) or an elevation in liquidated damages (P) similarly appears to invigorate ESCOs towards enhancing service quality.
Scenario 2:
Using scenario 2 as a reference point, V, Ch, P and a were demarcated as central variables. Following asymptotic alterations and individual simulations, results were depicted in Figure 5. The diagram reveals that, given a prevailing inclination among building companies to partake in voluntary agreements and embrace decarbonisation, factors such as an upsurge in energy-saving incentives (V), a diminution in service costs (Ch), intensified consequences of defaults (P), and the augmentation of incentive shares (a) collectively nudge energy-saving service firms towards proffering superior services. This collective response subsequently propels the system towards an optimal strategy.
Scenario 3:
Predicated on scenario 3, Fl, Re, V and a were designated as central variables, and subjected to asymptotic tweaks followed by simulations, producing results showcased in Figure 6. From the illustrative data, a moderate reduction in the charges for energy efficiency outsourcing services appears to incentivise construction firms to gravitate towards a positive low-carbon transition, especially when service companies exude a genuine proclivity to deliver quality services. Concurrently, the ancillary advantages of low-carbon production (Re) and the elevation of energy-saving incentives (V, a) further reinforce their low-carbon transition, guiding the entire system towards the optimal strategy.
In the nexus of carbon peaking, carbon neutrality goals, the energy efficiency service market, and voluntary environmental regulation, an evolutionary game model between construction entities and energy efficiency service corporations was formulated. Analysis of the stability of evolutionary strategies and sensitivity led to the subsequent inferences:
(1) The evolutionary game dynamics of the energy efficiency service market are intrinsically intertwined with intricate path dependencies. The stable equilibrium state is influenced not just by stakeholders' initial strategy selections, but also by how pivotal parameters are modulated. The attainment of a stable equilibrium strategy has been demonstrated to be intimately linked to various determinants: costs of energy efficiency services, independent emission reduction costs, benefits associated with low-carbon production, default payments, energy efficiency incentives, and their respective distribution rates.
(2) Within this game model, equilibrium is reached, determined by individual stakeholder interests. In scenarios where the aggregate of governmental incentives and voluntary energy conservation and emission reduction commitments for service entities falls below the cost of assisting construction companies in achieving low-carbon production, there exists a propensity for entities to default and opt for more economical but subpar services.
(3) The active role of governments and associated entities becomes paramount. For an optimal strategic model to emerge, policies must be crafted to ensure that the benefits of such incentives clearly surpass the costs borne by construction and energy conservation service firms. Such an equilibrium prompts construction firms to embrace voluntary conservation accords, fostering a proactive transition to low-carbon operations, while energy conservation entities feel compelled to deliver superior energy efficiency services, advancing collective energy conservation and emission reduction ambitions.
(4) Variables such as energy efficiency service fees, liquidated damages, and energy efficiency incentives have been observed to wield significant sway over the game's trajectory. However, in real-world scenarios, these parameters may not consistently hold their desired values, potentially triggering a shift in strategies akin to the cyclical oscillations showcased in Figure 5. Over extended timelines, a pragmatic approach would be to bolster the ancillary benefits of low-carbon production for construction firms, intensify penalties for excessive carbon emissions, and elevate sanctions for defaults by energy-saving entities, thereby fostering a proactive cost-reducing, high-quality service provision environment.
Based on the derived conclusions, the subsequent recommendations are posited:
(1) Throughout the evolution of the energy efficiency service market, dependencies on traditional, non-energy-saving methodologies by construction companies and age-old service techniques by energy-saving entities may hinder green emission reduction progress. Enhancement of the current game model mandates collaborative endeavours encompassing users, green building purchasers, construction firm practitioners, environmental advocates, scholars, research institutions, and the entirety of the supply chain. This collaborative understanding and emphasis on green emission reduction would potentially revolutionise the prevalent approach towards energy efficiency services and foster a pervasive shift towards sustainable environmental development.
(2) Governments bear the responsibility to formulate a holistic regulatory framework, fine-tuned to local nuances and characteristics, furnishing institutional protection and standardised guidelines for the building energy efficiency service domain. Concurrently, an information platform catering to building energy efficiency services could be a linchpin, ensuring seamless information access, robust disclosure mechanisms, and negating barriers arising from informational lags and asymmetries. Moreover, a well-balanced incentive and regulatory mechanism, which doesn't impede enterprise productivity, should be emphasised, intensifying energy-saving incentives and pollution penalties to galvanise all market participants towards energy conservation and emission reduction.
(3) Amplifying construction companies' ancillary income from low-carbon production can act as a potent motivator for emission reduction initiatives. Construction firms ought to expedite technological innovation, embracing trends such as green buildings, modular constructions, and smart edifices. By reducing overheads, they can enhance low-carbon production returns. Furthermore, it is imperative to bolster societal responsibility, foster energy conservation awareness, and enshrine a green, low-carbon consumption ethos, steering supply with demand dynamics to facilitate sustainable growth in low-carbon construction and building energy-saving service markets.
This paper was funded by The National Social Science Fund of China (Grant No.: 20BJY144).
Gang Deng and Jin Chen contribute equally to the article.
[1] Zhou, W., Moncaster, A., O'Neill, E., Reiner, D.M., Wang, X., Guthrie, P. (2022). Modelling future trends of annual embodied energy of urban residential building stock in China. Energy Policy, 165: 112932. https://doi.org/10.1016/j.enpol.2022.112932
[2] Mallapaty, S. (2020). How China could be carbon neutral by mid-century. Nature, 586(7830): 482-483. https://doi.org/10.1038/d41586-020-02927-9
[3] Han, Y., Zhang, H.T., Zhao, Y. (2021). Structural evolution of real estate industry in China: 2002-2017. Structural Change and Economic Dynamics, 57: 45-56. https://doi.org/10.1016/j.strueco.2021.01.010
[4] Zhu, C., Li, X.D., Zhu, W., Gong, W. (2022). Embodied carbon emissions and mitigation potential in China's building sector: An outlook to 2060. Energy Policy, 170: 113222. https://doi.org/10.1016/j.enpol.2022.113222
[5] Jiang, H., Li, J.M. (2010). Difficulties and strategies of the development of low-carbon building of China. China Population, Resources and Environment, 20(12): 72-75. https://doi.org/10.3969/j.issn.1002-2104.2010.12.015
[6] Ren, S.G., Li, X.L., Yuan, B.L., Li, D.Y., Chen, X.H. (2018). The effects of three types of environmental regulation on eco-efficiency: A cross-region analysis in China. Journal of Cleaner Production, 173: 245-255. https://doi.org/10.1016/j.jclepro.2016.08.113
[7] Jiang, Z.Y., Wang, Z.J., Zeng, Y.Q. (2020). Can voluntary environmental regulation promote corporate technological innovation? Business Strategy and the Environment, 29(2): 390-406. https://doi.org/10.1002/bse.2372
[8] Zhang, S.X., Lin, D.D. (2017). Research on interactive mechanism between market mechanism and government regulation in the building energy efficiency services. Reformation & Strategy, 33(2): 21-24. https://doi.org/10.16331/j.cnki.issn1002-736x.2017.02.006
[9] Qing, G.L., Guo, H.D., Qiao, W.Z., Li, W. (2020). Research on behavior game of core subjects in green renovation of existing residential areas-based on perspective of market operation. Resource Development & Market, 36(4): 377-382. https://doi.org/10.3969/j.issn.1005-8141.2020.04.008
[10] Friedland, A.J., Gerngross, T.U., Howarth, R.B. (2003). Personal decisions and their impacts on energy use and the environment. Environmental Science & Policy, 6(2): 175-179. https://doi.org/10.1016/S1462-9011(03)00006-6
[11] Goulden, S., Negev, M., Reicher, S., Berman, T. (2019). Implications of standards in setting environmental policy. Environmental Science & Policy, 98: 39-46. https://doi.org/10.1016/j.envsci.2019.05.002
[12] Bu, M., Qiao, Z.Z., Liu, B. (2020). Voluntary environmental regulation and firm innovation in China. Economic Modelling, 89: 10-18. https://doi.org/10.1016/j.econmod.2019.12.020
[13] Mungai, E.M., Ndiritu, S.W., Rajwani, T. (2020). Do voluntary environmental management systems improve environmental performance? Evidence from waste management by Kenyan firms. Journal of Cleaner Production, 265: 121636. https://doi.org/10.1016/j.jclepro.2020.121636
[14] Liu, A.D., Gu, X.S. (2020). Environmental regulation, technological progress and corporate profit: Empirical research based on the threshold panel regression. Sustainability, 12(4): 1416. https://doi.org/10.3390/su12041416
[15] Lim, S., Prakash, A. (2014). Voluntary regulations and innovation: The case of ISO 14001. Public Administration Review, 74(2): 233-244. https://doi.org/10.1111/puar.12189
[16] Wang, Z., Zhou, J., Shen, Y. (2014). Evolutionary game analysis of enterprises’ emission reduction based on voluntary agreement. Journal of Zhejiang A & F University, 31(5): 785-790.
[17] Bhattacharya, A., Good, V., Sardashti, H., Peloza, J. (2021). Beyond warm glow: The risk-mitigating effect of corporate social responsibility (CSR). Journal of Business Ethics, 171: 317-336. https://doi.org/10.1007/s10551-020-04445-0
[18] Kolcava, D., Rudolph, L., Bernauer, T. (2021). Voluntary business initiatives can reduce public pressure for regulating firm behaviour abroad. Journal of European Public Policy, 28(4): 591-614. https://doi.org/10.1080/13501763.2020.1751244
[19] Liu, N., Tang, S.Y., Zhan, X., Lo, C.W.H. (2018). Policy uncertainty and corporate performance in government-sponsored voluntary environmental programs. Journal of Environmental Management, 219: 350-360. https://doi.org/10.1016/j.jenvman.2018.04.110
[20] Wang, J., Zhao, M., Liu, X. (2019). Research on the driving factors of enterprises’ environmental self-regulation in China. Economic Problems, 2019(7): 87-94.
[21] Pang, J., Li, W.D. (2011). On low-carbon preference and consumption function. China Population, Resources and Environment, 21(9): 76-80.
[22] Weibull, J.W. (1997). Evolutionary game theory. Cambridge: The MIT Press, America, Boston, 850-853.