Experimental Investigation of Single-Phase Flow and Heat Transfer in Microchannels with Al2O3 and Graphene-Al2O3 Composite Electroplating Coatings

Hasan Qahtan Hussein*![]() | Ekhlas M. Fayyadh
| Ekhlas M. Fayyadh![]() | Moayed R. Hasan
| Moayed R. Hasan![]()
© 2023 IIETA. This article is published by IIETA and is licensed under the CC BY 4.0 license (http://creativecommons.org/licenses/by/4.0/).
OPEN ACCESS
This study investigated the effects of electroplating coatings in a single microchannel on the flow and heat transfer parameters of single-phase flow was the focus of an experiment that was carried out recently. Experiments were carried out using the micro-channel has dimensions of 0.3 mm width, 0.7 mm depth, and 60 mm length and deionized water serving as a working fluid at the temperature for 30 degrees Celsius at the intake, with a range of Reynolds numbers spanning from 283 to 4840. The results of experiments and the calculations shown that the fanning friction factor correlation of laminar and turbulent flow can expect experimental findings with a high level of accuracy. Moreover, when the Reynolds number increases, the Nusselt number increases as well. There is improvement of heat transfer performance for Al2O3 coated and composite Graphene-Al2O3 coating through all Reynolds number. fanning friction factor for models with Al2O3 coated are a greater than conventional microchannel while and composite Graphene-Al2O3 coating more fanning friction factor than Al2O3 coated. The results demonstrated that a predictable correlation is appropriate to guess a friction factor of conventional microchannel, Al2O3 coated and composite Graphene-Al2O3.
single-phase, microchannel, Graphene-Al₂O₃ composite coatings, Nusselt number, friction factor, pressure drop
The relentless miniaturization of electronic components over the past three decades has generated an urgent need for extra trustworthy thermal management solutions that can dependably keep system temperatures below certain material and performance constraints. This trend began about 1980, when an increase in heat dissipation drove a transition from fan-cooled heat sink attachments to liquid-based cooling methods. Initially, just a liquid solution for cooling single-phase flow was used [1].
Even though a great number of researchers are interested in microchannel heat transfer and flow characteristics, there are still conflicting results presented in the scientific literature. The main goal of this research is to enhancement heat transfer. Therefore, Electroplating coating microchannels represent as an enhancement technique of heat transfer that uses deionized water as the working fluid.
Investigators have looked at both the movement of fluid and the transmission of heat through micro-channels. It was clarified why certain outcomes depart from predictable correlations, as evidenced by entrance affects, temperature dependent features, compression affects, combine heat transfer, surface roughness, viscous heated, surface roughness, the scaling affects, and experimentally errors. In other words, it was shown that inlet effects, temperature-dependent features, compression effects, and compression effects were all responsible. It is currently unknown which factors impact the behavior of flow and heat transmission in micro-channels. Numerous investigators found which heat transport in microchannels diverged from what conventional theory and macro-scale correlations had anticipated. Harms et al. [2] experimentally investigate single-phase forced convection of a flow of de - ionized water is passed via both single and multi deep rectangular silicon micro - channels with a wall thickness of 119 micrometers and a width of 251 micrometers. for a Reynolds number range of (193-12900) founded on a micro-channel hydraulic diameter. At all tested flow rates, the experimental values of the Nusselt number for a single micro-channel were originate to exceed an expected values. Although Nusselt number was comparable to conventional one only at high flow rates for applications involving many microchannels. Yet, the limitation on heat exchanger size prompted prior research into its impact on thermohydraulic characteristics. Qu and Mudawar studied thermo-hydraulic performance for single phase micro-channel heat exchangers in their study [3]. Experimentally and statistically, the heat transfer characteristics and pressure drop for a single phase laminar flow through a rectangular copper micro-channel were determined. (231 mm µm wide and 713 µm deep) with two heat flux values (100 W/cm2, 200 W/cm2) were explored for a Reynolds number range (139-1672). Observations and numerical predictions were found to be in good agreement, Justifying the application of the standard Navier–Stokes equations to micro - channels. Despite this, a number of studies, such as Lee et al.'s, have investigated an effected for hydraulic diameter on the thermal performance. Lee et al. [4] analyzed effect for hydraulic diameter of copper micro-channels on thermal action of a single phase flow utilizing de-ionized water, and found that the microchannel width range was proportional to the hydraulic diameter (19.4534 µm). Between 300 and 3500 Reynolds numbers were used for tests. It was detailed that a coefficient of heat transfer rose as channel size reduced, and that an experimental result diverged significantly from conventional correlations.
Jung and Kwak [5] studied the impact of microchannel width on friction coefficient and thermal behavior. Experimentations were done on a silicon micro-channel with same depth (100 µm) and length (15 mm), but varying widths, using deionized water as the working fluid (100 µm, 150 µm, and 200 µm). The relationship between heat transfer coefficient and wall temperature was declared to be linear. Moreover, the connection between Nusselt number and Reynolds number diverged from typical values It was determined, however, that a friction factor through a laminar flow was equivalent to that of conventional flows [6]. The impact for two sizes of square stainless steel micro-channel on thermal and hydrodynamic performance was examined; hydraulic diameters for the micro-channel were 100 µm and 200 µm. The hydraulic diameter for one of scales was less than that of the other. Used as a working fluid was deionized water. According to the conclusion, the results did not deviate from the norm. In addition, microchannels with a minute scale had no effect on the increase in heat transfer or a rise in pressure drop.
Mirmanto et al. [7] heat transmission and fluid flow parameters for the single phase flow in three single copper micro-channels of various hydraulic diameters (438 µm, 561 µm, and 635 µm) and aspect ratios were analyzed. De-ionized water was utilized as a working fluid with a mass range of 500 to 5,000 kg/m2.s. It was established which experimental friction factor and Nusselt number values for fully matured condition were higher than the standard values. In experimental works, experimental variables such as entrance effects, experimental errors, pressure losses at the intake and exit, and departure from laminar flow were taken into account. The results indicate that standard scale water flow equations may be applied to actual microchannel water flows. Impact of ordered roughness on flow and heat transfer properties at the micro-scale. The roughness factors that were evaluated were relative roughness, roughness height, and roughness element pitch [8]. Utilizing water as the working fluid, eight rectangular stainless steel channels of differing hydraulic diameters (710 µm to 1870 µm and relative roughness (0-96 µm) were investigated. The Nusselt number findings for smooth channels were properly predicted using a conservative correlation in the developing and fully formed flow. The roughness structure was shown to rise heat transfer coefficient. Yet, surface with greater relative roughness had a stronger impact on pressure drop and heat transfer. In addition, a sudden transition from laminar to turbulent flow occurred. In addition, it was determined that the roughness pitch of the element had no influence on heat transfer within the scope of the study.
A circular stainless steel microchannel with a diameter of 850 µm was utilized to investigate the influence that surface roughness has on the friction factor and the transport of heat utilizing two unique working substances (distilled water and R134a) and a variety of Reynolds numbers (100-10000) [9]. Despite the early identification of an early transition, friction factor and Nu values demonstrated a stronger association with a macroscale theory in the laminar zone. Hence, a friction factor obtained for a turbulent region may be properly predicted by macroscale theories, despite a fact that the observed values of Nusselt number are less than those anticipated by correlations. The hydraulic diameter of the micro-channel was 363 µm, and nitrogen was employed as the working fluid [10]. The array micro-cylinders were put into silicon microchannel surfaces in order to determine the fluid flow resistance analytically. In the experimental investigation, two methods were employed: the first employed a porous medium, while the second employed channels with varying cross-section. The link between a diameter for microcylinder, a distance between adjacent micro-cylinder, the size of the channel (height and width), and a pressure drop. The findings demonstrated that these approaches were successful in capturing the inquiring attitude. The flexible cross-section method was extremely precise for geometric shapes in which the gap spacing ratio to the size of the cylinder and the height of the channel was small. However, this theory's precision degrades as the structure's porosity and hole sizes significantly raise, while the porous medium strategy displayed a reasonable level of accuracy. Yet, the researchers speculated that there is a certain diameter of the micro-cylinder that should be used in order to minimize the pressure drop, and that this diameter should be a function of the geometry of the channel as well as the needed surface area-to-volume ratio.
In furthermore, Yuan et al. [11] studied the effect of surface roughness using three circular stainless steel microchannels with varying surface roughnesses (0.86 µm, 0.92 µm, and 1.02 µm) but with a similar diameter (400 µm). Air with a variety of Reynolds numbers was employed as a working fluid (150-2800). It was determined that increasing relative roughness resulted in higher Poiseuille and Nu values. In addition, when Re grew, the friction factor value dropped. In contrast, when the value of Re grew, the value of Nu increased. In addition, the transition from laminar to turbulent flow happens about Re = 1500, as determined by the researchers.
Markal et al. [12] studied an effect of aspect ratio through friction factor and heat transfer in micro-channels with the same hydraulic diameter. In a multi-microchannel used de-ionized water as the working fluid and a range of Reynolds numbers, tests were done (12.3-47.3). Experimentally determined, when an aspect ratio grows, the Nusselt number increases and a friction factor drops. In addition, the investigational Nusselt number and friction factor were found to be less than a correlation often seen. The effect of artificial cavities on friction factor and thermal behavior in a 300 m hydraulic diameter square copper microchannel heat sink with a single microchannel was tested experimentally [13]. Two microchannel models (model-1 and model-2) with the same hydraulic diameter were used in experiments. Model 1 lacked artificial cavities, whereas Model 2 featured (47) artificial cavities evenly distributed throughout the bottom surface of the microchannel. Used as the operating fluid was deionized water. The experimental findings demonstrate that the friction factor may be properly anticipated using predictable correlation of developing flow in the laminar region for both designs. Furthermore, an experimental Nu corresponds to a conventional and micro-channel correlations in a laminar zone.
According to the findings of the experiments, the experimental friction factor may be properly predicted for two models by utilizing a traditional correlation of developing flow in a laminar zone. This is the case for both of the models. In the laminar zone, the experimental Nusselt number has a high degree of congruence with both conventional and microchannel correlations.
As implied above, heat transfer enhancement is strongly dependent on the flow pattern development in microchannels. Accordingly, the effectiveness of heat transfer enhancement using porous coatings may also be dependent on heat flux and mass flux conditions. Several studies have found a notable depreciation in heat transfer enhancement at high heat fluxes, as well as different enhancement behaviours at different operating mass fluxes.
According to the previous carbon nanotubes in Khanikar [14], there may be problems if the nanocoating was not created using the correct fabrication techniques, leading to detachment nanocoating and deterioration in heat transfer. The coating of heated surfaces with nanoparticles by nanofluid pool boiling is one straightforward method for obtaining nano-coating. By pool-boiling ethanol-based alumina (Al2O3) nanofluid, Morshed et al. [15] formed an Al2O3 nanocoating in a single Cu microchannel with a hydraulic diameter of 672 m. The experiments were performed at a range of heat and mass flux at subcooled conditions using deionized water as the working fluid. Results of flow boiling experiments showed that the nanocoated microchannels could only increase the critical heat flux (CHF) by 35% to 55% and that the heat transfer coefficient was slightly lower for the nanoparticles-coated surface than for the bare surface. Similar effects have been observed when the wettability of the surface is increased. So, Kaya et al. [16] examined the effect of coating microtubes with polyhydroxy ethyl methacrylate (pHEMA) on the flow boiling enhancement. Flow boiling heat transfer experiments were conducted on microtubes at two mass flux values using deionized water as the working fluid. Experimental results obtained from the coated microtubes were compared to their plain surface counterparts, and found the coated surfaces demonstrated an increase of up to 24% and 109% in CHF and heat transfer coefficients, respectively. This can be attributed to the increased heat transfer surface area, the addition of liquid replenishment, and nucleation sites by pHEMA coatings [17].
In this study, an improvement method for heat transfer performance in a single microchannel channel is employed. Therefore, the purpose of this study is to investigate the effect that different coating has on the flow and heat transfer characteristics. In addition, the friction factor and Nusselt number predicted by the model will be compared with experimental data, conventional correlations, and micro-scale correlations.
2.1 Setup for experiment
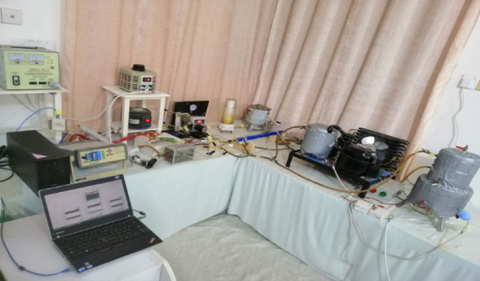
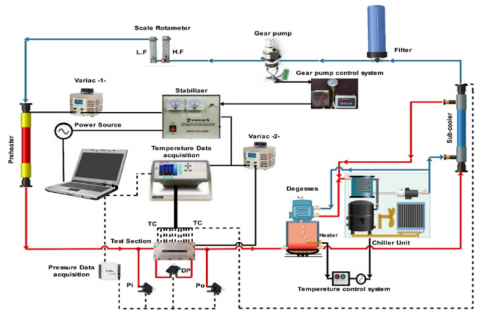
To conduct an experiment work, an experimental rig was designed and manufactured. The experimental system includes a de-ionized water tank, a micro gears Pump, a pre-heater, a test section, a sub-cooler, and an in-line filter. To measure a wide range of flow rates a rotameter model (LZB-WBF) was used with an accuracy ± 0.51 ml/min for cooling purposes and a sub-cooler and condensing unit was used. The experimental system setup and schematic diagram are shown in Plates 1 and Figure 1 respectively. Intense boiling for about one hour was employed to ensure degases deionized water accumulated in the liquid tank. The non-condensable gases are relieved to the environment through an open valve positioned at the top of the condenser. Deionized water Passes through a 5 µm filter installed before the gear pump to eliminate all particles from the water. Following that, the degassed water was pumped to the test section. To control, the inlet temperature of the working fluid, a preheater was used.
Plate 1. Experimental facility
1: Degasses 2: Main Tank 3: Filter 4: Micro-Gear Pump 5: Flow meter 6: Pre-Heater 7: Test-Section 8: Sub-Cooler 9: Data Logger 10: DAQ-NI-6009 11: Pump Controller 12: AC-Stabilizer 13: Unit Power Supply 14: Variac 15: Chiller Unit
Figure 1. Schematic diagram of the experimental facility
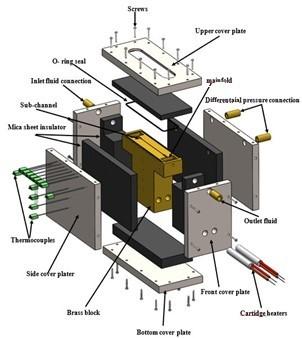
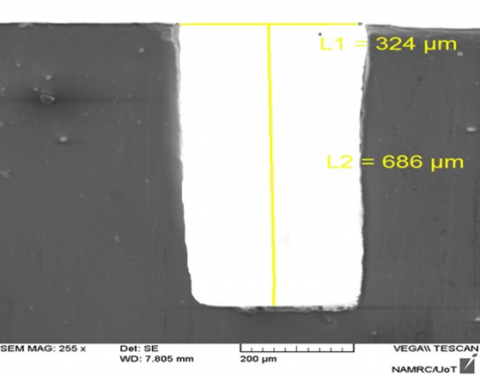
The test section consists of brass-black (68.28% cu and 31.77% Zn by weight) with a single micro-channel, a stainless steel housing, cartridge heaters, and a top cover plate. On the upper surface of the brass block, a single rectangular microchannel was grooved by a milling machine with a feeding rate of (10 mm/min). The brass block was with a dimension of (30 widths, 114 lengths, and 81 height) mm. While the microchannel was machined with 0.3 mm width and 0.7 mms depth. Two cartridge heaters, each of 100 W, were inserted horizontally at the bottom of the brass- block in order be supply the required heat. Four thermocouples Type-k were distributed vertically along the center line of the brass block with equal distance (14.7 mm) to measure the wall temperature. At 1 mm for lower surface of microchannel seven thermocouples Type-k were axially distributed with nearly 10 mm distance from each other. The diameter of all used thermocouples was 0.5 mm with accuracy calibration ± 0.5 k. The brass block was assembled with stainless steep housing and sealed with Oring as shown in Figure 2. The stainless steel housing contains inlet and outlet manifolds in addition to subchannels. Two thermocouples Type-k was immersed in to sub channels to measure temperature of working fluid at inlet and outlet. To measure inlet and outlet of pressure out manifold two transducers type (MPX5500DP) were used, while pressure drop across the test section was measured using differential pressure transducer type (MPX4250DP) Accuracy of all transducers was ± (3.21, 4.32 and 4.33%) respectively. The dimensions of the inlet and outlet manifolds were (20×20×0.7 mm) while, dimensions of and inlet and outlet subchannels were (7×2×0.7 mm) To observe the flow through the microchannel the top covered plate equipped with visualization window of the same dimensions of the microchannell including sub-channels. The obtained temperature data was recorded using data Logger (Applent AT 4532x) reading. An electronic microscope (SEM) was used to measure the width and depth of the microchannel. Figure 3 shows the actual dimensions of the microchannel to obtain the roughness of the bottom surface of the microchannel, atomic force Microscope (AFM) was used. The microscope probe scanned over an area of 100000 × 100 000 nm and evaluated an average roughness of 18.64 nm, as shown in Figure 4. The Pressure transducer signals (0-5 DC–Volt)) from pressure transducer gauge to LabView software were collected using Bus-power multifunction DAQUSB model (model NI USB-6009)) as interface device.
Figure 2. Schematic of the test section
Figure 3. Micro-channel real dimensions
2.2 Electroplating method system
A single rectangular microchannel was modeled in two different ways. The first model was traditional, the second type was coated with alumina, Electroplating method system consists of a device Magnetic hot stirrer, Glass beaker number (3), D.C power supply and electrolyte solution: It consists of nickel sulfate, nickel chloride and boric acid in known proportions as shown in Table 1. Before starting the coating process, the sample to be painted is polished and cleaned with ethanol alcohol, then the sample is tied with a conductive copper wire and the areas that are not coated with an insulating material are isolated to preserve the specified areas, and then the sample is stimulated by immersing it in a container containing acid hydrogen chloride diluted in a ratio of 1 to 3 to remove the oxides particles adhered to the surface and finally immersed the sample in a container containing distilled water in order to wash it. The electrolyte solution is placed in the container for the coating and mixed with the nanoparticles Al2O3 and composite Graphene-Al2O3 quickly (500) RPM for an hour to get a better homogeneity of the mixer at a temperature of 50 degrees Celsius as shown in Figure 5. The coating process is carried out by connecting the sample to be coated with the negative cathode electrode and the nickel electrode is connected to the anode and by applying an electric current from the power supply with a value of (2.38) an Ampere and (5) voltage for a period of 0.5 minutes.
Figure 4. Surface roughness characterization of the micro-channel's bottom sample region (10000 nm×10000 nm)
2.3 Calibration process
2.3.1 Thermocouple calibration
Thermocouples were calibrated against an accurate mercury thermometer. Every thermocouple was placed with a mercury thermometer in a path filled with distilled Water. All thermocouples and thermometer readings were listed from the path with a temperature range of 0° to 99℃, with interval increasing of nearly 10℃. The results showed that thermocouple accuracy was in Range (±0.2 - ±0.7).
Table 1. Composition of nickel (electrolyte) bath for Al2O3 nanocomposite coating
|
No. Exp. |
Components |
Value Using |
|
1 |
nickel sulfate (niso4. 6 H2o) |
300 g/l |
|
nickel chloride (nicl2 .6H2o) |
45 g/l |
|
|
boric acid |
30 g/l |
|
|
Al2O3 |
5 g/l |
|
|
2 |
nickel sulfate (niso4. 6 H2o) |
300 g/l |
|
nickel chloride (nicl2.6H2o) |
45 g/l |
|
|
boric acid |
30 g/l |
|
|
Al2O3 |
5 g/l |
|
|
Graphene |
1 g/l |
Figure 5. Schematic of electrochemical nickel plating coating methods
2.3.2 Pressure transducer calibration
To calibrate the pressure transducer, a deadweight tester was used. This tester used calibrated weights to create specific pressures known as pressures on the tested pressure transducer. So, this gives a specific output voltage. It was connected to a data acquisition device to record its readings. So, the output voltage readings were recorded in LabVIEW software. The accuracy of differential pressure, input pressure, and output Pressure transducers were ± 3.21%± 4.32% and ±4.33, respectively.
2.3.3 Rotameter calibration
Three range rotameters were calibrated depending on the static calibration method. In this method, the de-ionized Water at 25℃ flows through the rotameter and its flow rate value is recorded. Then, this quantity was collected at a borosilicate glass burette with a capacity range of (0-25) ml during the period of the specified time. The obtained from the rotameter was compared with the collected volume during the specified period. The calibration showed that the accuracy of high, medium and low-range rotameters was ±0.51, ±0.407 and ±0. 358 ml/min, respectively.
2.4 Data reduction
2.4.1 Flow of the single-phase
In the single-phase flow through a microchannel undergoes a net pressure drop, denoted by $\Delta P_{c h}$, which may be represented as [18]:
$\Delta p_{c h}=\Delta p l_m-\Delta p_{\text {loss }}$ (1)
in which $\Delta P_m$ is the measure the pressure drop between the input and output manifold and $\Delta P_{\text {loss }}$ that is a drop pressure caused by total minor losses including the input subchannel $\Delta P_{s c h, i}$, the output subchannel $P_{s c h, o}$, the sudden contraction $\Delta P_{s c}$ and the sudden expansion $\Delta P_{s e}$. Therefore, it may be worked out as follows [19]:
$\Delta p_{\text {loss }}=\Delta p_{\text {sch }, i}+\Delta p_{\text {sch,o }}+\Delta p_{s e}+\Delta p_{s e}$ (2)
The pressure drop that occurred as a result of total small losses was computed as a result of the rapid contraction and expansion using the equation that is shown below [20]:
$\Delta P_{l o s s}=\frac{\left(K_{s c 1}\,+K_{s e 2}\,\,\right) \cdot\left(V_{s c h}^2 \cdot \rho\right)}{2}+\frac{\left(K_{s c 2}\,\,+K_{s e 1}\,\,\right) \cdot\left(V_{c h}^2 \cdot \rho\right)}{2}$ (3)
In the equation presented above, (Ksc1, and Ksc2) are the loss coefficients that are caused by the quick contraction that occurs while going from a manifold to subchannel and then from a sub-channel to a micro-channel, correspondingly. In contrast side, (Kse1, and Kse2) indicate loss coefficients produced by a rapid expansion from a micro-channels to a subchannels and from a subchannels to manifolds, respectively. The values for coefficients of loss (Ksc1, Ksc2, Kse1, and Kse2) are respectively 0.5, 0.47, 0.72, and 0.81 [21]. So, the following equation may be used to calculate experimentation's fanning friction factor based on micro-channel pressure drop [22]:
$f_{c h}=\frac{\Delta p_{c h} \cdot D_h}{2 \rho L V_{c h}}$ (4)
The following equation was used to compute the base heat flux ($q_b^{\prime \prime}$) at the heat sink [23]:
$q_b^{\prime \prime}=\frac{P-Q_{\text {loss }}}{A_b}$ (5)
$P=I . V$ (6)
wherever P represent power of heating in watts, (I) and (V) are electric current and voltages in ampere units and Volts units, respective, and Ab represent base area for heat sink, that \ is computed using the base heating width (Wb) and heating length (Lch) for base plate and is provided as:
$A_b=W \cdot L_{c h}$ (7)
Through heating test section without the pumping of liquid, one may estimate heat loss (Qloss) that occurs from the test section to the surrounding environment. After the system has attained a stable state, the power and temperature of the microchannel's bottom wall are measured and recorded. The preceding steps are repeated in order to calculate different levels of electrical power. The equation for heat loss may be found by graphing the amount of applied electrical power against the difference in temperature between the bottom wall and the ambient temperature, this strategy was used by several authors. A large number of researchers have adopted this strategy [23, 24].
The coefficients of locally heat transfer (hsp(z)) is found by follows:
$h_s p(z)=\left(q_b^{\prime\prime} W\right) /\left(\left(T_W(z)-T_f(z)\right)(W c h+2 H c h)\right)$ (8)
$H_{c h}$ and $W_{c h}$ are respectively, the height and width of the channel. It was decided to insert locally thermocouples at the distance (th) of one millimeter from the base of micro - channels. To determine a temperatures of the microchannel's internal surfaces (Tw(z)), the thermocouple temperature data (Ttc(z)) were recalculated utilized one-dimension heat conduction formulation, as illustrated in the following equation [12]:
$T_W(z)=T_{t c}(z)-\left(q_b^{\prime \prime} t h\right) / K_s$ (9)
Table 2. Uncertainty value in each measured parameter
|
Variable Quantity |
Measurement Tool |
Uncertainty Value |
Sources |
|
Depth of Microchannel |
Inspect 50 FE -SEM |
± 0.014 mm |
FEI Company INSPECT F50 FE -SEM |
|
Width of Microchannel |
Inspect 50 FE -SEM |
±0.024 mm |
FEI Company INSPECT F50 FE -SEM |
|
length of Microchannel |
Vernier Caliper |
±0.1 mm |
Manufacturing |
|
Alternating voltage current |
Voltmeter |
± 0.6 V |
Model (DT200) |
|
Alternating current |
Clamp Meter |
± 0.01 A |
Clamp meter model (UNI-T UT202+) |
|
Volume flowrate |
Low Rotameter range |
± 0.358ml/min |
Calibrated |
|
Medium Rotameter range |
± 0.407 ml/min |
Calibrated |
|
|
High Rotameter range |
± (±0.51ml/min |
Calibrated |
|
|
Pressure |
Differential pressure transducers-model MPX4250 |
± 0.0133 bar |
Calibrated |
|
Differential pressure |
|
||
|
|
Transducers-model MPX5500 |
± 0.0221 bar |
|
|
Temperature |
Data-Logger Applent and thermocouple type RS-Pro -K |
± (0.2-0.7)℃ |
Calibrated |
The localized fluid temperature (Tf(z)) can be computed using the equation below assuming a uniform boundary condition [12]:
$T_f(z)=T_i+\frac{\left(q_b^{\prime \prime} W . z\right)}{\left(\dot{m} C_p\right)}$ (10)
where, $\left(T_i, z, \dot{m}\right.$ and $\left.C_p\right)$ are respectively, temperature of the intake fluid, the length of the channel is measured axially, mass flow rate and specific heat of the fluid.
The average Nusselt number is found by follows as [16]:
$N u=\frac{1}{L_{c h}} \int_0^{L_{c h}} \frac{h_s p(z) \cdot D_h}{K_l} d z$ (11)
Experimental data were carried out at system pressure of 1 atm, heat flux of 60.225 kW/m2 and range of Reynolds number (283-4840) utilized de-ionized water as working fluid.
2.4.2 Uncertainty analysis
The measurement error is the difference between the value that was measured and the real value of the quantity being measured; this difference may originate from a variety of sources and reflects both the error of bias (systematic error) and random error. The bias error is brought on by the inaccuracy in the measuring equipment, and the calibration of the device may bring this kind of error down to a more acceptable level. The error that is brought on by external factors is known as the precision error (random error) (surrounding temperature pressure, humidity, etc.). The uncertainty in each measured quantity is summarized in Table 2 [20].
3.1 Single phase friction factor
The investigational outcomes of fanning friction factor model was compared with correlation of Shah and London [25] of developing and developed flow in laminar flow zone. Therefore, apparent friction factor $f_{a p p}$ of developing flow at laminar region was intended used correlation of Shah and London, 1978 by following [25]:
$f_{a p p}=\frac{3.44}{\operatorname{Re}\left(L^*\right)^{\frac{1}{2}}}+\frac{\left(f_{F D}\,\, R e\right)+\frac{K(\infty)}{4 L^*}-\frac{3.44}{L^{* \frac{1}{2}}}}{\operatorname{Re}\left(1+C\left(L^*\right)^{-0.2} \,\, \right)}$ (12)
$L^*=L_{s p} /\left(\operatorname{Re} D_h\right)$ (13)
in which both $(K(\infty))$ and (C) are constant, it depends on an aspect ratio of a current study, values are (1.7784×10⁻⁴) and (1.1962). Likewise, Poiseuille number (fFDRe) of fully developing single-phase fluid flow was expressed through Shah and London, 1978 [25]:
$\begin{aligned} & \left(f_{F D} R e\right)=24\left(1-1.35534 \beta+1.9467 \beta^2-\right. \left.1.7012 \beta^3+0.9653 \beta^4-0.2537 \beta^5\right)\end{aligned}$ (14)
$\beta=\frac{W_{c h}}{H_{c h}}$ (15)
Moreover, Phillis and Blasius' correlations for developing and developed flow in turbulent flow regions were examined. For fully developed turbulent flow, the Blasius Correlation of Fanning friction factor is as follows:
$f=0.079 R e^{-0.25}$ (16)
Phillips, 1987, also established the fanning friction factor for creating turbulent flow [26]:
$f_{(appturb.)}=\left(0.0929+1.0161 D_h / L\right) \operatorname{Re}^{*\left(\left(-0.268-\left(0.3193 D_h\right) / L\right)\right)}$ (17)
where, $R e^*$ is equivalent Reynolds number, which is determinable as:
$\operatorname{Re}^*=\operatorname{Re}\left(\frac{2}{3}+\frac{11}{24} \beta(2-\beta)\right)$ (18)
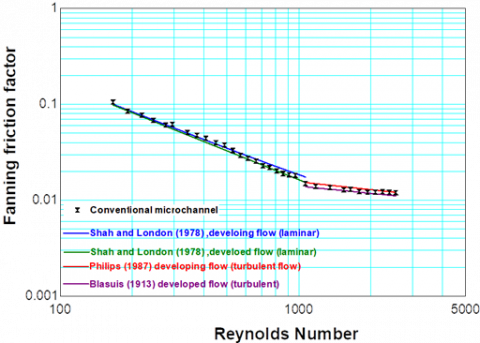
Figure 6. Experimental outcomes comparing fanning friction factor through laminar and turbulent flow correlations in conventional micro-channels
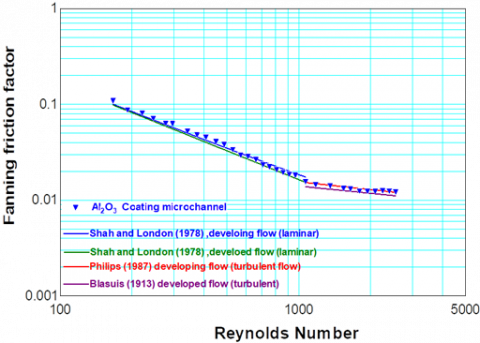
Figure 7. Experimental outcomes comparing fanning friction factor through laminar and turbulent flow correlations in the coating micro-channels
The experimentally Fanning friction factor against Reynolds number of the conventional and coating microchannel as indicates in Figures 6, 7. The comparison with findings of different kinds demonstrates which a correlation for laminar developed flow, Shah and London (1978) came up with a prediction that had a mean absolute error (MAE) of 11.61%, 13.59% and 15.43% for conventional, Al2O3 coated and composite Graphene- Al2O3, respectively.
$M A E=\frac{1}{N} \sum_{j=1}^N \frac{\left|f_{(\text {pred }, j)}\,\,-f_{(\exp , j)}\quad\right|}{f_{(\exp , j), }} × 100 \%$ (19)
During that same time, in laminar developing flow, the correlation of Shah and London offered an agreeable agreement with a mean absolute error (MAE) of 8.39%, 8.48% and 8.59% for conventional, Al2O3 coated and composite Graphene-Al2O3, respectively. In addition, they found that the correlation was supported by the data. On the other hand, the experiment findings for two models at a turbulent zone in fully matured were anticipated by the correlations by Blasius, with a mean absolute error (MAE) around 4.58%, 7.01% and 8.39%, for conventional, Al2O3 coated and composite Graphene-Al2O3, respectively. This was the case for conventional models. During the time period in which turbulent developing flow was present, the correlation study conducted by Phillips indicated accurate estimation with the mean absolute error (MAE) for 4.6%, 2.82% and 2.4% for conventional, Al2O3 coated and composite Graphene-Al2O3, respectively.
Figure 8. Effect of coating microchannel on fanning friction factor
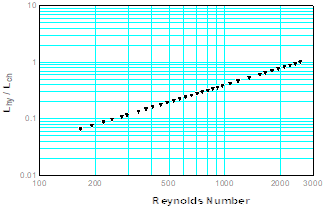
In general, these results suggest which a conventional theory can accurately foresee single-phase flow friction factors in the models for micro-channels that were used as well as under the conditions that were used in the experiments. The image demonstrates that when the Reynolds number increases in the laminar area for all models, there has been a modest transition from a fully formed flow theory to a developing flow theory in the friction factor data as shown in Figure 8. As a consequence of this, the length of the hydrodynamic developing flow was determined by the use of Eq. (20), which was developed by Shah and Bhatti for a circular tube in the laminar area as follows [27]:
$L_{h y}=0.056 \operatorname{Re} D_h$ (20)
Because the hydraulic diameter is comparable across all models of the microchannel, one may deduce that the hydrodynamically growing lengths will also be equivalent across all models when the Reynolds number is held constant. Figure 9 illustrates the influence that the Reynolds number has on the lengths that evolve hydrodynamically for all of the different types of a micro-channel (9). It is possible to draw the conclusion from a figure that even at low Reynolds numbers, the flow is plainly being influenced by hydrodynamically evolving flow. This conclusion may be drawn from the flow diagram.
Figure 9. The influence of Reynolds number on the length of the hydrodynamically evolving micro-channel entry
Figure 10. Comparing the experimental average Nusselt number with laminar flow correlations for conventional micro-channels
3.2 Single-phase heat transfer
Figures 10, 11 and 12 depict the relation between average Nusselt number with Reynolds number of conventional and coating microchannel respectively at the laminar flow regime, for variety of Reynolds number (109.2-2599). According to these results, the values of the average Nusselt number rise with increase In Reynolds number for both conventional micro - channels and coated microchannels. This behavior presents the developing heat transfer theory. The fact that the relaxing segment was not implemented into the testing section of this study is the factor that is most likely responsible for this tendency. Hence, it would appear that the flow is one that is growing thermally. So, the term "augmentation for heat transmission" denotes to existence of a thin thermal boundary layer in a thermally developing region, which, when compared to a thermally completely developed region, has the potential to increase the heat transfer. The length for the thermally growing entry may be determined with the use of an equation developed by Shah and London in 1978, which is written as follows:
$L_{t h}=0.056 \operatorname{Re} \operatorname{Pr} D_h$ (21)
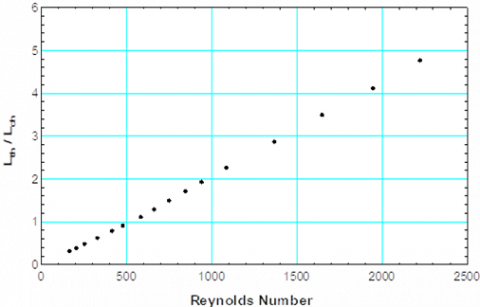
According to Eq. (21), as demonstrated in figure, thermal entry length grows with rising Reynolds number and can occupy whole channel length at Reynolds numbers near 510, as shown in Figure 13.
Figure 11. Comparing the experimental average Nusselt number with laminar flow correlations for coating micro-channels
Figure 12. Effect of coating microchannel on average Nusselt number
However, the figures are displaying also, a comparing for experimental average Nusselt number for conventional and coating microchannel respectively in the laminar regions with correlations of Shah and London, which is given as [19]:
$\begin{aligned} & N u=8.235\left(1-10.6044 \beta+61.1755 \beta^2-\right. \left.155.1803 \beta^3+176.9203 \beta^4-72.9236 \beta^5\right)\end{aligned}$ (22)
$N u=0.775 L_t^{*\left(-\frac{1}{3}\right)}(f R e)_{F D}^{(1 / 3)}$ (23)
where, $\mathrm{L}^*$ is a length of the channel that is dimensionless and may be expressed by an equation [20]:
$L_t^*=\frac{L}{\left(\operatorname{RePr} D_h\right)}$ (24)
In addition, considering the correlation of Mirmanto [28] for micro - channels in the laminar zone for the developing flow, the following seems to be:
$N u=\operatorname{Re}^{0.283} \operatorname{Pr}^{-0.513} L_t^{*-0.309}$ (25)
Figure 13. Influence of Reynolds number on thermal growing length of a micro-channel entry
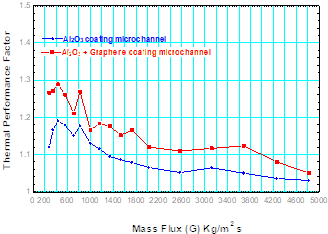
Figure 14. Effect of Reynolds number on thermal performance factor
Nevertheless, the comparing for Shah and London [25], correlations of developing flow with outcomes of conventional shown poor performance prediction using an MAE of 22.23%, however a good agreeable was attained an MAE of 10.73% and 7.44% for Al2O3 coated and composite Graphene-Al2O3, respectively. While, Mirmanto correlation [28] shown poor performance prediction using an MAE of 59.47%, 43.95% and 34.08% for the conventional coated Al2O3 and composite Graphene with Al2O3, respectively. This may stay attributed to a poor heat conductivity of all brass-surfaced models, as the correlation did not account for the material impact. In conclusion, it is evident that the experimental findings of single-phase flow demonstrate which a calibration and measuring system can provide correct outcomes for trials involving two-phase flow. In the Figure 14 showed the Effect of Reynolds number on thermal Performance Factor conventional and coated microchannel. Results demonstrated that the presence of Al2O3 coating and composite Graphene- Al2O3 increases heat transmission cause growth in surface area, fluid mixing, and recirculation. Through the practical results, we notice that the general behavior is close to many researchers, and there is a clear improvement in the rates of heat transfer, and its main reason is the use of nano-coating techniques that help in the formation of gaps and roughness that increase heat transfer and increase the pressure rise.
An investigation into the horizontal single micro-channel in the single phase flow was carried out experimentally. In this case, the tests obtained are used to determine whether there is a mismatch between the current experimental results and the theoretical predictions. An average Nusselt number rises through increasing Reynolds number intended for conventional and coating microchannel conversely to the fully developed heat transfer. Despite this, the comparison for Shah and London [25]. Correlations of developing flow with outcomes of conventional shown poor performance prediction using an MAE of 22.23%. On the other hand, a good agreeable was attained an MAE of 10.73% and 7.44% for coated Al2O3 and composite Graphene-Al2O3, respectively. however, the Mirmanto correlation [28] has showed poor performance prediction utilizing an MAE of 59.47%, 43.95%, and 34.08% for the traditional Al2O3 coated and composite Graphene-Al2O3, respectively. Because the correlation did not take into consideration the influence of the material, it is possible that this will continue to be attributed to the low heat conductivity of all brass-surfaced models. In conclusion, it is clear that the experimental findings of single-phase flow indicate how a calibration and measurement system may produce accurate outcomes for trials using two-phase flow. These findings were obtained from an experiment that used single-phase flow. There is an improvement in heat transfer performance for Al2O3 coated and composite Graphene- Al2O3 through all Reynolds number. fanning friction factor for models with Al2O3 coated and composite Graphene-Al2O3 are a greater than conventional microchannel. The results demonstrated that a conventional correlations is suitable to guess friction factor of conventional micro-channel and Al2O3 coated.
This work was supported by the College of Engineering and the Mechanical Engineering Department in Technology University.
|
A |
Area m2 |
|
Cp |
Specific heat at constant pressure J/kg K |
|
D |
diameter m |
|
f |
Fanning friction factor - |
|
g |
Gravitational acceleration m/s2 |
|
G |
Mass flux kg/m2 s |
|
h |
Heat transfer coefficient W/m2 K |
|
H |
depth m |
|
i |
Enthalpy J/kg |
|
I |
Current A |
|
k |
Thermal conductivity W/m K |
|
L |
length m |
|
$\dot{m}$ |
Mass flow rate kg/s |
|
P |
Power Watt |
|
P |
Pressure Pa |
|
q" |
Heat flux W/m2 |
|
Q |
Heat W |
|
th |
Distance between thermocouple location and channel base m |
|
T |
Temperature ℃ |
|
V |
Voltage V |
|
V |
velocity m/s |
|
W |
width m |
|
Z |
Distance measured from inlet channel m |
|
Re |
Reynolds number |
|
Pr |
Prandtl number |
|
k |
thermal conductivity, W.m-1. K-1 |
|
Nu |
local Nusselt number along the heat source |
|
Greek symbols |
|
|
$\rho$ |
Density kg/m³ |
|
$\beta$ |
Aspect ratio - |
|
$\Delta$ |
Difference, Drop (K, Pa) |
|
$\mu$ |
Viscosity kg/m s |
|
Subscripts |
|
|
a |
Ambient |
|
app |
Apparent |
|
Avg. |
Average |
|
b |
base |
|
ch |
Channel |
|
cu |
Copper |
|
br |
Brass |
|
f |
fluid |
|
FD |
Fully developed flow |
|
e |
Exit |
|
g |
Gas, vapour |
|
h |
hydraulic |
|
hy |
hydrodynamically developing flow |
|
i |
Inlet |
|
l |
Liquid |
|
lg |
Vaporization |
|
loss |
loss |
|
m |
Measured |
|
o |
Outlet |
|
sat |
Saturation |
|
sp |
Single-phase |
|
sc |
Sudden contraction |
|
se |
Sudden expansion |
[1] Mudawar, I. (2013). Recent advances in high-flux, two-phase thermal management. Journal of Thermal Science and Engineering Applications, 5(2): 021012. https://doi.org/10.1115/1.4023599
[2] Harms, T.M., Kazmierczak, M.J., Gerner, F.M. (1999). Developing convective heat transfer in deep rectangular microchannels. International Journal of Heat and Fluid Flow, 20(2): 149-157. https://doi.org/10.1016/S0142-727X(98)10055-3
[3] Qu, W., Mudawar, I. (2002). Experimental and numerical study of pressure drop and heat transfer in a single-phase micro-channel heat sink. International Journal of Heat and Mass Transfer, 45(12): 2549-2565. https://doi.org/10.1016/S0017-9310(01)00337-4
[4] Lee, P.S., Garimella, S.V., Liu, D. (2005). Investigation of heat transfer in rectangular microchannels. International Journal of Heat and Mass Transfer, 48(9): 1688-1704. https://doi.org/10.1016/j.ijheatmasstransfer.2004.11.019
[5] Jung, J.Y., Kwak, H.Y. (2008). Fluid flow and heat transfer in microchannels with rectangular cross section. Heat and Mass Transfer, 44: 1041-1049. https://doi.org/10.1007/s00231-007-0338-4
[6] García-Hernando, N., Acosta-Iborra, A., Ruiz-Rivas, U., Izquierdo, M. (2009). Experimental investigation of fluid flow and heat transfer in a single-phase liquid flow micro-heat exchanger. International Journal of Heat and Mass Transfer, 52(23-24): 5433-5446. https://doi.org/10.1016/j.ijheatmasstransfer.2009.06.034
[7] Mirmanto, M., Kenning, D.B.R., Lewis, J.S., Karayiannis, T.G. (2012). Pressure drop and heat transfer characteristics for single-phase developing flow of water in rectangular microchannels. Journal of Physics: Conference Series, 395(1): 012085. https://doi.org/10.1088/1742-6596/395/1/012085
[8] Lin, T.Y., Kandlikar, S.G. (2012). An experimental investigation of structured roughness effect on heat transfer during single-phase liquid flow at microscale. Journal of Heat Transfer, 134(10). https://doi.org/10.1115/1.4006844
[9] Salem, M.M., Elhsnawi, M.H., Mohamed, S.B. (2013). Experimental investigation of surface roughness effect on single phase fluid flow and heat transfer in micro-tube. International Journal of Mechanical and Mechatronics Engineering, 7(9): 1821-1825. https://doi.org/10.5281/zenodo.1087810
[10] Tamayol, A., Yeom, J., Akbari, M., Bahrami, M. (2013). Low Reynolds number flows across ordered arrays of micro-cylinders embedded in a rectangular micro/minichannel. International Journal of Heat and Mass Transfer, 58(1-2): 420-426. https://doi.org/10.1016/j.ijheatmasstransfer.2012.10.077
[11] Yuan, X., Tao, Z., Li, H., Tian, Y. (2016). Experimental investigation of surface roughness effects on flow behavior and heat transfer characteristics for circular microchannels. Chinese Journal of Aeronautics, 29(6): 1575-1581. https://doi.org/10.1016/j.cja.2016.10.006
[12] Markal, B., Aydin, O., Avci, M. (2016). An experimental investigation of saturated flow boiling heat transfer and pressure drop in square microchannels. International Journal of Refrigeration, 65: 1-11. https://doi.org/10.1016/j.ijrefrig.2015.12.013
[13] Mohammed, S.A., Fayyadh, E.M. (2020). Effect of artificial cavities on heat transfer and flow characteristics microchannel. The Iraqi Journal for Mechanical and Materials Engineering, 20(3): 180-192. https://doi.org/10.32852/iqjfmme.v20i3.511
[14] Khanikar, V., Mudawar, I., Fisher, T.S. (2009). Flow boiling in a micro-channel coated with carbon nanotubes. IEEE Transactions on Components and Packaging Technologies, 32(3): 639-649. https://doi.org/10.1109/TCAPT.2009.2015232
[15] Morshed, A.K.M.M., Paul, T.C., Khan, J. (2013). Effect of Cu–Al2O3 nanocomposite coating on flow boiling performance of a microchannel. Applied Thermal Engineering, 51(1-2): 1135-1143. https://doi.org/10.1016/j.applthermaleng.2012.09.047
[16] Kaya, A., Demiryürek, R., Armağan, E., Ozaydin-Ince, G., Sezen, M., Koşar, A. (2013). Boiling heat transfer enhancement in mini/microtubes via polyhydroxyethylmethacrylate (pHEMA) coatings on inner microtube walls at high mass fluxes. Journal of Micromechanics and Microengineering, 23(11): 115017. https://doi.org/10.1088/0960-1317/23/11/115017
[17] Khalaf, A.F., Basem, A., Hussein, H.Q., Jasim, A.K., Hammoodi, K.A., Al-Tajer, A.M., Omer, I., Flayyih, M.A. (2022). Improvement of heat transfer by using porous media, nanofluid, and fins: A review. International Journal of Heat and Technology, 40(2): 497-521. https://doi.org/10.18280/ijht.400218
[18] Özdemir, M.R., Mahmoud, M.M., Karayiannis, T.G. (2021). Flow boiling of water in a rectangular metallic microchannel. Heat Transfer Engineering, 42(6): 492-516. https://doi.org/10.1080/01457632.2019.1707390
[19] Fayyadh, E.M., Mahmoud, M.M., Sefiane, K., Karayiannis, T.G. (2017). Flow boiling heat transfer of R134a in multi microchannels. International Journal of Heat and Mass Transfer, 110: 422-436. https://doi.org/10.1016/j.ijheatmasstransfer.2017.03.057
[20] Al-Nakeeb, Q.A., Fayyadh, E.M., Hasan, M.R. (2022). Experimental investigation of artificial cavities effect of single-phase fluid flow and heat transfer in single microchannel. Engineering and Technology Journal, 40(1): 109-119. http://doi.org/10.30684/etj.v40i1.2122
[21] Al-Nakeeb, Q.A., Fayyadh, E.M., Hasan, M.R. (2022). Experimental investigation on sub-cooled degree effect on the flow boiling in a microchannel heat sink. In: Ahmad, F., Al-Kayiem, H.H., King Soon, W.P. (eds) ICPER 2020. Lecture Notes in Mechanical Engineering. Springer, Singapore. https://doi.org/10.1007/978-981-19-1939-8_26
[22] Mohammed, S.A., Fayyadh, E.M. (2019). Experimental investigation of sub-cooled flow boiling in metallic microchannel. Engineering and Technology Journal, 37(10A): 408-415. http:// doi.org/10.30684/etj.37.10A.5
[23] Mohammed, S.A., Fayyadh, E.M. (2020). Experimental investigation of heat transfer and flow characteristics in different inlet subcooled flow boiling in microchannel. In IOP Conference Series: Materials Science and Engineering, 671(1): 012023. https://doi.org/10.1088/1757-899X/671/1/012023
[24] Koşar, A., Kuo, C.J., Peles, Y. (2005). Boiling heat transfer in rectangular microchannels with reentrant cavities. International Journal of Heat and Mass Transfer, 48(23-24): 4867-4886. https://doi.org/10.1016/j.ijheatmasstransfer.2005.06.003
[25] Shah, R.K., London, A.L. (1978). Laminar Flow Forced Convection in Ducts. Elsevier.
[26] Al-Nakeeb, Q.A., Fayyadh, E.M., Hasan, M.R. (2021). Experimental investigation of sub-cooled flow boiling heat transfer in single rectangular metallic micro-channel. In IOP Conference Series: Materials Science and Engineering, 1094(1): 012056. https://doi.org/10.1088/1757-899X/1094/1/012056
[27] Mohammed, S.A., Fayyadh, E.M. (2020). Experimental study on heat transfer and flow characteristics in subcooled flow boiling in a microchannel. Journal of Engineering, 26(9): 173-190. https://doi.org/10.31026/j.eng.2020.09.12
[28] Mirmanto, M. (2014). Heat transfer coefficient calculated using a linear pressure gradient assumption and measurement for flow boiling in microchannels. International Journal of Heat and Mass Transfer, 79: 269-278. https://doi.org/10.1016/j.ijheatmasstransfer.2014.08.022