Ilham Wahyu Kuncoro![]() | Zainal Arifin*
| Zainal Arifin*![]() | Eko Prasetya Budiana
| Eko Prasetya Budiana![]() | Miftah Hijriawan
| Miftah Hijriawan![]()
© 2023 IIETA. This article is published by IIETA and is licensed under the CC BY 4.0 license (http://creativecommons.org/licenses/by/4.0/).
OPEN ACCESS
The high use of fossil fuels in recent decades has further encouraged the development of renewable energy sources such as solar and wind energy through solar photovoltaic technology and wind turbines. In this case, vertical axis wind turbine (VAWT) has undergone development due to its various characteristics, such as being able to utilize wind from all directions (omnidirectional), its compact shape, and its ability to operate in areas of low wind potential with high turbulence. This study discusses the integration of a twisted Savonius wind turbine with a solar PV system in a hybrid system with a flat plate deflector configuration to improve wind turbine performance. The flat deflector is a flat surface with controllable width and length installed in front of the turbine. Three variables are tested, Ratio X-Axis, Ratio Y-Axis, and Ratio Width Deflector, with three levels for each variable. Using Design of Experiment (DOE) Full Factorial 33 allowed for 27 run experiments to capture all possible interactions between variables, which will then be analyzed using Analysis of Variance (ANOVA) to determine the influence of each variable. Based on the results of the research obtained, the three factors significantly influence the performance of wind turbines with each contribution of the x-axis ratio of 2.01%, the y-axis ratio of 5.88%, and the width deflector ratio of 90.05%. It can be concluded that the ratio width deflector is the most influential factor. While the order of effects of each factor can be written as follows ratio width deflector > ratio y axis > ratio x axis, with 5/5 D, 3/5 h, and 6/4 r as the optimum value of each factor with an increase in turbine performance compared to the bare turbine is 10.32%.
vertical axis wind turbine, twisted Savonius, flat plate deflector, performance improvement, hybrid system, renewable energy
Fossil fuels are still one of the world’s primary energy sources, with coal, petroleum, and natural gas still accounting for about 79% of the global energy mix [1]. On the other hand, renewable energy sources such as solar and wind energy have continued to grow in the last 20 years, with a more massive dominance of wind energy in their application [2-4]. Wind energy can be utilized using wind turbines both onshore and offshore. However, the wind energy conversion technology is still dominated by the Horizontal Axis Wind Turbine (HAWT) system [5]. Vertical Axis Wind Turbine (VAWT) technology is less attractive to be applied on a large scale because VAWT turbines have several disadvantages, such as efficiency and low tip speed ratio [6].
Several new studies have shown that VAWT technology has evolved, with unique characteristics such as being able to receive wind from all directions (omni-direction), compact shape, and the ability to operate in areas with high turbulence such as urban areas [7-9]. In this regard, various augmented methods have been developed to improve the performance resulting from VAWT. Some can be classified into augmented devices in the form of a uni-directional inlet flow and omnidirectional inlet flow, innovative design, blade modification, and building integrated wind turbines (BIWT) [10]. Augmented devices such as deflectors can increase the power coefficient of wind turbines above the Betz limit [11-13]. In this case, a flat plate is one deflector type with the most basic shape. In addition, this is also influenced by various parameters in its application, such as dimensions, placement, to the angle of inclination of the installation [10, 14]. It can be noticed that at the optimal flat plate deflector position in the lower wind direction, the magnified wind flow induces a higher positive torque on the rotor blades in the upwind region of the VAWT, thereby increasing the power coefficient (Cp) significantly [14].
In this case, the use of augmented devices, mainly flat plate deflectors, has been analyzed as a device that can have a positive effect on Based on research conducted by Wong et al. [14], the use of flat plate deflectors in optimal positions can increase the maximum Cp to 7.4%. In comparison, simulations also show an average increase of up to 33%. In another work by Wong et al. [15], the average cycles’ torque coefficient (Ct) increased by about 47.10% compared to VAWT without deflection. In addition, Rajpar et al. [13] stated that using flat plate deflectors in Savonius turbines with two blades can produce a result or augmented gain of 27.3%. In their research, Qasemi and Azadani [16] also revealed that using deflectors with optimum parameters could increase the efficiency of wind turbines by 16.42% compared to bare turbines. In this case, the use of augmented devices such as flat plate deflectors can be an option in improving the performance of wind turbines [11, 14]. The development of hybrid systems that combine solar panels and wind turbines has led to the exploration of flat plates as a potential means of enhancing performance. Various configurations of flat plates are being investigated to determine their effectiveness in improving the efficiency of these hybrid systems [17-19].
Based on the analysis that has been carried out previously, the application of flat plate deflectors in hybrid solar PV panel systems with VAWT has promising potential to improve turbine performance. In this regard, it is necessary to identify the optimal configuration to obtain the best performance. Therefore, this study will analyze the configuration of the flat plate deflector in its application to the helix-type Savonius-type hybrid PV-wind turbine system. This study investigates the impact of installing a flat plate deflector on wind turbine performance. The analysis will consider several factors, including the ratio of the x-axis, the ratio of the y-axis, and the ratio of the deflector width. The results of this study will provide valuable insights into the effectiveness of using a flat plate deflector to enhance wind turbine performance and the future potential of this application.
2.1 VAWT Savonius helix performance parameters
The Savonius wind turbine is a turbine that utilizes drag force to rotate the turbine blades. In contrast, the lift force does not play an extremely high role in the Savonius. Available wind energy that can potentially be harnessed can be calculated using the following formula [20]:
$P_{\text {avaible }}=\frac{1}{2} \rho A V^3$ (1)
$T_{\text {avaible }}=\frac{1}{2} \rho A V^2 R$ (2)
While the power and power coefficient can be calculated using the following formula:
$P_{\text {turbine }}=T \times \omega_s=\frac{2 \pi N T}{60}$ (3)
$C p=\frac{P_{\text {turbine }}}{P_{\text {avaible }}}$ (4)
$T_{\text {turbine }}=F \times r$ (5)
$C_T=\frac{T_{\text {turbine }}}{T_{\text {avaible }}}$ (6)
$C_p=C_T \times T S R$ (7)
$\lambda=\frac{V_{\text {Rotor }}}{V}=\frac{\omega R}{V}$ (8)
2.2 Geometry VAWT Savonius helix and solar panel
This study investigated the effect of the flat plate deflector installation distance on the performance of the Savonius wind turbine. The installation position of the solar panel is installed vertically at the top of the turbine with an angle of attack of 0° with a distance of 1/5 height turbine.
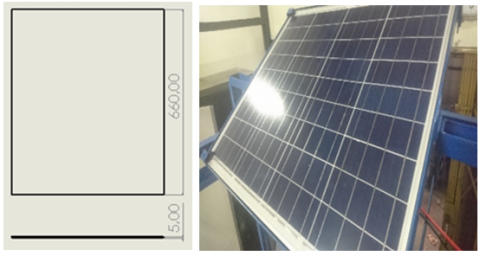
Table 1. Solar panel parameters
|
Parameters |
Value |
|
Length - L |
540 mm |
|
Width - W |
660 mm |
|
Thickness |
5 mm |
Figure 1. Solar panel
The solar panels used are shown in Figure 1 and have dimensions, as shown in Table 1. While the wind turbine used is a type of Savonius Helix VAWT, as shown in Figure 2, with the dimensions indicated in Table 2. This turbine uses an aluminum alloy plate with a thickness of 1 mm.
Table 2. Savonius helix turbine parameters
|
Parameters |
Value |
|
Degree Helix Savonius |
90° |
|
Turbine radius (r) |
220 mm |
|
Turbine height (h) |
440 cm |
|
Height turbine: diameter turbine ratio |
1:1 |
|
Parameters |
Value |
|
Degree Helix Savonius |
90° |
|
Turbine diameter |
440 mm |
|
Turbine height |
440 cm |
|
Height ratio: diameter |
1:1 |
2.3 Lab test condition
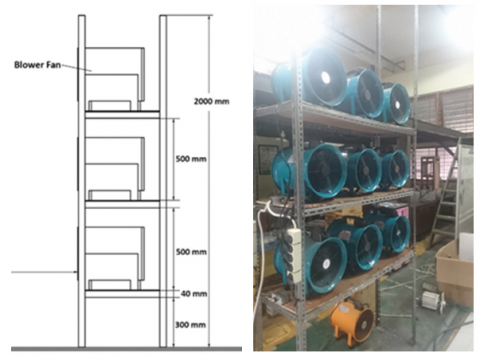
This test used an open channel wind tunnel using nine blower fans with the specifications in Table 3, configured 3x3, as shown in Figure 3. A similar experiment setup was also reported by Wong et al. [14, 21]. With cover up to 1200 mm x 1200 mm cross-section. It was found that the stable wind speed obtained without a turbine reached 4,5 m/s at an average of 9 measurement points with a distance of 3000 mm in front of the wind blower. The wind speed of 4.5 m/s was chosen because the average wind speed in Indonesia is relatively low, and the wind speed of 4.5 m/s was chosen to describe the actual conditions. The Cp and rotation per minute (rpm) of the turbine are calculated using a Prony brake with a digital scale and rpm meter located in the bottom shaft of the turbine itself. Each variation from Table 5 is taken using a Prony brake and Rpm meter with different weights until a Cp curve is obtained for each variation. Data is taken three times according to the randomization of the sequence.
As for this study, the research parameters used are as seen in Table 4, which contains the factor and level of variables and is explained further by scheme Figure 4.
Table 3. Fan blowers parameters
|
Parameters |
Value |
|
Voltage |
220V |
|
Speed |
2900 rpm |
|
Flow Rate |
45 m3/min |
|
Static Pressure |
300 Pa |
Figure 4. Experiment scheme
Table 4. Factor parameter and level
|
Factor Parameters |
Level |
||
|
1 |
2 |
3 |
|
|
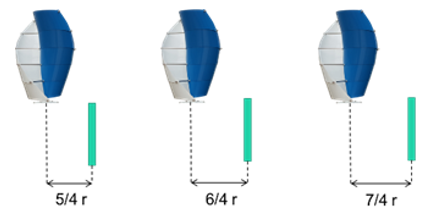
Ratio x-axis |
5/4 r |
6/4 r |
7/4 r |
|
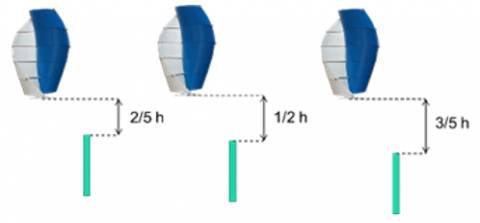
Ratio y-axis |
2/5 h |
1/2 h |
3/5 h |
|
Ratio width deflector |
5/5 D |
7/5 D |
10/5 D |
where, “r” is the radius of the turbine, “h” is the height of the turbine, and “D” is the diameter of the turbine. Figure 4 (a) The flat deflector is mounted on the x-axis, with the center of the turbine axis being the starting point with a certain distance according to the ratio specified in Table 4 on the Factor parameter “Ratio x-axis). Figure 4 (b) flat deflector is mounted on the y-axis with the starting point is the bottom of the turbine and the upper side of the flat deflector, which corresponds with Table 4 on factor parameter “Ratio y-axis” Figure 4 (c) is the position of the flat plate deflector when viewed in the direction of the wind, with the installation of the flat deflector in the middle right on the x-axis, changing the width of the flat deflector according to Table 4 “Ratio width deflector”.
2.4 ANOVA test
Design of experiment is a method that determines every effect caused by each factor by investigating some or all combinations of parameters [22-25]. Some combinations that can be used in investigating these possibilities include Full Factorial Design of Experiment [26, 27]. Full factorial DOE 33 is used with 27 variations using three factors and three levels.
Then to find out the level of significance of each factor, the ANOVA method [22]:
$S S_{T o t}=S S_f+S S_e$ (9)
where,
$S S_{T o t}=\sum_{j=1}^p\left(\gamma_j-\gamma_j\right)$ (10)
Means square defined using,
$M S=\frac{S S}{D F}$ (11)
And F-Value defined using,
$F=\frac{M S_t}{M S_{e t}}$ (12)
While the contribution of each factor was calculated using,
$C \%=\frac{S_A}{S_Z}$ (13)
3.1 Lab experiment data
Data retrieval begins when the turbine has been rotating for 120 s. In Table 5 below, 27 variations have been summarized from Table 4. Utilize a 33 multifactorial design and ANOVA to investigate the relationships between various factors and levels rigorously. However, there are some limitations in this experiment, such as the wind generated using blower that maybe have develop turbulence in air, there are possibly there is an effect to the result. However, this paper uses the same setup explained in Wong et al. [14]. The Prony brake uses a weight adapted from Tjahjana et al. [20].
Table 5. Lab experiment data
|
No. Run |
X |
Y |
D |
Cp |
|
26 |
5/4 |
2/5 |
5/5 |
0.106281 |
|
4 |
6/4 |
2/5 |
5/5 |
0.111174 |
|
3 |
7/4 |
2/5 |
5/5 |
0.106206 |
|
13 |
5/4 |
1/2 |
5/5 |
0.110112 |
|
22 |
6/4 |
1/2 |
5/5 |
0.112653 |
|
6 |
7/4 |
1/2 |
5/5 |
0.108981 |
|
24 |
5/4 |
3/5 |
5/5 |
0.110796 |
|
18 |
6/4 |
3/5 |
5/5 |
0.116782 |
|
2 |
7/4 |
3/5 |
5/5 |
0.109424 |
|
1 |
5/4 |
2/5 |
7/5 |
0.089057 |
|
23 |
6/4 |
2/5 |
7/5 |
0.091895 |
|
5 |
7/4 |
2/5 |
7/5 |
0.087965 |
|
21 |
5/4 |
1/2 |
7/5 |
0.098373 |
|
10 |
6/4 |
1/2 |
7/5 |
0.09941 |
|
27 |
7/4 |
1/2 |
7/5 |
0.097191 |
|
14 |
5/4 |
3/5 |
7/5 |
0.10129 |
|
15 |
6/4 |
3/5 |
7/5 |
0.10157 |
|
19 |
7/4 |
3/5 |
7/5 |
0.100806 |
|
25 |
5/4 |
2/5 |
10/5 |
0.079694 |
|
11 |
6/4 |
2/5 |
10/5 |
0.083145 |
|
8 |
7/4 |
2/5 |
10/5 |
0.078346 |
|
17 |
5/4 |
1/2 |
10/5 |
0.083322 |
|
7 |
6/4 |
1/2 |
10/5 |
0.084396 |
|
9 |
7/4 |
1/2 |
10/5 |
0.080977 |
|
20 |
5/4 |
3/5 |
10/5 |
0.084251 |
|
16 |
6/4 |
3/5 |
10/5 |
0.087869 |
|
12 |
7/4 |
3/5 |
10/5 |
0.083006 |
From Table 5, it can be seen that there are 27 variations with random runs. It can be seen that the highest Cp value is 0.116782 at the run ratio of x-axis with level 6/4 r, a ratio of y-axis with 3/5 h, and a ratio width deflector with 5/5 D. while the lowest Cp value is recorded at 0.078346 at the run ratio of x-axis with level 7/4 r, ratio of y-axis with 2/5 h and a ratio width deflector with 10/5 D.
3.2 The effect of x position
The test results show that there is an effect of the ratio of the Flat Plate Deflector distance on the x-axis to the performance of the turbine can be shown by the difference in turbine rpm and power coefficient (Cp) of the wind turbine. The maximum rpm value was recorded at 175 rpm in the ratio configuration x = 6/4 r with an increase of 7.273% from the maximum bare turbine speed recorded at 165 rpm. Meanwhile, the lowest rpm was obtained at a ratio of x = 7/4 r with rpm recorded at only 137 rpm or a decrease of -19.531% from the bare turbine. The change in rpm is because the air augmentation resulting from the flat plate deflector on the x-axis affects the speed of air coming to the turbine.
Table 5 shows that the maximum Cp value recorded at x = 6/4 r with 0.11678 increased by 10.32% compared to Cp Bare Turbine, which only recorded a value of 0.10586. in comparison, the lowest Cp was recorded at 0.7835 or decreased by -25.99% from the bare turbine. There is an observable pattern in which the peak of Cp is obtained at the ratio x = 6/4 r gives the effect of increasing Cp the highest, followed by a ratio of x = 5/4 and a ratio of x = 7/4 r. The change is caused by other factors, namely the y-axis distance ratio and the deflector width ratio. It can be concluded that there is an increase in performance at a distance ratio of 5/4 r < x < 7/4 r, which can be seen in Figure 5.
Figure 5. Effect of ratio x-axis
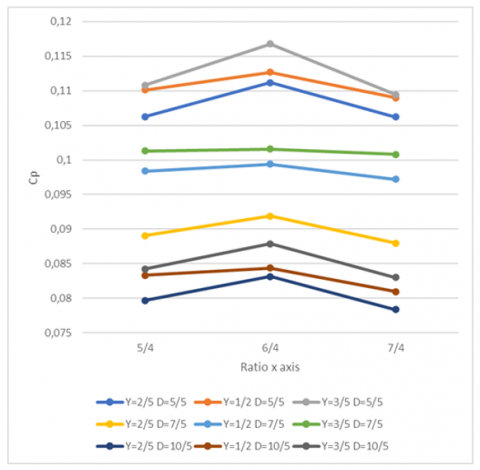
3.3 The effect of y position
On the influence of the Flat Plate Deflector distance ratio on the y-axis, it can be concluded from Table 5 that there is an influence relationship between the coefficient power (Cp) produced and the variation in the distance ratio on the y-axis. From 27 variations, the result was that the ratio y = 3/5 h has the highest Cp value, followed by the ratio y = 1/2 h, and the ratio y = 2/5 h has the lowest Cp value. Figure 5 clearly illustrates the difference between the y-axis ratio to several other factors. There are three groups of lines, each of which describes the upper group of the deflector, and each group describes the line between the ratio x levels.
Figure 6. Effect of ratio y-axis
Figure 6 shows that the increase in the distance of the flat plate deflector results in an increase in the value of Cp. This is because the augmented effect resulting from the flat plate deflector will increase based on the distance on the y-axis with an increase in the range [14]. When compared with the Cp bare turbine value, there are only three variations that provide a positive increase value, namely the ratio group d = 5/5 with all y-level ratios giving a positive effect from the smallest start with y = 2/5 h with a Cp value of 0.106206 or an increase of 0.33% from Cp bare turbine and the largest increase is recorded in the ratio y = 3/5 h with a Cp value of 0.116782 with an increase of 10.32%. Another variation is at a lower Cp value than the bare turbine, and this can occur due to other factors, namely the deflector factor ratio, where the deflector factor ratio = 7/5 h and 10/5 h. It can be concluded that the increase in the flat deflector effect on the y ratio occurs at a distance ratio of 2/5 h <y < 3/5 h.
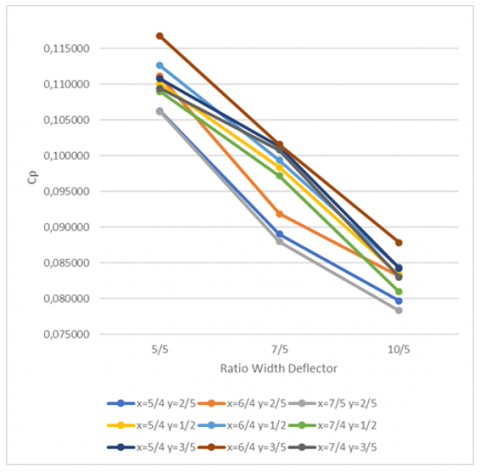
3.4 The effect of deflector length
From the test results of Table 5, it was found that there was a grouping of Cp values based on each variation in the flat plate deflector size ratio with a positive augmentation value obtained at the size ratio = 5/5 D. In comparison, the ratio = 7/5 D and 10/5 D gave a negative augmentation value or lower than the turbine bare Cp value. In all variations, when compared to the deflector size ratio, there is a pattern of decreasing the Cp value, with the highest Cp value obtained at the ratio = 5/5 D followed by the ratio = 7/5 D and 10/5 D.
Figure 7. Effect of ratio width deflector
The resulting augmentation effect at the deflector size ratio = 5/5 D results in an increase in Cp ranging from 0.106206 to 0.116782 or an increase of 0.33% to 10.32%, while a ratio of 7/5 D results in a decrease ranging from 0.101570 to 0.087965 with a percentage -4.05% to -15.87% and the ratio of 10/5 D ranges from 0.087869 to 0.078346 with a percentage of -17% to -25.99% compared to the Cp bare turbine value. Figure 7 shows that the wider the flat plate deflector results in a significant decrease in the Cp value. This can be because the wider the flat plate deflector is at the bottom of the turbine, the increasing airspeed occurs in almost all areas in front of the turbine. As a result, the advancing blade and returning blade receive the same wind speed, which increases drag on the returning blade. The same is observed using a flat plate deflector with optimum value = turbine diameter [16]. So, it can be concluded that the augments effect is around w > 5/5 D.
3.5 ANOVA approach
The ANOVA statistical test is used to analyze the influence of each factor on coefficient power (Cp). Figure 8 illustrates the main effect of each level and factor. It can be known that the effect of each factor is the difference between the maximum and minimum average ratios for the factor. The greater the influence of a factor, the greater the influence of that factor on Cp. From Figure 8, the width deflector ratio has a large pal effect followed by the y-axis ratio and the x-axis ratio. Figure 6 and Table 5 also reinforce the data with the largest Cp value being at run 8 and the Cp value greater than bare turbine on run 1 to run 9.
In addition, from Table 6, DF is the degree of freedom of this experiment, and SS is the sum of square. A big F-Value, with a P-Value of <0.05, indicates the significance of the factor [23, 28]. The ratio x-axis has a P-value of 0.0010880243 which is > 0.05, indicating a significant difference in changes in that factor. It’s also found in the y-axis ratio with a P-value of 0.0000014119 which is > 0.05, which indicates a similar thing. The width deflector ratio has the largest F-value and P-value > 0.05, so there is a significant difference in the change from the factor level. It can be concluded that all three factors have a degree of significance to the change in the value of Cp. Meanwhile, the contribution of each factor is explained in Table 7, with the contribution to Cp being the largest by the width deflector ratio with 90.05%, followed by the y-ratio with 5.8 8% and the x-axis ratio with 2.01%. Compared to previous work, it also found that the width of deflector became the largest contribution to Cp, followed by ratio x-axis and ratio y axis despite the difference in the type of turbine [16].
Figure 8. Main effect for Cp
3.6 Optimum parameter
Table 5 shows that the optimum parameter is obtained from run 18 with a Cp value of 0.11678 with the factor described in Table 8. Similar to the discussion in Figure 7, where the best level of each factor is equal to Table 8, with a ratio of x-axis with level 6/4 r, a ratio of y-axis with 3/5 h, and a ratio width deflector with 5/5 D. From Figures 5, 6, and 7 it can be concluded that the Optimum parameters describe the best results of each factor which at a certain level produces the optimal augmentation effect to improve turbine performance.
Table 6. ANOVA of Cp
|
Source |
DF |
Adj SS |
Adj MS |
F-Value |
P-Value |
|
Ratio x-axis |
2 |
0.000076 |
0.000038 |
9.79 |
0.0010880243 |
|
ratio y-axis |
2 |
0.000222 |
0.000111 |
28.46 |
0.0000014119 |
|
ratio width deflector |
2 |
0.003401 |
0.001700 |
435.65 |
0.0000000000 |
|
Error |
20 |
0.000078 |
0.000004 |
||
|
Total |
26 |
0.003777 |
Table 7. Contribution of each factor to Cp
|
Factor |
Contribution |
|
Ratio x-axis |
2.01% |
|
ratio y-axis |
5.88% |
|
ratio width deflector |
90.05% |
|
Error |
2.07% |
|
Total |
100.00% |
Table 8. Optimum parameter
|
Factor |
Ratio x-axis |
Ratio y-axis |
Ratio Width Deflector |
|
Optimum Level |
6/4 |
3/5 |
5/5 |
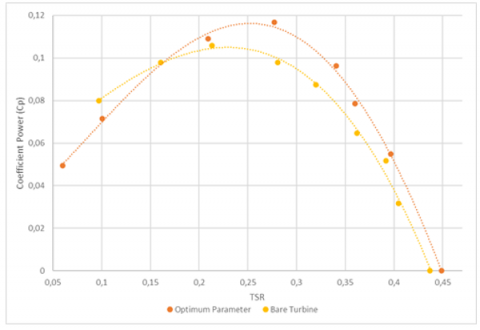
Figure 9 shows run 8 with an optimum parameter compared to a bare turbine, with an optimum Cp value of 0.11678 and a Cp bare turbine value of 0.10586 hence an increase in the Cp value of 10.32%. Compared to the previous study, the increase in maximum Cp value was recorded at 7.3%, but it should be noted that there are different types of wind turbines used, namely using H rotors, but it can be seen that the installation of flat plate deflectors improves Cp performance [14].
Figure 9. Optimum parameters vs bare turbine
The effect of the flat plate deflector on the coefficient power of the vertical axis wind turbine was investigated. The full factorial Design of Experiment 33 resulted in 27 runs. Three factors with three levels, each ratio x-axis, ratio y-axis, and ratio width deflector, were studied. It can be concluded that the ratio width deflector is the factor that has the most influence based on the ANOVA test with F Value 435,65, While the order of effects of each factor can be written as follows ratio width deflector > ratio y axis > ratio x-axis, with a ratio of x-axis with level 6/4 radius turbine, a ratio of y-axis with 3/5 height turbine and a ratio width deflector with 5/5 Diameter turbine is the optimum value of each factor with an increase in turbine performance compared to the bare turbine is 10.32% at Cp 0.11678 at run 18.
The optimum parameters are consistent with the previous studies. Despite the difference in the turbine type, the influence factor order also matched. However, the increase of Cp depends on another factor, such as the wind speed and the height of the solar pv in this hybrid system. The influence of flat plate deflector also can affect the performance of the solar pv by increasing the speed of air, thus cooling down the solar pv. This potential feature can be used for the next hybrid system, such as on the rooftop of a building. For further research, research on the shape of the flat plate deflector and other types of turbines can be developed, and the cooling effect and performance increment for Solar PV also can be evaluated.
This research was supported by a grant from PPS-PTM with the title "Development of a Hybrid Solar PV-Wind Turbine System Configuration Using a Helix Type Savonius Turbine" with contract number 673.1/UN27.22/PT.01.03/2022 from the Ministry of Research, Technology and Higher Education, Republic of Indonesia.
[1] IEA. (2021). World Energy Outlook 2021.
[2] Dehghani-Sanij, A.R., Al-Haq, A., Bastian, J., Luehr, G., Nathwani, J., Dusseault, M.B., Leonenko, Y. (2022). Assessment of current developments and future prospects of wind energy in Canada. Sustainable Energy Technologies and Assessments, 50: 101819. https://doi.org/10.1016/j.seta.2021.101819
[3] Chang, V., Chen, Y., Zhang, Z.J., Xu, Q.A., Baudier, P., Liu, B.S. (2021). The market challenge of wind turbine industry-renewable energy in PR China and Germany. Technological Forecasting and Social Change, 166: 120631. https://doi.org/10.1016/j.techfore.2021.120631
[4] Prasetyo, S.D., Prabowo, A.R., Arifin, Z. (2023). The use of a hybrid photovoltaic/thermal (PV/T) collector system as a sustainable energy-harvest instrument in urban technology. Heliyon, 9(2): e13390. https://doi.org/10.1016/j.heliyon.2023.e13390
[5] Peng, H.Y., Liu, H.J., Yang, J.H. (2021). A review on the wake aerodynamics of H-rotor vertical axis wind turbines. Energy, 232: 121003. https://doi.org/10.1016/j.energy.2021.121003
[6] Tripathi, A., Das, P., Aggarwal, T. (2022). Efficiency enhancement of a hybrid vertical axis wind turbine by utilizing optimum parameters. Materials Today: Proceedings, 62: 3582-3588. https://doi.org/10.1016/j.matpr.2022.04.406
[7] Sun, J., Sun, X., Huang, D. (2020). Aerodynamics of vertical-axis wind turbine with boundary layer suction–Effects of suction momentum. Energy, 209: 118446. https://doi.org/10.1016/j.energy.2020.118446
[8] Li, Y., Zhao, S., Qu, C., Tong, G., Feng, F., Zhao, B., Kotaro, T. (2020). Aerodynamic characteristics of straight-bladed vertical axis wind turbine with a curved-outline wind gathering device. Energy Conversion and Management, 203: 112249. https://doi.org/10.1016/j.enconman.2019.112249
[9] Tian, W., Mao, Z., Ding, H. (2019). Numerical study of a passive-pitch shield for the efficiency improvement of vertical axis wind turbines. Energy Conversion and Management, 183: 732-745. https://doi.org/10.1016/j.enconman.2019.01.006
[10] Karmakar, S.D., Chattopadhyay, H. (2022). A review of augmentation methods to enhance the performance of vertical axis wind turbine. Sustainable Energy Technologies and Assessments, 53: 102469. https://doi.org/10.1016/j.seta.2022.102469
[11] Chong, W.T., Muzammil, W.K., Ong, H.C., Sopian, K., Gwani, M., Fazlizan, A., Poh, S.C. (2019). Performance analysis of the deflector integrated cross axis wind turbine. Renewable Energy, 138: 675-690. https://doi.org/10.1016/j.renene.2019.02.005
[12] Wang, X.H., Wong, K.H., Chong, W.T., Ng, J.H., Qiu, C.J., Khor, C.S. (2022). Performance evaluation of a downwind diffuser on vertical axis wind turbine. International Journal of Energy Research, 46(1): 351-369. https://doi.org/10.1002/er.6890
[13] Rajpar, A.H., Ali, I., Eladwi, A.E., Bashir, M.B.A. (2021). Recent development in the design of wind deflectors for vertical axis wind turbine: A review. Energies, 14(16): 5140. https://doi.org/10.3390/en14165140
[14] Wong, K.H., Chong, W.T., Sukiman, N.L., Shiah, Y.C., Poh, S.C., Sopian, K., Wang, W.C. (2018). Experimental and simulation investigation into the effects of a flat plate deflector on vertical axis wind turbine. Energy Conversion and Management, 160: 109-125. https://doi.org/10.1016/j.enconman.2018.01.029
[15] Wong, K.H., Chong, W.T., Poh, S.C., Shiah, Y.C., Sukiman, N.L., Wang, C.T. (2018). 3D CFD simulation and parametric study of a flat plate deflector for vertical axis wind turbine. Renewable Energy, 129: 32-55. https://doi.org/10.1016/j.renene.2018.05.085
[16] Qasemi, K., Azadani, L.N. (2020). Optimization of the power output of a vertical axis wind turbine augmented with a flat plate deflector. Energy, 202: 117745. https://doi.org/10.1016/j.energy.2020.117745
[17] Patankar, B., Tyagi, R., Kiss, D., Suma, A.B. (2016). Evaluation of an integrated roof wind energy system for urban environments. In Journal of Physics: Conference Series, 753(10): 102007. https://doi.org/10.1088/1742-6596/753/10/102007
[18] Gandhi, R.A., Ravinthiran, A., Palanikumar, K. (2021). Design and development of sail type wind turbine with solar panel. Materials Today: Proceedings, 46: 3989-3992. https://doi.org/10.1016/j.matpr.2021.02.527
[19] Demirdelen, T., Ekinci, F., Mert, B.D., Karasu, İ., Tümay, M. (2020). Green touch for hydrogen production via alkaline electrolysis: The semi-flexible PV panels mounted wind turbine design, production and performance analysis. International Journal of Hydrogen Energy, 45(18): 10680-10695. https://doi.org/10.1016/j.ijhydene.2020.02.007
[20] Tjahjana, D.D.D.P., Arifin, Z., Suyitno, S., Juwana, W.E., Prabowo, A.R., Harsito, C. (2021). Experimental study of the effect of slotted blades on the Savonius wind turbine performance. Theoretical and Applied Mechanics Letters, 11(3): 100249. https://doi.org/10.1016/j.taml.2021.100249
[21] Chong, W.T., Muzammil, W.K., Wong, K.H., Wang, C.T., Gwani, M., Chu, Y.J., Poh, S.C. (2017). Cross axis wind turbine: Pushing the limit of wind turbine technology with complementary design. Applied Energy, 207: 78-95. https://doi.org/10.1016/j.apenergy.2017.06.099
[22] Kuncoro, I.W., Pambudi, N.A., Biddinika, M.K., Budiyanto, C.W. (2020). Optimization of immersion cooling performance using the Taguchi Method. Case Studies in Thermal Engineering, 21: 100729. https://doi.org/10.1016/j.csite.2020.100729
[23] Rocha, P.C., de Araujo, J.C., Lima, R.P., da Silva, M.V., Albiero, D., de Andrade, C.F., Carneiro, F.O.M. (2018). The effects of blade pitch angle on the performance of small-scale wind turbine in urban environments. Energy, 148: 169-178. https://doi.org/10.1016/j.energy.2018.01.096
[24] Arifin, Z., Prasetyo, S.D., Prabowo, A.R., Tjahjana, D.D.D.P., Rachmanto, R.A. (2021). Effect of thermal collector configuration on the photovoltaic heat transfer performance with 3D CFD modeling. Open Engineering, 11(1): 1076-1085. https://doi.org/10.1515/eng-2021-0107
[25] Prasetyo, S.D., Prabowo, A.R., Arifin, Z. (2022). Investigation of thermal collector nanofluids to increase the efficiency of photovoltaic solar cells. International Journal of Heat and Technology, 40(2): 415-422. https://doi.org/10.18280/ijht.400208
[26] Mitić, M., Tošić, S., Pavlović, A., Mašković, P., Kostić, D., Mitić, J., Stevanović, V. (2019). Optimization of the extraction process of minerals from Salvia officinalis L. using factorial design methodology. Microchemical Journal, 145: 1224-1230. https://doi.org/10.1016/j.microc.2018.12.047
[27] Ghani, J.A., Choudhury, I.A., Hassan, H.H. (2004). Application of Taguchi method in the optimization of end milling parameters. Journal of Materials Processing Technology, 145(1): 84-92. https://doi.org/10.1016/S0924-0136(03)00865-3
[28] Mugagga, G.R., Omosa, I.B., Thoruwa, T. (2023). Optimization and analysis of a low-pressure water scrubbing biogas upgrading system via the taguchi and response surface methodology approaches. International Journal of Renewable Energy Development, 12(1): 99-110. https://doi.org/10.14710/ijred.2023.48269