Controlling Nox in Modified High Pressure Split Injection Single Cylinder Diesel Engine with EGR-A Mathematical Approach

Rajoo Balaji![]() | Veeravenakata SatyanarayanaMurthy Yeditha*
| Veeravenakata SatyanarayanaMurthy Yeditha*![]() | Balaji Chittibabu Premkumar
| Balaji Chittibabu Premkumar![]() | Surendra Talari
| Surendra Talari![]() | Ram Mohan Rao Madaka
| Ram Mohan Rao Madaka![]() | Gautam Edara
| Gautam Edara![]()
© 2023 IIETA. This article is published by IIETA and is licensed under the CC BY 4.0 license (http://creativecommons.org/licenses/by/4.0/).
OPEN ACCESS
A single cylinder low powered diesel engine of 3.5kW was modified to run on Common rail direct injection high pressure split injection system. This modified engine was tested to run on the neat diesel with ultra-cooled exhaust gas recirculation. The adjustable working parameters i.e., injection pressures 200bar, 230bar, 250bar, 300bar and 350bar, retarded injection -11°, split injection -54°and -11°. After Top dead center position, Exhaust gas recirculation flow rates 5% & 10% respectively are tested on this engine under two typical operating conditions of ¼ full load of 0.875kW and ¾ full load of 2.625kW respectively. Single factor and multifactor orthogonal quadratic regression analysis has been carried to determine the effect of these 4 working parameters on engine emissions NOx. The mathematical equations characterizing the relationship between these 4 operating variables are formed. The equation of the NOx and noise was from the orthogonal regressive test under 1/4 Full load and ¾ Full load conditions was set as the objective function and the ranges of these 4 working variables are given as the constraint condition. Models of non-linear programming were then formulated and solved by using statistical analytical software. Test results showed that 10% Single Injection generates NOx of 194.87 parts per million while 10% Multiple fuel injection generates 199 while the minimum NOx that can be produced is 134.27.
NOx, split injection, EGR, regression analysis
Increase in number of vehicles globally possessing a serious threat to environmental pollution all over the world. In addition to these various reasons such as fuel specifications, fuel control, injection pressure, spray pattern, quantity and fuel timing, engine operating parameters like load, speed, turbocharging & super charger controlling techniques, amount of exhaust gas recirculation (EGR) etc. directly effects the emissions released from the engine. Light duty low capacity diesel generator sets and agricultural diesel engines are one of the major contributors for deteriorating the atmospheric air quality. Controlled fuel injection is one of the promising techniques in reducing the NOx and smoke. EGR circulation has proven history in controlling the NOx but however there is an increase in soot. Hence to control both NOx and smoke a combined strategy of fuel injection control along with EGR circulation will be effective in reducing the engine emissions. Hence in the latest emission control strategy adopted in diesel engines split injection with EGR is used to regulate the emissions. This method is proven to be the most prominent technique in IC engines to regulate the NOx and Smoke. Advanced combustion technologies use EGR technique for Gas and biodiesel fuels [1]. Research results show that the engine performance will be affected by the circulation of exhaust gas. It was reported that cooled EGR is more effective in reducing the NOx emissions as compared to the hot EGR. However, trade off results reported with EGR that engine brake thermal efficiency is better with hot EGR as compared to the cooled EGR [2]. In take charge temperature is higher in hot EGR which leads to better brake thermal efficiency [3]. The effect of cooled EGR for different flow rates in turbocharged heavy duty diesel engines reduced the amount of bsfc and Soot with limited effect on reducing NOx emissions [4]. Yu et al. [5] investigated the effect of EGR flow rates, equivalence ratio and flame temperature on engine brake thermal efficiency. They found that when the equivalence ratio is increased to near about 1.0 then amount of Carbon monoxide (CO) concentration in the exhaust was decreased. Studies carried by Feng et al. [6] on low combustion engine reported that there is no increase in peak pressure when the flow rates of EGR further increased. Simultaneously they noticed an increase in ignition delay, due to increase in the boiling point at the initial stage. Verschaeren et al. [7] conducted experiments on low, medium speed engines having two camshaft configurations with combined EGR and variable valve timings. They achieved higher amount of NOx reduction and also a decrease in trade-off results between unburnt hydrocarbons (UHC) and NOx emissions. In addition to this carbon monoxide and particulate matter (PM) also reduced in the entire engine loading conditions. They concluded this is mainly due to the higher volumetric efficiency. Homogeneous charge compression ignition (HCCI) combustion with emphasis on EGR is proven technique to reduce the NOx emissions. Fang et al. [8] investigated the effect of pilot fuel injection which is injected much early compared to the main or secondary injection in HCCI heavy duty engine with EGR. Experiment results revealed that an increase in quantity of pilot injection decreased NOx emissions with low flow rates of EGR. Engelmayer et al. [9] tested a 300kW power single cylinder diesel engine with high pressure fuel injection system. In his experiments he studied spray characteristics, combustion phenomenon and soot formation. He reported that there is an effective reduction in soot that can be lowered both at part and full load engine operation under high pressure fuel injection while circulating EGR through the inlet manifold. There is a unique demand for more torque, higher power output, decrease in fuel consumption and vehicle emissions in passenger cars. To meet this requirement common rail direct injection (CRDI) was modified to run on pulse or multiple injections either with separation or without it. Delphi Lucas has developed efficient fuel injection system (FIP) to meet the above requirements which suits mostly for diesel fuel. The fuel injection equipment developed by Delphi Lucas was capable of injecting the fuel at very high pressure at the same time it reduces the separation time between two pulse injection duration even close to zero micro seconds. Because of this the engine is capable of avoiding the longer premixed combustion and diffusion combustion was improved with reduction in NOx emissions when EGR is also circulated. But in this technique higher amount of HC and CO is noticed when the fuel injection is advanced with EGR circulation. Lean combustion and decrease in combustion temperature is reported to be the reason for this higher amount of HC and CO emissions [10]. Lee et al. [11] achieved significant improvement of in power out of the engine when the pilot fuel is injected with multi hole injector consisting of 14 holes when the engine is running under idling conditions along with EGR. Simultaneous reduction in PM and NOx was also reported. When the temperature of the exhaust gas is kept very low then greater mass of exhaust gas can be easily handled in less available space due to the decrease in the density of the exhaust gas. Hence the engine can take more amount of fresh air allowing higher amount of EGR percentage in the fresh air. Low temperature exhaust gas (EGR) was tested in Sports utility vehicle (SUV) engine by Mehrotra et al. [12]. Their research findings shown that it is possible to supply more heat by EGR technique due to the increase in capacity of intake air by the engine. In test results they found that around 16.4% of NOx and 23.3% of PM was reduced for the same amount of fuel consumption when low temperature EGR is supplied to the engine. When EGR is cooled to very low temperature designated as ultra-cooled EGR it was observed that there is an increase in thermal efficiency with reduction in NOx and PM but however there is an increase in HC and CO emission as per the experimental results of Brijesh et al. [13]. The above results reported when the fuel injection pressure is maintained at lower values. Cheng et al. [14] studied the effect of EGR on PCCI combustion under the advanced fuel injection timing. They reported that when fuel injection is advanced in PCCI combustion there is an increase in cylinder peak pressure, shorter ignition delay with simultaneous reduction in NOx, Particulate matter (PM) and soot emissions. However, in this technique there is an increase in HC and CO emissions. High EGR flow rates and 50% mass share of pilot and main injection respectively in single cylinder direct injection diesel engine were investigated by the Sarangi et al. [15]. The results reveal that split injection along with EGR circulation has direct influence on the amount of EGR that needed to be recirculated. They concluded that in split injection along with EGR supply the engine requires less amount of EGR as compared to the conventional direct injection technique. NOx can be effectively reduced without any compromise on the brake thermal efficiency. It has been observed that almost 17% amount of smoke was reduced with this split injection and EGR supply for diesel engines. Yang and Chung [16] in his experiments on diesel engine with high pressure split injection equipment which injects pressure up to 2000bar studied the effect of number of pulse injection in a cycle on engine emissions. The split injections are delivered by the electronically controlled fuel injection equipment which injects the fuel for 6 pulse injections in a given cycle. Their research findings shown that up to 1000bar fuel injection pressure there is high combustion gas temperatures are noted due to the intense and rapid combustion that is existing inside the combustion chamber. Yin et al. [17] noticed that higher amount of EGR is needed for advanced fuel injection without any split injection when the fuel is injected under very high pressure to reduce NOx and soot emissions. There is a drastic reduction in soot released however NOx decreased marginally with increase in bsfc. When fuel injection is advanced the quantity of pilot injection can be reduced to minimum quantity in the case of split injection at the same time the brake specific fuel consumption is also improved. The effect of number of pulse injections along with EGR was investigated using numerical simulations by Wang et al. [18]. They reported that a greater number of pulse injections without any EGR is proven to be more effective than a smaller number of pulse injections. The simulation results show that 5 pulse injections together with EGR is more effective that 3 pulse injections. In pulse injections the role of EGR is highly limited and much reduction in NOx and Soot is not observed in pulse injections with EGR. Grey-Fuzzy Taguchi method is applied to the study the experimental results conducted by Roy et al. [19] on light duty modified single cylinder engine to run on CRDI and EGR is also supplied. They concluded that EGR is effective parameter and plays a significant role in reducing the engine emissions. Limited information regarding the effect of dual combination of ultra-cooled EGR and pulse injections in light duty low powered diesel engines under low and high engine operation conditions are not available. Thus, present research work mainly focusses to investigate the research gap mentioned above on a single cylinder low powered diesel engine of 3.5kW which is modified to work on CRDI for injecting the fuel under very high pressure with electronically controlled fuel injection system capable of delivering 3 pulse injections at 1000bar injection pressure at the engine speed of 1500rpm. The FIS is capable of controlling precisely both the injection quantity and timing by programmable electronic controller. In this present research work 2 pulse injections at different pressures ranging from 210bar to 1000bar in which 1st pulse is pilot injection contains 10% of mass share injected at -54CAD and 2nd pulse is main injection contains remaining 90% mass share of the fuel injected at -11CAD. Two ultra-cooled EGR flow rates were chosen consisting of 5% and 10% on volume basis of the intake air.
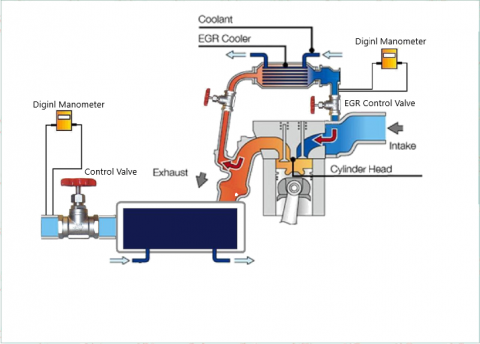
In the present research work intense experiments were conducted with much emphasis on reducing the NOx by optimizing the engine operating working parameters on low powered single cylinder diesel engine of 3.5kW which is modified from direct injection to CRDI high pressure fuel injection capable of injecting 3 pulse injections up to 1000bar pressure. Ultra cooled EGR is circulated at various flow rates ranging from 5% to 50% of volume basis of air as shown in Figure 1. Detailed engine specifications are shown in the following Tables 1 and 2.
Figure 1. Schematic diagram of high-pressure multiple split injection engine test rig with exhaust gas recirculation facility
Figure 2. Schematic layout of EGR set up
Figure 3. Experiment test rig
Table 1. Engine specifications of the modified single cylinder diesel high pressure fuel injection test rig
|
Parameter |
Specification |
|
Make |
Kirloskar |
|
Model |
AV1 |
|
Type |
Single cylinder, 4 Stroke, Direct Injection, Water cooled CI Engine |
|
Rated Power |
3.70 kW@1500r.p.m |
|
Engine speed |
1500r.p.m |
|
Fuel |
Diesel |
|
Bore & Stroke |
80*110mm |
|
Displacement |
553E-6m3 |
|
Compression Ratio |
16.5:1, Range: 13.51 to 20.0 |
|
Injection Pressure |
200bar-350bar |
|
Cylinder Pressure |
Piezo Sensor, Range: 200 Psi |
|
Nozzle |
1 hole, Ø 0.00200m |
|
Dynamometer |
Eddy current dynamometer |
|
Orifice Diameter |
20.00mm |
Table 2. Measuring range and accuracy of 5gas analyzer
|
Measured Qty. |
Measuring Range |
Accuracy |
|
Oxygen |
0-10.0vol% |
0.01% |
|
CO |
0-10.0vol% |
+/-0.01vol% |
|
CO2 |
0-10.0vol% |
+/-0.01vol% |
|
Smoke opacity |
1-100HSU |
+/-0.1HSU |
|
HC |
0-1000ppm |
+/-1ppm |
|
NOx |
0-2000ppm |
+/-1ppm |
|
Temperature |
-40℃ to 650℃ |
±1% (T<150℃), ±2% (T<250℃), ±3% (T>350℃) |
A Kirloskar single cylinder diesel engine of low power capacity of 3.5kW was chosen and converted to work on CRDI mode fitted with high pressure pulse fuel injection kit and dynamometer of Powermag India Ltd make. Figures 2 and 3 represents the diagrammatic and schematic representation of the experimental setup. A flush in type transducer of piezoelectric type and it is provided with cooling water supplied to the engine cylinder body. An adaptor is provided for careful regulation of the flow water to this piezoelectric pressure transducer. This pressure senor is used to measure the in-cylinder gas pressure inside the combustion chamber. A crank angle encoder is fitted on the camshaft side to measure the crank rotation. A sleek mark is marked on the fly wheel to identify the exact location of the Top dead Centre (TDC) position in coincidence with valve timing diagram. The same sleek mark is used for crankshaft encoder as a reference point, which transmits the electronic signals to the data logger acquisition system to record the position of the crankshaft. A pressure sensor is mounted on the cylinder wall side is air cooled type of Kistler make to this a charge amplifier is connected through a cable which can withstand for high combustion temperature. A separate fuel injection timing kit is fitted with electronic controller and this timing kit consists of all the components of CRDI system. This timing kit with electronic controller will precisely control the fuel injection timing and quantity also. There is low pressure and high-pressure circuits in this fuel supply system. This system is designed for unvarying maintain and constant pressure. A 5H.P. capacity electric motor is used to drive the high pressure fuel pump capable of delivering a pressure up to 1000bar. An electromagnet solenoid valve is used in this pump to control the fuel rail pressure. For suitable safety of the system a pressure relief valve is provided in case of relieving the pressure from the pressure buildup in the rails. In this experimental equipment the conventional mechanical fuel injector was replaced by the electromagnet system. In this system a solenoid armature will not control the pintle movement of the injector rather a small rotating ball is used. This rotating ball will regulate the fuel flow in the valve control chamber of the fuel injector. Electronic control unit (ECU) receives the data from the typically positioned crankshaft senor. The start of injection and duration is typically governed by the preprogrammed electronic controller provided in the control unit. The input signal received by the microcontroller from the crankshaft position encoder will be sent to the PC hardware. Thus, in this experimental setup the fuel injector will be totally controlled by the electronic control unit (ECU) but not by the cam operation. The exhaust gas leaving the exhaust manifold line will be tapped by the stepper motor control valve and regulated and required quantity of the exhaust gas will be sent to the water cooler. A digital manometer is provided to know the flow rate of the exhaust gas. Hence an ultra-cooled exhaust gas is supplied to the engine through the inlet manifold.
Intense experiments are conducted on this 4 stroke CRDI modified diesel engine with power capacity of generating 3.5kW and this is a single cylinder engine. A detailed engine specifications are carefully tabulated in the Table 1 as given below. Experiments were conducted carefully before taking any reading the engine is run for almost 30minutes for measuring any reading until there is no consistent deviation for engine speed, intake air temperature, flow rates of EGR and cooling water are noticed. The sketch of the entire experiment setup is given in Figures 2 and 3 respectively. For measuring the engine load an air cooled Eddy current dynamometer is used and load is gradually applied in steps of 0.25kW each by regulating the voltage, current and engine speed simultaneously. A gas analyzer supplied by INDUS Make, Bangalore, India is used to measure 5 gas emissions such as UHC, CO, CO2, O2 and NOx. This gas analyzer is certified by Automotive research authority of India (ARAI). This instrument is well calibrated and certified before the experimentation. Calibration is done with syngas containing CO in N2 10%, CO2 in N2 5% and NO2 in N2 2000 ppm as given in Table 2. At room temperature the instrument will be checked for the oxygen content when the oxygen content is 20.9% while the remaining emissions are kept at zero then only emission readings need to be taken. Otherwise, the instrument must be rechecked for any left-over hydrocarbons and air filter should be immediately replaced. A warmup time need to be provided before taking any measurement usually a 15minutes time need to be provided before taking any readings. Experimentation was conducted in stages in the first stage the engine is allowed to run on pure diesel and all the engine performance and emission parameters are recorded. A series of tests are conducted by varying the engine operating loads ranging from 0.5 to 3.5kW respectively. Two injection strategies are chosen and tested in this injection. Firstly, single retarded injection in which the diesel fuel is injected at -11 CAD (crank angle in degrees) before Top dead Centre (TDC) at various injection pressures ranging from 200bar, 250bar, 300bar and 350bar respectively without supplying the EGR under different engine operating loads from no load to full load conditions. Experiments are repeated again for the same engine operating conditions now supplying the EGR at different flow rates of 5% and 10% respectively. After that the fuel injection strategy was changed to pulse injection which consists of 2 split injections having a mass share of 10% fuel for first pulse and remaining 90% mass share for the second pulse. In this pulse injections the first pulse is injected at -54CAD and second pulse is injected at -11CAD respectively. For this pulse injection the fuel is injected at pressures of 200bar, 250bar, 300bar and 350bar respectively. In this pulse injections the EGR flow rates are taken as 5% and 10% of the mass share basis of air inducted in to the engine cylinder. All these tests are conducted keeping the engine at constant speed of 1500r.p.m. Every reading is carefully taken while the engine is run for at least 30minutes till there is no abnormal change in temperatures of both cooling and exhaust gas temperatures while operating the engine at a particular loading condition. Fuel measurement is noted for 3 times for each operating condition and the average measurement value is taken for calculation of bsfc, brake thermal efficiency etc. The fuel oil filter is changed frequently throughout the experiment work and left over fuel in the fuel tank in the previous experiment is drained out from the fuel tank and neat diesel fuel is taken for each successive experimentation. All the measured values are taken for the average of 3 readings for each operating condition and recorded. Subsequently NOx and Smoke opacity is recorded for each operating condition. The Gas analyzer filter is changed regularly and frequently during the entire experimentation.
In this regression orthogonal numerical calculation xj (j=1, 2, 3, 4) is the level of each factor and X1j and X2j are upper and lower limits of the factors, then the zero level of the factor can be represented by X0j=(X1j+X2j)/2. The Eq. (1) is used for determining the required number of numerical calculations that are necessary for the experimental programme. Then these results are compared with the 5 levels and 4 factors (i.e., 54=625 times), only needs 17 times. The calculation period is reduced to 2.72% of the original one.
$n=m_0+m_c+m_r$ (1)
where, m0, the center tests’ number, is 1; mc, the times of two level test, is 2p-1; mr, the asterisk test, is 2p; p, the number of factors, is 4; r, the asterisk arm length, is: r=(√n mc-mc)1/2/√2 (i.e., r=1.353).
The test level is changed for number of steps that can be find by the lower and upper limits of the factors and asterisk arm length.
$\Delta_{\mathrm{j}}=\mathrm{X}_{1 \mathrm{j}}-\mathrm{X}_{2 \mathrm{j}} / 2 \mathrm{r}$ (2)
These factors should be kept in consistent dimension and they should not be deviate to a large degree in the orthogonal regression test. Thus the natural variables of each factor should be treated in the centralization. Suppose zj is code value obtained after the centralization of each factor level value, then Zj (Xj+X0j)/∆j. Here both the test results and simultaneously the analysis results are represented here. A regression equation which is unique and unified form was developed after processing the data from the orthogonal table given above:
$\mathrm{s}=\sum_{\mathrm{j}=1}^{\mathrm{n}} Y \mathrm{j}_{-1 / \mathrm{n}}\left(\sum_{\mathrm{j}=1}^{\mathrm{n}} \mathrm{Yj}\right)^2$ (3)
3.1 Single variable test
A single variable test is performed to identify the most influencing working engine operating parameter on NOx emissions. Separate single variable test is conducted for each injection variable of 5%SI, 10%SI, 5%MPFI and 10%MPFI. In this analysis the most influence variable for reducing the engine emissions is NOx and hence this single variable was chosen and using and an orthogonal regression analysis is conducted using 4 different factors of fuel injection strategies of SI, MPFI and EGR flow rates. Quadratic orthogonal regression array was computed using 26 arrays corresponding to 4 variables as seen in Table 3.
3.2 Quadratic orthogonal regression test
Quadratic regressive orthogonal test involving 4 factors is conducted to bring a relationship among adjustable working parameters for NOx emissions in the engine [20, 21]. Engine tests are conducted to identify the most significant factor effecting the NOx emissions in the modified single cylinder low-capacity engine which runs on CRDI system and these results are performed statistical analysis applying the quadratic orthogonal regressive technique. The quadratic relation coefficients are calculated using the equation in section 5.1. The weighting value of each quadratic coefficient was chosen from 0 to 1. In this present study the weighting value for the constraints assigned is+/-1.483. The results are analyzed for the engine operating parameters of ¼ Full load (0.875kW) and b) ¾ Full load (2.625kW) at different injection pressures of 200bar, 250bar, 300bar and 350bar respectively. Table 3 shows the arrangement of the test parameters and levels of the selected variables.
4.1 SI with 5% EGR flow rate for retarded single injection at -11ATDC
Adjust the Exhaust gas circulation to 5% of the intake air measured by Vol/Vol basis and the fuel injection pressure to 200bar, 250bar, 300bar and 350bar respectively and measure the engine emissions NOx. Figure 4 shows the five treatments of 5% EGR at two different ranges of power (0.875kW & 2.625kW) at constant rated speed of 1500rpm. Figure 4 shows that increase in injection pressure NOx increases. The curves continued to increase up to 300bar and then start to decrease after 300bar at 0.875kW power but for the ¾ Full load 2.625kW it is continuously increases from 200bar to 350bar.
4.2 SI with 10% EGR flow rate for retarded single injection at -11ATDC
Adjust the Exhaust gas circulation to 10% of the intake air measured by Vol/Vol basis and the fuel injection pressure to 200bar, 250bar, 300bar and 350bar respectively and measure the engine emissions NOx. Figure 5 shows the five treatments of 5%EGR at two different ranges of power (0.875kW and 2.625kW) at constant rated speed of 1500rpm. Figure 5 shows that increase in injection pressure NOx increases. The curves continued to increase up to 350bar for both 0.875kW and 2.625kW respectively.
4.3 MPFI with 5% EGR flow rate for pilot injection at - 54ATDC and main injection at-11ATDC
The fuel is injected in two split injections where the first injection is pilot injection consists of 10% fuel quantity is injected at -54°ATDCof crank angle and the second injection is the main injection consists of 90% of fuel quantity injected at -11°ATDC. The exhaust gas flow rate is adjusted to 5% of the intake air by vol/vol basis. Figure 6 shows the five treatments of 5%EGR at two different ranges of power 0.875kW and 2.625kW at constant speed of 1500rpm. Figure 6 shows that NOx increases up to 340bar and then start decreases after 340bar fuel injection pressure for both operating conditions of 0.875kW and 2.625kW.
4.4 MPFI with 10% EGR flow rate for pilot injection at - 54ATDC and main injection at-11ATDC
The fuel is injected in two split injections where the first injection is pilot injection consists of 10% fuel quantity is injected at -54°ATDCof crank angle and the second injection is the main injection consists of 90% of fuel quantity injected at -11ATDC. The exhaust gas flow rate is adjusted to 5% of the intake air by vol/vol basis. Figure7 shows the five treatments of 10% EGR at two different range of power 0.875kW and 2.625kW at constant speed of 1500rpm. Figure7 shows that NOx increases up to 325bar and then start decreases after 325bar fuel injection pressure for both operating conditions of 0.875kW and 2.625kW.
Table 3. Design level of 4 variables in the quadratic regressive orthogonal test NOx emission analysis [22]
|
Variables |
Change of Intervals |
Design of Level of Variables (mo=2, r=1.483) |
|||||
|
∆j |
∆j / 2 |
-r |
-1 |
0 |
+1 |
+r |
|
|
X1 |
258.67 |
129.33 |
386 |
525.33 |
774 |
1032.67 |
1162 |
|
X2 |
84 |
42 |
154 |
196 |
280 |
364 |
406 |
|
X3 |
285.33 |
142.67 |
412 |
554.67 |
840 |
1125.32 |
1268 |
|
X4 |
39.33 |
19.67 |
182 |
201.67 |
241 |
280.32 |
300 |
Figure 4. Relationship between NOx and Injection pressure at SI 5% EGR
Figure 5. Relationship between NOx and Injection pressure at SI 10% EGR
Figure 6. Relationship between NOx and Injection pressure at MPFI 5% EGR
Figure 7. Relationship between NOx and injection pressure at MPFI 10% EGR
The results of quadratic regressive orthogonal test are shown in Table 4. After significance test on regression coefficients and regression formulas, the equations that relate the four working parameters to NOx for the two operating conditions were formulated as follows [23, 24].
Table 4. Variables and computed test results obtained from orthogonal quadratic regression analysis
|
X0 |
X1 |
X2 |
X3 |
X4 |
X1 X2 |
X1X3 |
X1 X4 |
|
1 |
1 |
1 |
1 |
1 |
1 |
1 |
1 |
|
1 |
1 |
1 |
1 |
-1 |
1 |
1 |
-1 |
|
1 |
1 |
1 |
-1 |
1 |
1 |
-1 |
1 |
|
1 |
1 |
1 |
-1 |
-1 |
1 |
-1 |
-1 |
|
1 |
1 |
-1 |
1 |
1 |
-1 |
1 |
1 |
|
1 |
1 |
-1 |
1 |
-1 |
-1 |
1 |
-1 |
|
1 |
1 |
-1 |
-1 |
1 |
-1 |
-1 |
1 |
|
1 |
1 |
-1 |
-1 |
-1 |
-1 |
-1 |
-1 |
|
1 |
-1 |
1 |
1 |
1 |
-1 |
-1 |
-1 |
|
1 |
-1 |
1 |
1 |
-1 |
-1 |
-1 |
1 |
|
1 |
-1 |
1 |
-1 |
1 |
-1 |
1 |
-1 |
|
1 |
-1 |
1 |
-1 |
-1 |
-1 |
1 |
1 |
|
1 |
-1 |
-1 |
1 |
1 |
1 |
-1 |
-1 |
|
1 |
-1 |
-1 |
1 |
-1 |
1 |
-1 |
1 |
|
1 |
-1 |
-1 |
-1 |
1 |
1 |
1 |
-1 |
|
1 |
-1 |
-1 |
-1 |
-1 |
1 |
1 |
1 |
|
1 |
1.483 |
0 |
0 |
0 |
0 |
0 |
0 |
|
1 |
-1.483 |
0 |
0 |
0 |
0 |
0 |
0 |
|
1 |
0 |
1.483 |
0 |
0 |
0 |
0 |
0 |
|
1 |
0 |
-1.483 |
0 |
0 |
0 |
0 |
0 |
|
1 |
0 |
0 |
1.483 |
0 |
0 |
0 |
0 |
|
1 |
0 |
0 |
-1.483 |
0 |
0 |
0 |
0 |
|
1 |
0 |
0 |
0 |
1.483 |
0 |
0 |
0 |
|
1 |
0 |
0 |
0 |
-1.483 |
0 |
0 |
0 |
|
1 |
0 |
0 |
0 |
0 |
0 |
0 |
0 |
|
1 |
0 |
0 |
0 |
0 |
0 |
0 |
0 |
|
X2 X3 |
X2 X4 |
X3 X4 |
X12 |
X22 |
X32 |
X42 |
Y1 |
|
1 |
1 |
1 |
1 |
1 |
1 |
1 |
571 |
|
1 |
-1 |
-1 |
1 |
1 |
1 |
1 |
978 |
|
-1 |
1 |
-1 |
1 |
1 |
1 |
1 |
839 |
|
-1 |
-1 |
1 |
1 |
1 |
1 |
1 |
654 |
|
-1 |
-1 |
1 |
1 |
1 |
1 |
1 |
926 |
|
-1 |
1 |
-1 |
1 |
1 |
1 |
1 |
1162 |
|
1 |
-1 |
-1 |
1 |
1 |
1 |
1 |
243 |
|
1 |
1 |
1 |
1 |
1 |
1 |
1 |
317 |
|
1 |
1 |
1 |
1 |
1 |
1 |
1 |
332 |
|
1 |
-1 |
-1 |
1 |
1 |
1 |
1 |
265 |
|
-1 |
1 |
-1 |
1 |
1 |
1 |
1 |
350 |
|
-1 |
-1 |
1 |
1 |
1 |
1 |
1 |
406 |
|
-1 |
-1 |
1 |
1 |
1 |
1 |
1 |
654 |
|
-1 |
1 |
-1 |
1 |
1 |
1 |
1 |
823 |
|
1 |
-1 |
-1 |
1 |
1 |
1 |
1 |
1065 |
|
1 |
1 |
1 |
1 |
1 |
1 |
1 |
765 |
|
0 |
0 |
0 |
2.1993 |
0 |
0 |
0 |
1114 |
|
0 |
0 |
0 |
2.1993 |
0 |
0 |
0 |
1268 |
|
0 |
0 |
0 |
0 |
2.1993 |
0 |
0 |
215 |
|
0 |
0 |
0 |
0 |
2.1993 |
0 |
0 |
212 |
|
0 |
0 |
0 |
0 |
0 |
2.1993 |
0 |
300 |
|
0 |
0 |
0 |
0 |
0 |
2.1993 |
0 |
294 |
|
0 |
0 |
0 |
0 |
0 |
0 |
2.1993 |
182 |
|
0 |
0 |
0 |
0 |
0 |
0 |
2.1993 |
206 |
|
0 |
0 |
0 |
0 |
0 |
0 |
0 |
246 |
|
0 |
0 |
0 |
0 |
0 |
0 |
0 |
243 |
5.1 Optimization of working parameters
$\begin{aligned} & Y_2=251.972+39.298 x_1-76.258 x_2+52.989 x_3 -20.864 x_4+146.75 x_1 x_2+131 x_1 x_3-42.125 x_1 x_4 -79.875 x_2 x_3-2 x_2 x_4-68.75 x_3 x_4+425.082 x_1^2 -19.38 x_2^2+18.587 x_3^2-28.246 x_4^2 .\end{aligned}$
5.2 Constraint condition
$X_i-1.483 \leq 0$
where, i=1, 2, 3, 4.
With the help of statistical analytical software, the optimal combinations of the above 4 working parameters will be determined. The following results were obtained:
$\begin{aligned} & X_1=514.6, X_2=194.873, X_3=553.73, X_4=199 \\ & Y_{\min }=134.2790 \mathrm{ppm}\end{aligned}$
The maximum amount of NOx released during the experimentation is 1268ppm. However intense regression analysis conducted reveals the NOx emissions can be drastically reduced by optimizing the operating parameters of the engine variables. The Analysis results based on single variable and Orthogonal quadratic regression analysis reveals that among the operating parameters such as single and pulse injections, load, injection pressures ranging from low to high pressures, EGR flow rates, for controlling the NOx the effective operating variable is fuel injection pressure and EGR percentage. According to the analysis of test results that the optimal combination is 10%SI (205bar) and 10%MPFI (210bar). According to the test results the emissions NOx can be reduced to 134.27ppm.
The present research work is conducted on the test facilities sanctioned by Department of science and technology, Govt of India under the project, Technology systems development scheme (TSD) vide order no. (DST/TSG/AF/2011/125). The corresponding author Dr.Veera Venkata Satyanarayana Murthy Yeditha, Associate professor & Placement officer, Associate Dean Research & Consultancy, Marine Engg Dept, Indian Maritime University, Central University, Govt of India, Chennai, 600119 Tamilnadu, India, wishes to thank authorities of Indian Maritime University, for encouragement to publish the research findings.
|
ATDC |
After dead centre |
|
B.P. |
Brake power (kW) |
|
bsfc |
Brake specific consumption kg/kWhr |
|
CAD |
Crank angle in degrees |
|
CRDI |
Common rail direct injection |
|
EGR |
Exhaust Gas recirculation |
|
HSU |
Hartridge smoke units |
|
MPFI |
Multiple split injections |
|
PPM |
Parts per million |
|
SI |
Single Injection |
|
NOx |
Nitric oxide |
[1] Asad, U., Zheng, M. (2014). Exhaust gas recirculation for advanced diesel combustion cycles. Applied Energy, 123: 242-252. https://doi.org/10.1016/j.apenergy.2014.02.073
[2] Saleh, H.E. (2009). Effect of exhaust gas recirculation on diesel engine nitrogen oxide reduction operating with jojoba methyl ester. Renewable Energy, 34(10): 2178-2186. https://doi.org/10.1016/j.renene.2009.03.024
[3] Ishida, A., Nishimura, A., Uranishi, M., Kihara, R., Nakamura, A., Newman, P. (2001). The development of the ECOS-DDF natural gas engine for medium-duty trucks: exhaust emission reduction against base diesel engine. JSAE Review, 22(2): 237-243. https://doi.org/10.1016/S0389-4304(01)00089-3
[4] Hountalas, D.T., Mavropoulos, G.C., Binder, K.B. (2008). Effect of exhaust gas recirculation (EGR) temperature for various EGR rates on heavy duty di diesel engine performance and emissions. Energy, 33(2): 272-283. https://doi.org/10.1016/j.energy.2007.07.002
[5] Yu, B., Kum, S.M., Lee, C.E., Lee, S. (2013). Effects of exhaust gas recirculation on the thermal efficiency and combustion characteristics for premixed combustion system. Energy, 49: 375-383. https://doi.org/10.1016/j.energy.2012.10.057
[6] Feng, H.Q., Zheng, Z.Q., Yao, M.F., Cheng, G., Wang, M.Y., Wang, X. (2013). Effects of exhaust gas recirculation on low temperature combustion using wide distillation range diesel. Energy, 51: 291-296. https://doi.org/10.1016/j.energy.2012.12.023
[7] Verschaeren, R., Schaepdryver, W., Serruys, T., Bastiaen, M., Vervaeke, L., Verhelst, S. (2014). Experimental study of NOx reduction on a medium speed heavy duty diesel engine by the application of EGR (exhaust gas recirculation) and miller timing. Energy, 76: 614-621. https://doi.org/10.1016/j.energy.2014.08.059
[8] Fang, Q., Fang, J.H., Zhuang, J., Huang, Z. (2012). Influences of pilot injection and exhaust gas recirculation (EGR) on combustion and emissions in a HCCI-DI combustion engine. Applied Thermal Engineering, 48: 97-104. https://doi.org/10.1016/j.applthermaleng.2012.03.021
[9] Engelmayer, M., Wimmer, A., Taucher, G., Hirschl, G., Kammerdiener, T. (2015). Impact of very high injection pressure on soot emissions of medium speed large diesel engines. Journal of Engineering for Gas Turbines and Power, 137(10): 101509. https://doi.org/10.1115/1.4030096
[10] Dober, G., Tullis, S., Greeves, G., Milovanovic, N., Hardy, M., Zuelch, S. (2008). The impact of injection strategies on emissions reduction and power output of future diesel engines. SAE Technical Paper, 2008(01): 0941. https://doi.org/10.4271/2008-01-0941
[11] Lee, S., Kook, S., Choi, W., Bae, C., Kim, J. (2004). The combined effect of multi-hole injector with pilot injection and EGR in a HSDI diesel engine. International Combustion Engine Performance & Emissions Conference, pp. 1-10.
[12] Mehrotra, A., Juttu, S., Ravishankar, S.S., Rambhaji, G. P., Suryawanshi, J.G. (2014). Simultaneous reduction of NOx and PM emissions through low temperature EGR cooling in diesel engines. SAE Technical Paper, 2014(01): 2803. https://doi.org/10.4271/2014-01-2803
[13] Brijesh, P., Chowdhury, A., Sreedhara, S. (2013). Effect of ultra-cooled EGR and retarded injection timing on low temperature combustion in CI engines. SAE Technical Paper, 2013(01): 0321. https://doi.org/10.4271/2013-01-0321
[14] Cheng, X., Chen, L., Yan, F., Hong, G., Yin, Y., Liu, H. (2013). Investigations of split injection strategies for the improvement of combustion and soot emissions characteristics based on the two-color method in a heavy-duty diesel engine. SAE Technical Paper, 2013(01): 2523. https://doi.org/10.4271/2013-01-2523
[15] Sarangi, A.K., Garner, C.P., McTaggart-Cowan, G.P., Davy, M.H., Wahab, E., Peckham, M. (2013). The effects of split injections on high exhaust gas recirculation low-temperature diesel engine combustion. International Journal of Engine Research, 14(1): 68-79. https://doi.org/10.1177/1468087412450987
[16] Yang, S.Y., Chung, S.H. (2013). An experimental study on the effects of high-pressure and multiple injection strategies on di diesel engine emission. SAE Technical Papers, 2013(01): 0045. https://doi.org/10.4271/2013-01-0045
[17] Yin, B., Wang, J., Yang, K., Jia, H. (2014). Optimization of EGR and split injection strategy for light vehicle diesel low temperature combustion. International Journal of Automotive Technology, 15: 1043-1051. https://doi.org/10.1007/s12239-014-0108-5
[18] Wang, D., Zhang, C., Wang, Y. (2007). A numerical study of multiple fuel injection strategies for NOx reduction from di diesel engines. International Journal of Green Energy, 4(4): 453-470. https://doi.org/10.1080/15435070701465912
[19] Roy, S., Das, A.K., Banerjee, R. (2022). Grey-fuzzy taguchi approach for multi-objective optimization of performance and emission parameters of a single cylinder crdi engine coupled with EGR. International Journal of Automotive Technology, 17(1): 1-12. https://doi.org/10.1007/s12239-016-0001-5
[20] Lizhou, C. (1985). Machine optimal design method. Bejing: Metallurgical Industry Press.
[21] Shisong, M. (1986). Regression analysis and test design. Shanghai: Huangdong Normal University Press.
[22] Bao, Y.D., He, Y. (2006). Study on noise of rapeseed oil blends in a single-cylinder diesel engine. Renewable Energy, 31(11): 1789-1798. https://doi.org/10.1016/j.renene.2005.09.012
[23] Cao, L.H., Si, H.Y., Li, P., Li, Y. (2017). Labyrinth seal design optimization based on quadratic regression orthogonal experiment. Energy and Power Engineering, 9(4): 204-215. https://doi.org/10.4236/epe.2017.94B025
[24] Wakode, V.R., Kanase-Patil, A.B. (2017). Regression analysis and optimization of diesel engine performance for change in fuel injection pressure and compression ratio. Applied Thermal Engineering, 113: 322-333. https://doi.org/10.1016/j.applthermaleng.2016.10.178