Khalil Benmouiza![]()
© 2023 IIETA. This article is published by IIETA and is licensed under the CC BY 4.0 license (http://creativecommons.org/licenses/by/4.0/).
OPEN ACCESS
Algeria is a large and sunny country, offering significant opportunities for solar energy development. To effectively harness solar energy, it is crucial to understand the distribution of solar radiation. In this study, we employ the Kriging method to analyze the data on sunshine duration from 56 meteorological stations across Algeria between 1992 and 2002. By utilizing Kriging, we interpolate the available data to create solar zoning maps, which enable us to categorize Algeria into regions with similar energy qualities. These maps provide valuable insights into the spatial and temporal distribution of solar energy resources throughout the country. The utilization of the Kriging method for interpolation enhances our ability to assess the solar potential of different regions in Algeria, facilitating better planning and utilization of solar energy resources. The results from this study have significant implications for the development and implementation of solar energy projects in Algeria, as they provide crucial information for evaluating the feasibility and viability of such initiatives.
sunshine duration, kriging interpolation, geospatial mapping, solar radiation maps, Algeria
Solar energy is employed in photovoltaic systems for electricity generation or thermal systems (solar water heaters) for hot water production. It is a growing industry, especially in the housing sector. This energy is unlimited and abundant [1]. It's ideal for decentralized manufacturing since it doesn't need a significant distribution infrastructure. Its fluctuation in distance and time depends on astronomical and climatic conditions.
The solar field is a data set that illustrates the variations in solar radiation across time and space. All future studies of solar energy will build upon this foundational study. It's a simulation tool for determining how large a solar array should be and how best to arrange its panels to maximize energy production. Solar energy potential at a particular location is an essential metric for designers of systems that convert solar energy into electricity (photovoltaic modules) or provide hot water (plane concentration collectors) [2].
On the national territory, meteorological stations gather various meteorological data and a limited amount of radiometric data. To do this, it is required to use models designed to predict the principal components of solar energy impacting the ground. The reconstitution of solar radiation on the ground provides solar energy system designers with accurate, exact, and simply usable sun irradiation data sequences for the sizing and installation of solar energy systems on any territory. In addition, insolation statistics are crucial for both the design and development of these systems as well as the assessment of their performance.
There are two sources of information for determining the quantity of solar radiation: measurements of radiation at meteorological and radiometric stations and theoretical estimates. Although the first approach is the most direct and precise, it is not always feasible due to factors such as the low density of meteorological stations and their often large physical distance from one another across countries. The alternative technique employs models for radiation estimation based on a set of input factors. Several research papers have been done to construct estimation models, ranging from semi empirical models [3, 4] to artificial intelligence [5, 6] models.
Algeria possesses significant solar potential with a substantial solar deposit, experiencing over 2500 hours of sunlight annually across most of its region [7]. Despite favorable geographical, climatic, and meteorological characteristics, the utilization of solar energy has yet to make significant progress and this market is essentially virgin. For a nation like Algeria, it's important to quantify the potential of this form of energy so we can determine the most effective ways to use it in our energy strategy.
In Algeria, only the meteorological stations of Bouzareah, Ghardaia, Oran and Tamanrasset give solar radiation measurements. Moreover, their distribution is not enough to cover all the Algerian territory [8].
Hence, we propose in this paper, a complete study of the sunshine fraction distribution over Algeria based on the analysis of 56 meteorological stations data from 1992 to 2002 that monitor the sunlight hours on a regular basis. The main objective is to categorize the territory into zones which help to determine the number of sunshine hours and solar irradiation amount at any location even if the meteorological stations is no installed. In addition, using kriging interpolation method, which can be used in the field of solar irradiation to estimate solar radiation quantities at unmeasured places.
Kriging contributes to the creation of a smooth and continuous surface of solar irradiance by taking into account the spatial correlation of solar radiation data. This data is useful for evaluating possible solar energy resources, optimizing solar panel location, and constructing energy-efficient solar power systems as well as constructing solar zoning maps.
Our objective is to develop solar zoning map, which will provide a graphical representation of the similar zones for better understanding of the same solar regions over Algeria.
The remainder of the paper is structured as follows: Section 2 will show us where exactly in Algeria all the radiometers are located. In Section 3, we'll look at how the Kriging method is used in the making of zoning maps. Discussion on final thoughts follows.
The average annual sunlight hours in Algeria are 2600 hours per year in the North and 3500 hours per year in the South [9]. However, there are only 54 weather stations in Algeria, compared to the country's total land area of more than 2 million square kilometers (more than 2 million m2).
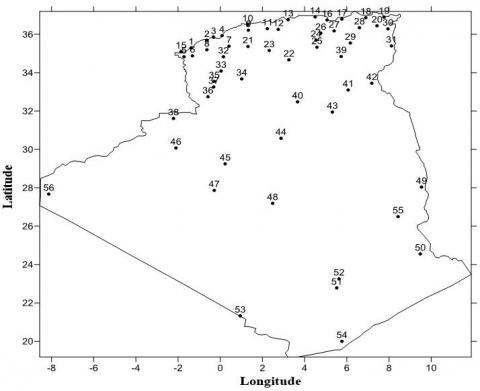
The location of these meteorological stations on the Algerian map is shown in Figure 1. Clearly, the north and the high plateaus have the majority of stations (36 stations). However, there are 18 of them in the southern part of the country (the Sahara area). Since the density of this network is low, we concluded that it does not provide much information regarding Algeria's solar radiation. The distribution of these station is given in Table 1.
2.1 Solar radiation data over Algeria
This research utilizes data obtained from the National Meteorological Office of Algeria for 56 meteorological stations that regularly monitor sunlight hours on a regular basis. However, only a small number of these stations capture hourly data on direct, diffuse, and global solar radiation. These stations are located in the cities of; Bouzareah, Ghardaia, Oran and Tamanrasset.
However, as shown in Figure 2, these databases contain many missing data owing to the lack of measurements. As a result, we've only included data from 1992 to 2002 in order to eliminate any data gaps.
2.2 Analysis of the sunshine fraction
According to Angstrom's equation [10], the study of the sunshine fraction is a key step in determining the quantity of solar radiation as expressed in Eq. (1). The use of this model is because it gives good results and it is simple to implement [11, 12].
$\bar{G}=\overline{G_0}\left(a+b \frac{\bar{S}}{\overline{S_0}}\right)$ (1)
where, $\bar{G}$ is the average global solar irradiation, $\overline{G_0}$ is the extraterrestrial average global solar irradiation, $a$ and $b$ are the correlation coefficients, $\overline{S_0}$ is the daylength and $\bar{S}$ is the measured mean monthly sunshine, is calculated using Eq. (2).
$\bar{S}=\frac{1}{N} \sum_{\text {year }=1}^{N y} S($ month, day, location $)$ (2)
where, $N y$ is equals to the used data period, which is 10 years (from 1992 to 2002). The mean monthly sunshine hours over the used meteorological stations are given in Table 1.
We begin by plotting the average monthly sunshine based on the data expressed in Table 2. Then daylength S0 is plotted. After that, we determine the sunshine fraction using Eq. (3).
$\sigma=\frac{\bar{s}}{\overline{S_0}}$ (3)
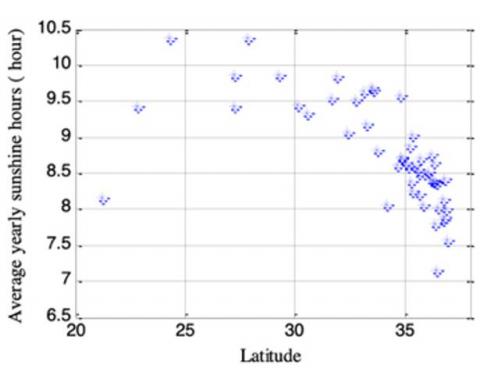
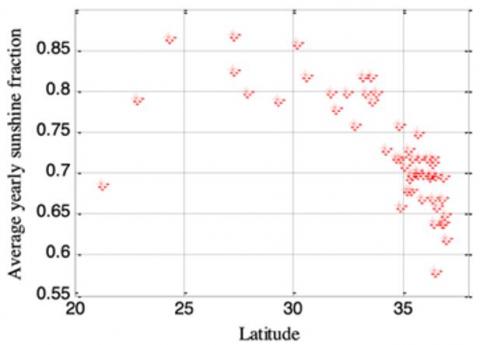
Figures 3 and 4 show the results of the simulations for the average amount of sunshine each year.
Figure 1. Meteorological stations over Algeria
Figure 2. Algeria's meteorological network missing data
Figure 3. Annual average sunshine hours and sunshine fraction for all National Meteorological Office (NMO) stations
Figure 4. Annual average sunshine hours and sunshine fraction for all National Meteorological Office (NMO) latitudes
Table 1. Algerian radiometric station distribution
|
Nº |
Station |
Longitude (º) |
Latitude (º) |
Nº |
Station |
Longitude (º) |
Latitude (º) |
|
1 2 3 4 5 6 7 8 9 10 11 12 13 14 15 16 17 18 19 20 21 22 23 24 25 26 27 28 |
Beni Saf Oran Arzew Mostaganem Maghnia Tlemcen Mascara S.Belabbes Chleff Tenes Miliana Médéa Alger Tizi Ouzou Ghazaouet Bejaïa Jijel Skikda Annaba Guelma Tiaret Djelfa KsarChelala M’sila Boussaâda Bordj Setif Constantine |
1.33 W 0.60 W 0.26 W 0.12 E 1.78 W 1.45 W 0.30 E 0.65 W 1.33 E 1.33 E 2.23 E 2.75 E 3.25 E 4.50 E 1.86 W 5.05 E 5.57 E 6.90 E 7.81 E 7.46 E 1.46 E 3.25 E 2.32 E 4.50 E 4.20 E 4.66 E 5.25 E 6.61 E |
35.25 35.63 35.81 35.88 34.81 35.01 35.60 35.18 36.21 36.50 36.30 36.45 36.71 36.91 35.10 36.75 36.80 36.88 36.83 36.46 35.35 34.68 35.16 35.66 35.33 36.06 36.18 36.28 |
29 30 31 32 33 34 35 36 37 38 39 40 41 42 43 44 45 46 47 48 49 50 51 52 53 54 55 56 |
Batna Souk-Ahras Tebessa Saida Elkheiter El Bayed Mecheria Ainessefra Naama Bechar Biskra Ghardaia Touggourt El Oued Ouargla El Golea Timimoun Béni Abbas Adrar Ain Salah Ain Amenas Janet Tamanrasset Assekrem B.BajiMokhtar Ain Guezzam Illizi Tindouf |
6.35 E 7.97 E 8.11 E 0.15 E 0.04 E 1.00 E 0.26 W 0.60 W 0.30 W 2.25 W 5.73 E 3.80 E 6.13 E 6.78 E 5.40 E 2.86 E 0.28 E 2.16 W 0.18 W 2.47 E 9.63 E 9.47 E 5.45 E 5.63 E 0.57 E 5.77 E 8.43 E 8.16 W |
35.71 36.28 35.41 34.86 34.09 33.73 33.55 32.75 33.26 31.63 34.80 32.40 33.11 33.50 31.91 30.56 29.25 30.13 27.81 27.20 28.05 24.26 22.80 23.26 21.20 19.56 26.50 27.70 |
Table 2. Mean monthly measured sunshine hours for 56 stations over Algeria
|
|
Months |
|||||||||||
|
Stations |
Jan. |
Feb. |
Mar. |
Apr. |
May. |
Jun. |
Jul. |
Aug. |
Sep. |
Oct. |
Nov. |
Dec. |
|
Beni Saf |
6.47 |
7.63 |
7.99 |
9.4 |
9.36 |
9.91 |
10.23 |
9.52 |
8.6 |
7.39 |
6.62 |
6.09 |
|
Oran |
6.22 |
7.46 |
8 |
9.4 |
9.7 |
10.67 |
10.86 |
10.06 |
8.87 |
7.38 |
6.47 |
5.88 |
|
Arzew |
6 |
7.21 |
7.74 |
8.93 |
8.8 |
8.4 |
9.46 |
9.22 |
8.33 |
7.19 |
6.17 |
5.67 |
|
Mostaganem |
6.08 |
7.6 |
8.38 |
9.4 |
9.67 |
10.71 |
10.83 |
9.84 |
8.81 |
7.31 |
6.24 |
5.89 |
|
Maghnia |
6.82 |
7.76 |
7.89 |
9.47 |
9.87 |
10.75 |
11.16 |
10.21 |
9.09 |
7.67 |
7.01 |
6.28 |
|
Tlemcen |
6.53 |
7.45 |
7.7 |
9.29 |
9.61 |
10.6 |
10.98 |
9.98 |
8.87 |
7.51 |
6.7 |
6.12 |
|
Mascara |
6.1 |
7.2 |
7.57 |
8.94 |
9.55 |
10.67 |
10.97 |
9.97 |
8.81 |
7.41 |
6.28 |
5.85 |
|
S-Bel abbes |
6.36 |
7.81 |
8.02 |
9.44 |
9.94 |
11.32 |
11.6 |
10.34 |
9.14 |
7.7 |
6.75 |
6.22 |
|
Chlef |
5.75 |
6.91 |
7.75 |
9.13 |
9.93 |
11.1 |
11.53 |
10.33 |
9.18 |
7.58 |
6 |
5.2 |
|
Ténès |
5.3 |
6.71 |
8.01 |
8.96 |
9.32 |
10.18 |
10.85 |
9.97 |
8.88 |
7.26 |
5.38 |
4.53 |
|
Méliana |
5.51 |
6.81 |
7.67 |
8.65 |
9.6 |
10.91 |
11.41 |
10.48 |
8.85 |
7.4 |
5.79 |
4.97 |
|
Médéa |
5.14 |
6.7 |
7.5 |
8.44 |
9.45 |
10.8 |
11.45 |
10.45 |
8.84 |
7.26 |
5.44 |
4.61 |
|
Alger |
5.66 |
7 |
7.65 |
8.5 |
9.06 |
10.34 |
10.95 |
9.93 |
8.6 |
7.2 |
5.81 |
5.17 |
|
Bejaïa |
5.18 |
6.3 |
7.11 |
8.02 |
8.86 |
9.9 |
10.83 |
9.93 |
7.78 |
6.73 |
5.46 |
4.92 |
|
Jijel |
4.42 |
4.36 |
5.47 |
6.15 |
7.36 |
8.75 |
9.05 |
8.49 |
5.91 |
4.97 |
3.8 |
4.19 |
|
Skikda |
5.05 |
6.37 |
7.34 |
8.2 |
9.27 |
10.29 |
11.24 |
10.06 |
8.13 |
6.97 |
5.3 |
4.51 |
|
Annaba |
5.47 |
6.23 |
7.27 |
8.16 |
9.38 |
10.38 |
11.5 |
10.52 |
8.18 |
7.11 |
5.33 |
4.83 |
|
Guelma |
5.34 |
6.22 |
7.11 |
7.96 |
9.21 |
10.07 |
11.44 |
10.19 |
8.2 |
7.14 |
5.51 |
4.96 |
|
Tiaret |
5.69 |
7.2 |
7.7 |
8.74 |
9.57 |
10.72 |
11.08 |
9.84 |
8.99 |
7.74 |
5.98 |
5.46 |
|
Djelfa |
5.86 |
7.58 |
8.08 |
9.14 |
9.88 |
10.61 |
10.97 |
9.68 |
8.86 |
8.11 |
6.56 |
6.21 |
|
M’sila |
6.35 |
8.18 |
8.56 |
9.32 |
10.07 |
10.82 |
11.24 |
10.14 |
8.92 |
8.36 |
6.71 |
5.91 |
|
Boussaada |
6.14 |
7.53 |
8.23 |
9.09 |
9.59 |
10.11 |
10.73 |
9.67 |
8.44 |
7.94 |
6.61 |
6.23 |
|
B.B.Arreridj |
5.97 |
7.41 |
7.96 |
9.01 |
9.72 |
10.88 |
11.27 |
10.06 |
8.7 |
7.76 |
6.37 |
5.92 |
|
Sétif |
6.19 |
7.7 |
8.1 |
9.05 |
9.81 |
10.97 |
11.42 |
10.24 |
8.88 |
7.8 |
5.85 |
5.29 |
|
Constantine |
5.24 |
6.53 |
7.3 |
8.25 |
9.38 |
10.58 |
11.32 |
9.72 |
8.3 |
7.26 |
5.6 |
5.19 |
|
Batna |
5.55 |
7.06 |
7.75 |
8.73 |
9.53 |
10.4 |
11.37 |
10.21 |
8.7 |
7.85 |
6.23 |
5.66 |
|
Souk Ahras |
4.94 |
5.87 |
6.89 |
7.82 |
8.95 |
9.92 |
11.05 |
10 |
7.93 |
6.92 |
5.18 |
4.82 |
|
Tebessa |
5.51 |
6.68 |
7.56 |
8.4 |
9.42 |
10.18 |
11.31 |
10.01 |
8.3 |
7.49 |
6.12 |
5.5 |
|
Saida |
6.22 |
7.6 |
7.79 |
9.05 |
9.64 |
10.85 |
11.08 |
9.74 |
9.01 |
7.85 |
6.54 |
6.07 |
|
El-Bayad |
5.92 |
7.3 |
7.96 |
9.19 |
9.89 |
10.62 |
10.73 |
9.52 |
9.3 |
8.11 |
6.1 |
5.94 |
|
Mecheria |
6.71 |
8.02 |
7.94 |
9.24 |
9.51 |
10.05 |
9.64 |
8.53 |
8.8 |
7.93 |
7.3 |
6.73 |
|
Ain Sefra |
7.22 |
8.65 |
8.53 |
9.95 |
10.42 |
10.44 |
10.62 |
9.45 |
9.48 |
8.89 |
7.89 |
7.4 |
|
Naama |
6.7 |
8.01 |
7.9 |
9.43 |
9.75 |
10.15 |
9.86 |
8.86 |
9.05 |
8.21 |
7.35 |
6.79 |
|
Bechar |
8.1 |
9.01 |
9.18 |
10.65 |
11.04 |
11.37 |
11.06 |
9.89 |
9.61 |
8.94 |
8.69 |
8.06 |
|
Biskra |
7.27 |
8.68 |
9 |
10 |
10.58 |
11.42 |
11.64 |
10.71 |
9.07 |
8.65 |
7.44 |
7.4 |
|
Ghardaia |
7.84 |
8.96 |
8.88 |
10.13 |
10.44 |
11.25 |
11.3 |
10.18 |
9.01 |
8.59 |
7.91 |
7.81 |
|
Touggourt |
7.82 |
9 |
9 |
9.9 |
10.26 |
11.37 |
11.48 |
10.71 |
8.99 |
8.65 |
7.86 |
7.81 |
|
El Oued |
7.65 |
8.79 |
9.13 |
9.84 |
10.17 |
11.12 |
11.41 |
10.82 |
8.96 |
8.5 |
7.68 |
7.6 |
|
Ouargla |
7.73 |
8.62 |
8.95 |
9.67 |
9.6 |
10.79 |
11.06 |
10.34 |
8.24 |
8.39 |
7.44 |
6.56 |
|
El-Golea |
8.42 |
9.21 |
9.25 |
10.1 |
10.29 |
10.78 |
11.19 |
10.39 |
8.72 |
9.1 |
8.5 |
8.45 |
|
Timimoun |
8.57 |
9.01 |
9.03 |
9.63 |
10.4 |
10.95 |
10.79 |
10.07 |
8.44 |
8.91 |
8.52 |
8.51 |
|
Béni Abbes |
8.44 |
9.08 |
9.49 |
10.71 |
11.06 |
11.35 |
10.93 |
10.07 |
9.32 |
9 |
8.85 |
8.63 |
|
Adrar |
8.97 |
9.3 |
9.4 |
9.92 |
10.35 |
10.65 |
10.15 |
9.08 |
8.4 |
9.08 |
8.77 |
8.66 |
|
In Salah |
8.95 |
9.24 |
9.1 |
9.43 |
9.73 |
10.64 |
11.04 |
10.27 |
8.39 |
9.13 |
8.84 |
8.71 |
|
In Amenas |
8.53 |
9.18 |
9.02 |
9.02 |
9.23 |
10.27 |
11.75 |
11.17 |
9.41 |
9.23 |
8.65 |
7.69 |
|
Djanet |
9.27 |
9.93 |
9.47 |
9.53 |
9.73 |
10.71 |
11.83 |
11.16 |
10.13 |
9.74 |
9.47 |
8.9 |
|
Tamanrasset |
9.3 |
10.13 |
9.48 |
10.01 |
9.53 |
8.84 |
10.07 |
8.9 |
8.09 |
9.04 |
9.52 |
8.9 |
|
BB Mokhtar |
8.61 |
9.33 |
8.64 |
8.58 |
8.18 |
6.13 |
4.89 |
4.83 |
5.41 |
8.39 |
8.56 |
8.13 |
|
Tindouf |
8.54 |
9.54 |
9.61 |
10.75 |
11.45 |
10.59 |
10.17 |
9.43 |
9.91 |
9.53 |
8.45 |
7.92 |
These findings provide us with a preliminary estimate of the solar radiation received in different regions of Algeria. Based on the curves, we can identify three distinct categories of sunshine fractions based on these curves:
· The first group consists of stations 1 to 35, located on Northen Algeria, including coastal areas and mountains from the east to the west of the country. In the coast, the weather changes a lot from year to year, but in the highlands, it changes even less. In these places, there are two different seasons (winter and summer). With a sunshine fraction between 0.5 and 0.8, which is high in the summer and low in the winter.
· In the second group, the station numbers range from 35 to 49. situated in Northen and central parts of the Sahara, where the amount of sunshine is higher than in the north and can be more than 0.9, and where the curves are less wavy. We can also see that the seasons have no effect on these areas.
· Stations 50 to 54 belong to the third group. located in the southern Sahara, where the amount of sunshine changes almost oppositely to the length of the astronomical day. In the summer, its values are between 0.5 and 0.6, while during the winter, they range between 0.6 and 0.8.
Our main objective is to obtain solar radiation statistics for each location in Algeria However, obtaining complete data sets at every desired location due to practical restrictions. As a result, interpolation is critical to the visualization and interpretation of 2D data. New data points are created using interpolation, which is a technique for creating new data points within a given collection of data points. Linear and nonlinear interpolation techniques as well as more complex approaches such as principal analysis components and kriging have been proposed in the literature. In what follows, kriging interpolation method is used to categories the zoning maps for Algeria and distinguish similar zones with the same energetic properties.
3.1 Ordinary kriging method
Geostatisticians utilize the standard Kriging approach [13] to estimate the values of an invisible random field by analyzing surrounding data. Delhomme [14] provides an in-depth explanation of kriging and its applications. Linear kriging can be classified as either basic (mean is known), ordinary (mean is unknown but remains constant), or universal, depending on how the mean value is stated (mean is an unknown linear combination of known functions). Regular kriging is the best linear unbiased estimator, and as such is the primary emphasis of this study. Linearity in the data allows for fairness in the estimates provided by ordinary kriging, which is why the approach strives to maintain a mean residual of zero.
The goal of the ordinary kriging technique is to provide an approximation for the missing data by utilizing the existing data The use of ordinary Kriging in solar zoning maps was justified due to the spatial correlation of solar irradiance, enabling accurate estimation of values at unsampled locations. Its unbiased estimation minimized errors and ensured reliable solar energy resource assessment. The method's flexibility with uneven data distribution and ability to incorporate elevation effects further enhanced the accuracy of the zoning maps [8].
The summary of the ordinary Kriging method is given as follows,
Let the data be sampled at N locations (x1, ..., xN), and the corresponding values be (v1, ..., vN). The value $\hat{v}_j$ at an unknown location
is estimated as a weighted linear combination of sampled values, given by:$\widetilde{v}_j=\sum_{i=1}^N w_i v_i$ (4)
Here, $\tilde{v}_j$ is the estimate, and let $\tilde{v}_j$ be the actual value (unknown) at $\hat{x}_j$. To find the weights, the values $v_j$ and $\tilde{v}_j$) are assumed to be stationary random functions:
$E\left[v_i\right]=E\left[\hat{v}_i\right]=E(v)$ (5)
Optimal weights $w_i$ are calculated assuming that the estimation is unbiased. The condition needed for unbiased estimator is:
$\sum_{i=1}^N w_i=1$ (6)
Let the residue be rj:
$r_j=\widetilde{v}_j-\hat{v}_j$ (7)
Therefore, the residual variance is given by:
$\operatorname{Var}\left(r_j\right)=\operatorname{Cov}\left\{\tilde{v}_j \tilde{v}_j\right\}-2 \operatorname{Cov}\left\{\tilde{v}_j \hat{v}_j\right\}+\operatorname{COV}\left\{\hat{v}_j \hat{v}_j\right\}$ (8)
The first term can further be simplified as follows:
$\begin{gathered}\operatorname{Cov}\left\{\tilde{v}_j \tilde{v}_j\right\}=\operatorname{Var}\left(\tilde{v}_j\right)=\operatorname{Var}\left\{\sum_{i=1}^N w_i v_i\right\} \\ =\sum_{i=1}^N \sum_{k=1}^N w_i w_k \operatorname{Cov}\left\{v_i v_k\right\}=\sum_{i=1}^N \sum_{k=1}^N w_i w_k \hat{C}_{i k}\end{gathered}$ (9)
The second term can be written as:
$\operatorname{Cov}\left\{\tilde{v}_j \hat{v}_j\right\}=\operatorname{Cov}\left\{\left(\sum_{i=1}^N w_i v_i\right) \hat{v}_j\right\}=\sum_{i=1}^N w_i \operatorname{Cov}\left\{v_i \hat{v}_j\right\}=\sum_{i=1}^N w_i \hat{C}_{i 0}$ (10)
Finally, the third term can be expressed as:
$\operatorname{Cov}\left\{\hat{v}_j \hat{v}_j\right\}=\hat{C}_{00}$ (11)
Substituting from Eqns. (9)-(11) in Eq. (8),
$\operatorname{Var}\left(r_j\right)=\sum_{i=1}^N \sum_{k=1}^N w_i w_k \hat{C}_{i k}-2 \sum_{i=1}^N w_i \hat{C}_{i 0}+\hat{C}_{00}$ (12)
For ordinary Kriging, it is required to find w by minimizing Var (rj) with respect to w subject to the constraint Eq. (12). This can be written as the minimization of the penalized cost function,
$J(w)=\sum_{i=1}^N \sum_{k=1}^N w_i w_k \hat{C}_{i k}-2 \sum_{i=1}^N w_i \hat{C}_{i 0}+\hat{C}_{00}+2 \lambda\left(\sum_{i=1}^N w_i-1\right)$ (13)
Taking derivatives of J with respect to w and λ,
$\frac{\partial J}{\partial w_i}=\sum_{k=1}^N w_k \hat{C}_{i k}-2 \hat{C}_{i 0}+2 \lambda$ (14)
$\frac{\partial J}{\partial \lambda}=2\left(\sum_{i=1}^N w_i-1\right)$ (15)
2λ is the Lagrange multiplier. setting this to zero, we get the following system to solve, to obtain the weights w and λ.
$\left(\begin{array}{cccc}\hat{C}_{11} & \cdots & \hat{C}_{1 N} & 1 \\ \vdots & \ddots & \vdots & \vdots \\ \hat{C}_{N 1} & \cdots & \hat{C}_{N N} & 1 \\ 1 & \cdots & 1 & 0\end{array}\right)\left(\begin{array}{c}w_1 \\ \vdots \\ w_N \\ \lambda\end{array}\right)=\left(\begin{array}{c}\hat{C}_{10} \\ \vdots \\ \hat{C}_{N 0} \\ 1\end{array}\right)$ (16)
Substituting Eq. (16) into Eq. (12), we can derive the Kriging variance,
$\operatorname{Var}\left(r_j\right)=\hat{C}_{00}-\sum_{i=1}^N w_i \hat{C}_{i 0}-\lambda$ (17)
Eq. (16) needs to be solved at each unknown location $\hat{x}_j$.
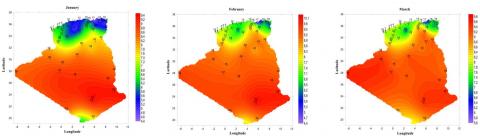
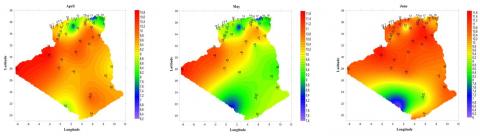
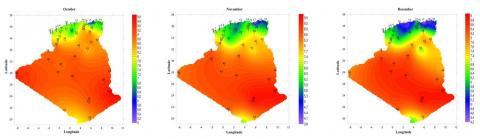
Figure 5. Sunshine zoning maps for 12 months for Algeria using ordinary Kriging method
The amount of covariance depends on the Euclidean distance between spatial points. The correlation length L has different values, which mean we are dealing with a global pseudo Euclidean distance. The used function can be expressed as,
$\hat{C}_{i j}=\sigma^{\prime \prime 2}\left(1+\frac{\left\|x_i-x_j\right\|}{L}\right) \exp \left(-\frac{\left\|x_i-x_j\right\|}{L}\right)$ (18)
where, σ’’ is the standard deviation, and there is an assumption that all the random variables have the same standard deviation. The value of σ’’ does not have an effect on the weights w and the interpolation result, but it does have a direct effect on the Kriging variance, i.e., the uncertainty of the interpolation result.
Figure 5 shows the average amount of sunshine in Algeria for each month of the year, based on the results of the simulation. The database for the simulation is the number of hours of sunshine at all 56 stations from 1992 to 2002. The maps are made with Surfer software.
According to colors distinction obtained from the solar zoning maps, we can tell that Algeria is made up of six energetic zones:
- Zone 1 includes the coast and the high plateaus in the east (stations 16, 17, 18, 19, 20, 27, 28, 29, 30, 31). It has a low amount of sunshine, and the amount of sunshine doesn't change much during the year.
- Zone 2 has the central coastal areas (stations 9, 10, 11, 12, 13, 14, 24, 26). It has a small amount of sunshine, but it's a little higher than zone 1, and it's spread out in a very different way throughout the year. The sun gives off more energy in the summer than in the winter.
- Zone 3: It has the coast, the high plateaus in the west, and the central parts of the interior (stations 1, 2, 3, 4, 5, 6, 7, 8, 15, 21, 22, 23, 25, 32). Compared to zones 1 and 2, it has a lot of sunshine, but it's spread out in different ways at different times of the year.
- Zone 4 includes the northern part of the Sahara (stations 33, 34, 35, 36, 37, 38, 39, 40, 41, 42). It has a high percentage of sunny days, with only a small difference between the summer and winter months.
- Zone 5: It's the middle of the Sahara (stations 43, 44, 45, 46, 47, 48, 49, 50, 55, 56). Compared to other zones, it has the most amount of sunshine. It is given out the same way every day of the year.
- Zone 6: It includes the southern part of the Sahara (Hoggar and Tassili, Station Numbers: 51, 52, 53, 54). The seasons don't have the effect they used to. Compared to the summer months, there is a lot of sunshine in the winter.
The main purpose of this study was to address the challenge of limited solar irradiation data and uneven distribution of meteorological weather stations in Algeria. To overcome this limitation, we proposed the development of Solar Zoning Maps of Algeria based on Sunshine Duration Data and the utilization of the Kriging method. By employing ordinary Kriging interpolation, we were able to construct zoning maps and identify zones with similar data characteristics.
The results of our study provide quantitative insights into the sunshine hour ranges for each zone in Algeria. Zone 1, Zone 2, and Zone 3 experience sunshine hours ranging from 5.5 to 6.8 hours during the winter season, while the summer season ranges between 9 to 10.4 hours of sunshine per day. For Zone 4 and Zone 5, the winter season exhibits sunshine hours between 8.1 to 9 hours, and the summer season ranges from 10 to 12 hours of sunshine per day. Zone 6 experiences winter sunshine hours between 7.5 to 9 hours and summer sunshine hours ranging from 5 to 7 hours per day.
These findings provide valuable quantitative insights into the variation of sunshine hours across different zones in Algeria, allowing for a better understanding of the solar energy potential in each region. The Solar Zoning Maps offer a robust framework for solar energy planning and resource assessment in the country, enabling the estimation and prediction of solar energy availability throughout different seasons.
Limitations include the need for more accurate data and wider coverage, as well as the computational complexity of the Kriging method. Exploring artificial intelligence methods can enhance efficiency. Future studies should consider additional variables and refine the methodology for a comprehensive assessment of solar potential in Algeria. The zoning maps provide insights into sunshine variations in Algeria, aiding PV system installation and resource allocation. They serve as a foundation for further research, enhancing understanding of solar potential. Stakeholders can make informed decisions and advance renewable energy development using these maps.
[1] Letcher, T., Fthenakis, V.M. (Eds.). (2018). A Comprehensive Guide to Solar Energy Systems: With Special Focus on Photovoltaic Systems. Academic Press.
[2] Kabir, E., Kumar, P., Kumar, S., Adelodun, A.A., Kim, K.H. (2018). Solar energy: Potential and future prospects. Renewable and Sustainable Energy Reviews, 82: 894-900. https://doi.org/10.1016/j.rser.2017.09.094
[3] Hassan, M.A., Khalil, A., Kaseb, S., Kassem, M.A. (2018). Independent models for estimation of daily global solar radiation: A review and a case study. Renewable and Sustainable Energy Reviews, 82: 1565-1575. https://doi.org/10.1016/j.rser.2017.07.002
[4] Antonanzas-Torres, F., Urraca, R., Polo, J., Perpiñán-Lamigueiro, O., Escobar, R. (2019). Clear sky solar irradiance models: A review of seventy models. Renewable and Sustainable Energy Reviews, 107: 374-387. https://doi.org/10.1016/j.rser.2019.02.032
[5] Paul, B., Paul, H. (2022). Solar radiation prediction using artificial neural network: A comprehensive review. Computational Intelligence in Data Mining: Proceedings of ICCIDM 2021, pp. 509-521. https://doi.org/10.1007/978-981-16-9447-9_39
[6] Patel, D., Patel, S., Patel, P., Shah, M. (2022). Solar radiation and solar energy estimation using ANN and Fuzzy logic concept: A comprehensive and systematic study. Environmental Science and Pollution Research, 29(22): 32428-32442. https://doi.org/10.1007/s11356-022-19185-z
[7] Abdeladim, K., Razagui, A., Semaoui, S., Arab, A.H. (2020). Updating Algerian solar atlas using MEERA-2 data source. Energy Reports, 6(Sup. 1): 281-287. https://doi.org/10.1016/j.egyr.2019.08.057
[8] Benmouiza, K. (2015). Quantification of solar radiation in Algeria, application to the sizing of photovoltaic systems (Doctoral dissertation, Université de Tlemcen-Abou Bekr Belkaid, Algeria.
[9] Mefti, A., Bouroubi, M.Y., Khellaf, A.E. (1999). Analyse critique du modèle de l’atlas solaire de l’Algérie. Journal of Renewable Energies, 2(2): 69-85.
[10] Angstrom, A. (1924). Solar and terrestrial radiation. Report to the international commission for solar research on actinometric investigations of solar and atmospheric radiation. Quarterly Journal of the Royal Meteorological Society, 50(210): 121-126. https://doi.org/10.1002/qj.49705021008
[11] Gürel, A.E., Ağbulut, Ü., Bakır, H., Ergün, A., Yıldız, G. (2023). A state of art review on estimation of solar radiation with various models. Heliyon, 9(2): e13167. https://doi.org/10.1016/j.heliyon.2023.e13167
[12] Stefu, N., Paulescu, M., Blaga, R., Calinoiu, D., Pop, N., Boata, R., Paulescu, E. (2016). A theoretical framework for Ångström equation. Its virtues and liabilities in solar energy estimation. Energy Conversion and Management, 112: 236-245. https://doi.org/10.1016/j.enconman.2016.01.021
[13] Pokhrel, R.M., Kuwano, J., Tachibana, S. (2013). A kriging method of interpolation used to map liquefaction potential over alluvial ground. Engineering geology, 152(1): 26-37. https://doi.org/10.1016/j.enggeo.2012.10.003
[14] Delhomme, J.P. (1978). Kriging in the hydrosciences. Advances in Water Resources, 1(5): 251-266. https://doi.org/10.1016/0309-1708(78)90039-8