Zhi Li![]() | Lin Ruan*
| Lin Ruan*![]()
© 2023 IIETA. This article is published by IIETA and is licensed under the CC BY 4.0 license (http://creativecommons.org/licenses/by/4.0/).
OPEN ACCESS
The self-circulating evaporative cooling technology, by using latent heat, solves the bottleneck problem of high heat flux dissipation of the power electronic devices. In self-circulating system, the pressure drop of heat transfer fluid through each component needs to be minimized for the weak circulating power. Thus, the air-cooled condenser design must consider the pressure drop along the fluid flow. This paper presents the design flow and thermodynamic model of the air-cooled condenser, and the self-circulating test platform which features heat exchange capacity and pressure drop measurement. In view of the heat exchange capacity of 17 kW and the pressure drop limit below 500Pa, a new air-cooled condenser is constructed with design flow optimized parameters and verified through experiments. The results indicate that the pressure drop error between experimental and designed values was less than 16.6% for a heat dissipation rate over 17kW. After further discussion, it is concluded that a fluid-sided hydraulic diameter of 2.5-3mm provides an effective balance between heat exchange capacity and pressure drop. With the increase of air speed, the total heat transfer coefficient of the condenser increases dramatically while the fin spacing makes a greater increase in air pressure drop than in heat transfer coefficient.
thermodynamic model, low pressure drop, air-cooled condenser, design flow
New technologies are being developed to address the high heat flux density generated during the operation of power electronic devices. Several cooling methods, including forced air cooling [1], oil cooling, water cooling [2], and evaporative cooling, are employed to tackle this issue [3]. By using latent heat, the evaporative cooling technology [4] has the advantages of high heat exchange efficiency, good temperature stability and high insulation. Since the late 1950s, the self-circulating evaporative cooling technology was proposed by the Institute of Electrical Engineering of Chinese Academy of Sciences [5] innovatively for the stator winding of hydro-generators, for example, the 27, 28# units in the three gorges hydro-generator station. And then this technology expanded its application to ECRIS, LHAASO, electrical machines, data centers, IGBTs and so on.
Without external power equipment, the self-circulating evaporative cooling system relies on the density difference of heat transfer fluid (HTF) between downcomer and riser to provide power for the cycle [6]. And the HTF pressure drop through each components needs to be as small as possible for the weak circulating power. Thus, on the premise of ensuring the total heat transfer, the resistance of HTF flow through the condenser should be reduced as much as possible.
For optimal performance, the water-cooled condenser requires a continuous supply of feed water. Any interruption in the water supply may impede their effectiveness. Conversely, the air-cooled condenser (ACC) functions efficiently and does not require a constant water supply. Thus, the ACC is a more flexible option for use in areas with limited or unreliable water resources and worth further study [7, 8]. Typical ACC design concerns about the condensation performance in various geometry factors. Saechan and Wongwises [9] indicated that the optimal tube diameter and the number of fin per inch are 6.35–12.7 mm and 11–12, respectively. By comparing eight condensers with distinct geometric characteristics, Barbosa et al. [10] concluded semi-empirical correlations for j and f are proposed in terms of the air-side Reynolds number and the finning factor. Chen et al. [11] found that the thermo-flow performances of different condenser cells vary widely with each other for the horizontally arranged ACCs in the wind directions of 90° and 60°. In experiment, Başaran and Yurddaş [12] hold with the idea that the pass arrangements having one more microchannel flat tube in the pass with high vapor quality increase the heat transfer capacity by nearly 6%. Lin et al. [13] indicated that a reduction in fin spacing of the conventional smooth fins resulted in the largest improvement in cycle efficiency. Thus, the typical design neglects the pressure drop along HTF flow in ACC because it’s just a little resistance compared to the power provided by the pump/compressor.
However, the pressure drop along HTF flow should be considered primarily in the ACC design process of the self-circulating system. A certain engineering project proposed the control target that the minimum heat exchange capacity is 17 kW under a limited height, which leaves the maximum pressure drop in HTF side below 500Pa. And this paper carries on the low flow resistance design and the optimization for this ACC.
In this project, the designed power of condenser was 17kW. The air and HTF inlet temperatures were 40℃ and 55℃, respectively. The HTF is developed in the author’s laboratory. The requirement was a lightweight condenser with flow pressure drop below 500Pa. The design calculation flow diagram is shown in Figure 1.
Figure 1. The design calculation flow diagram
The condenser power, air and HTF inlet temperature were fixed. In order to obtain the flow pressure drop below 500Pa, the geometry of the heat exchanger core is adjusted. During the calculation process, the vapor quality and geometry needs to be changed according to the heat transfer characteristics and the flow resistance of the whole system until balance.
During the design process, a typical ACC geometric structure is presented in section 2.1 to provide an intuitive understanding. Then, the appropriate formulas for the thermal model are given for the HTF side, metal clapboard and air region in section 2.2, respectively. Contrastively, the hydraulic model, in section 2.3, only focuses on the pressure loss calculation in HTF flow process. Once the design was completed, the thermodynamic performance of the condenser could be simulated to analyze the effects of different parameters on heat transfer and flow pressure drop.
2.1 Geometric parameters
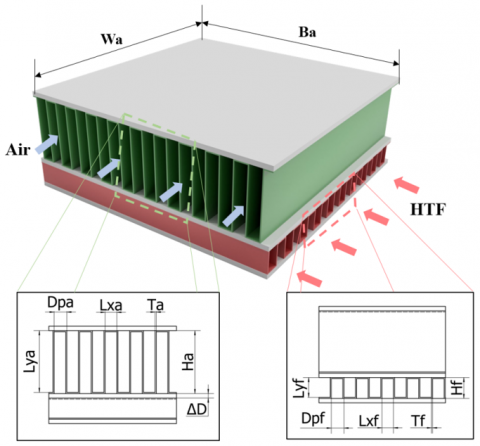
The heat transfer body of the air-cooled condenser is composed of the multi-layer HTF channels and the multi-layer air fin channels, which are alternately superposed. The local structure of the single-layer heat exchange is shown in Figure 2. The cool air is sucked into the fan fins (green areas), absorb energy, and become hot air. The hot two-phase HTF flows into the tube channels (red area) to release energy, in which the HTF changes into liquid phase and is subcooled.
Figure 2. The single-layer heat exchange
On the air side, Dpa is the fin spacing, m; Ta is the fin thickness, m; Lxa and Lya are the width and height in the channel, m; Ha is the total height, m. For the metal clapboard, ΔD is the thickness, m. On the HTF side, Dpf is the fin spacing, m; Tf is the fin thickness, m; Lxf and Lyf are the width and height in the channel, m; Hf is the total height, m. The geometric relationship of these parameters is written as
$\left\{\begin{array}{l}L_{x a}=D_{p a}-T_a, L_{y a}=H_a-T_a \\ L_{x f}=D_{p f}-T_f, L_{y f}=H_f-T_f\end{array}\right.$ (1)
2.2 Thermal model
The total heat transfer of air-cooled condenser is
$Q_{\text {total }}=\dot{m}_f\left(x \Delta h_{\mathrm{lg}}+c_p\left(T_{h, o}-T_{h, i}\right)\right)=\dot{m}_a c_{p a}\left(T_{c, o}-T_{c, i}\right)$ (2)
where, Qtotal is total heat transfer, W; $\dot{m}_f$ is HTF mass flow, kg/s; x is vapor quality; Δhlg is HTF latent heat, J/kg; cp is HTF specific heat, J/kg∙K; Th,o and Th,i are HTF outlet and inlet temperature, respectively, ℃; $\dot{m}_a$ is air mass flow, kg/s; cpa is air specific heat, J/kg∙K; Tc,o and Tc,i are air outlet and inlet temperature, respectively, ℃.
And the heat transfer between air and HTF is
$Q_{t o t a l}=h \cdot A \cdot \Delta T_{L M}$ (3)
where, h is equivalent convective heat transfer coefficient, W/m2K; ΔTLM is logarithmic mean temperature difference (LMTD), ℃; and A is the total effective heat transfer area, m2; which is determined by the geometry of the air side.
$A=n_a \cdot \frac{2 \cdot\left(L_{x a}+L_{y a}\right) \cdot W_a \cdot B_a}{D p_a}$ (4)
where, na is layers in air side; others are shown in section 2.1.
The LMTD in Eq. (3) can be calculated as
$\begin{aligned} & \Delta T_{l m}=\frac{\Delta T_I-\Delta T_{I I}}{\ln \left(\frac{\Delta T_I}{\Delta T_{I I}}\right)} \\ & \Delta T_I=T_{h, i}-T_{c, o}, \quad \Delta T_{I I}=T_{h, o}-T_{c, i}\end{aligned}$ (5)
where, the ΔTI and ΔTII are temporary temperature differences.
The equivalent convective heat transfer coefficient of the ACC in Eq. (3) is
$h=\frac{1}{\frac{1}{h_{E C F}}+\frac{\Delta D}{k_m}+\frac{1}{\eta \cdot \alpha^{\prime}}}$ (6)
where, ΔD is clapboard thickness, m; km is clapboard heat conductivity coefficient, W/m∙K; η is surface efficiency; α’ is air equivalent convective heat transfer coefficient, W/m2K; and hECF is overall heat transfer coefficient of HTF, W/m2K; which includes the condensing region and the supercooling region as
$h_{E C F}=\frac{Q_c}{Q_{\text {total }}} h_c+\frac{Q_{s c}}{Q_{\text {total }}} h_{s c}$ (7)
where, Qc is heat transfer of condensation, W; Qsc is heat transfer of supercooled region, W; hsc is convective heat transfer coefficient of supercooled region, W/m2K; and hc is convective heat transfer coefficient of condensation, W/m2K, which can be calculated as [14]
$\begin{aligned} & h_c=1.32 \cdot \operatorname{Re}_l^{-\frac{1}{3}} \cdot\left(\frac{\rho_l \cdot\left(\rho_l-\rho_g\right) \cdot g \cdot k_l^3}{\mu_l^2}\right)^{\frac{1}{3}} \\ & \text { for } J \leqslant \frac{0.95}{1.254+2.27 \cdot Z^{1.249}}\end{aligned}$ (8)
where, Rel is liquid Reynolds number; ρl is liquid density, kg/m3; ρg is vapor density, kg/m3; g is gravity, m/s2; kl is liquid heat conductivity coefficient, W/m∙K; μl is liquid viscosity, Pa∙s; and J and Z are defined as
$J=\frac{x \cdot G}{\sqrt{g \cdot D_i \cdot \rho_g \cdot\left(\rho_l-\rho_g\right)}}, Z=\left(\frac{1}{x}-1\right)^{0.8}\left(\frac{p}{p_c}\right)^{0.4}$ (9)
where, G is liquid mass flow, kg/s; Di is hydraulic diameter in HTF side, m; p is pressure, Pa; pc is critical pressure, Pa. Different vapor quality results in different states of condensation process. When the vapor quality is 0.10 < x < 0.99, the system satisfies the Eq. (9) condition.
As a liquid flow in the supercooling region, the convective heat transfer coefficient [14] in Eq. (7) is
$h_{s c}=0.034 \cdot \mathrm{Re}_l^{0.8} \cdot \operatorname{Pr}_l^{0.3} \cdot \frac{k_l}{D_{\mathrm{i}}}$ (10)
where, Prl is liquld Prandtl number; kl is liquid heat conductivity coefficient, W/m∙K.
In the air side, air equivalent convective heat transfer coefficient in Eq. (6), mixed with conduction resistance, is
$\alpha^{\prime}=\frac{1}{\frac{1}{\alpha}+r}$ (11)
where, r is interface resistance, m2k/W; α is air convective heat transfer coefficient, W/m2K; defined as
$\alpha=S t \cdot c_{p a} \cdot G=\frac{j}{\operatorname{Pr}^{2 / 3}} \cdot c_{p a} \cdot G$ (12)
where, St is Stanton number; Pr is air Prandtl number.
For the corrugated fin, the j factor [15] is calculated as follows
$\begin{array}{r}j=0.242 \cdot \operatorname{Re}^{-0.375}\left(\frac{H_a}{D p_a}\right)^{0.235}\left(\frac{2 A}{D p_a}\right)^{-0.288}\left(\frac{W_a}{2 A}\right)^{-0.553}, \\ 1000 \leqslant \operatorname{Re}<15000\end{array}$ (13)
where, Re is air Reynolds number, others are geomatic parameters shown in section 2.1.
The energy is transmitted along the height of the fins and is convective with the air. Then the surface efficiency needs to be calculated. Neglecting heat conduction in the direction of fin thickness, the differential heat conduction equation along the height direction is established as
$k_m \cdot t_f \cdot l \cdot \frac{d^2 T}{d x^2} \cdot d x=2 \cdot \alpha^{\prime} \cdot l \cdot d x \cdot\left(T_w-T\right)$ (14)
where, km is clapboard heat conductivity coefficient, W/m∙K; Tw is wall temperature, ℃; T is temperature, ℃.
This formula is used to integrate dx from 0 to Ha. According to the definition, the fin efficiency is
$\eta_a=\frac{\tanh \left(\frac{1}{2} \cdot \sqrt{\frac{2 \cdot \alpha^{\prime}}{k_m \cdot T_a}} \cdot H_a\right)}{\frac{1}{2} \cdot \sqrt{\frac{2 \cdot \alpha^{\prime}}{k_m \cdot T_a}} \cdot H_a}$ (15)
where, ηa is fin efficiency; Ta is fin thickness in air side, m.
Thus, the surface efficiency in Eq. (6) is calculated by
$\eta=1-\frac{L_{x a}}{L_{x a}+L_{y a}}\left(1-\eta_a\right)$ (16)
2.3 Hydraulic model
The pressure drop of the total flow resistance is
$\Delta P_f=\Delta P_{\mathrm{lg}}+\Delta P_l$ (17)
where, ΔPf is HTF pressure drop, Pa; ΔPl is pressure drop for liquid flow area, Pa; ΔPlg is pressure drop for two-phase flow area, Pa; which can be calculated by
$\Delta P_{\mathrm{lg}}=\frac{f_l}{2} \cdot \frac{L_{\mathrm{lg}}}{D_i} \cdot \frac{G^2}{\rho_l} \cdot \phi_l^2$ (18)
where, fl is liquid friction factor; Llg is the channel distance of two-phase flow, m; Φl2 is two-phase friction multiplier. And the mixed correlation [16] of two-phase frictional pressure drop for condensing flow in pipes is of the form
$\begin{aligned} \phi_l^2 & =Y^2 x^3+\left(1-x^{2.59}\right)^{0.632} \\ & \cdot\left(1+2 x^{1.17}\left(Y^2-1\right)+0.00775 x^{-0.475} F r^{0.535} W e^{0.188}\right)\end{aligned}$ (19)
where, the Y, Fr and We are calculated as
$\begin{aligned} & Y=\sqrt{\frac{\left(\frac{\Delta P}{\Delta L}\right)_g}{\left(\frac{\Delta P}{\Delta L}\right)_l}},\left(\frac{\Delta P}{\Delta L}\right)_g=\frac{G^2 f_g}{2 D_i \rho_g},\left(\frac{\Delta P}{\Delta L}\right)_l=\frac{G^2 f_l}{2 D_i \rho_l} \\ & F r=\frac{G^2}{g D_i \rho_{t p}^2}, W e=\frac{G^2 D_i}{\sigma \rho_{t p}}, \frac{1}{\rho_{t p}}=\frac{1-x}{\rho_l}+\frac{x}{\rho_g}\end{aligned}$ (20)
where, G is liquid mass flow, kg/s; Di is hydraulic diameter in HTF side, m; fg is vapor friction factor; fl is liquid friction factor; x is vapor quality; ρg is vapor density, kg/m3; ρl is liquid density, kg/m3; σ is surface tension, N/m; Fr is Froude number; We is weber number.
The pressure drop for liquid flow area in Eq. (17) is
$\Delta P_1=\frac{f_l}{2} \cdot \frac{L_1}{D_i} \cdot \frac{G^2}{\rho_l}$ (21)
where, Ll is the channel distance of liquid flow, m; and the liquid friction factor in Eq. (18) and Eq. (21) could be calculated by
$f_l=\left\{\begin{array}{l}\frac{64}{\operatorname{Re}}, \mathrm{Re} \leqslant 2000 \\ (1.1525 \operatorname{Re}+895) \times 10^{-5}, 2000<\operatorname{Re}<3000 \\ \frac{0.25}{\left(\log \left(\frac{150.39}{\operatorname{Re}^{0.98865}}-\frac{152.66}{\operatorname{Re}}\right)\right)^2}, \mathrm{Re} \geqslant 3000\end{array}\right.$ (22)
To optimize the ACC structure utilizing the theoretical algorithm outlined in section 2, it is fundamental to validate the theory's correctness. In this section, an ACC was then manufactured using the initially optimized parameters in section 3.1, and a self-circulating test platform was constructed shown in section 3.2. The self-circulating test platform was then used to measure the ACC's actual cooling capacity and the HTF pressure drop between the inlet and outlet. The experiment was executed following the outlined steps. We finely adjusted the heating power multiple times and strictly measured the temperature and wind speed. Hence, the experimental outcomes were dependable.
3.1 Parameter of AAC
Based on the method of section 2, the parameters of the ACC were determined through calculation and optimization, shown as Table 1.
Table 1. The main parameters of condenser
|
Parameter |
Value |
Unit |
|
Wa |
140 |
mm |
|
Ba |
870 |
mm |
|
Ha |
11.3 |
mm |
|
Dpa |
2.3 |
mm |
|
ta |
0.2 |
mm |
|
Hf |
3.8 |
mm |
|
Dpf |
2.3 |
mm |
|
tf |
0.2 |
mm |
The parameters were described in section 2.1. The heat exchange section of the ACC has a height of 870mm, a width of 870mm and a depth of 140mm, as shown in Figure 2. The fins on the air and HTF sides feature identical spacing and thickness of 2.3mm and 0.2mm, respectively, with heights of 11.3mm and 3.8mm, respectively. Furthermore, a vapor quality of 0.28 and a HTF pressure drop of approximately 432Pa have been calculated based on the design flow shown in Figure 1.
3.2 Experiment set-up and result
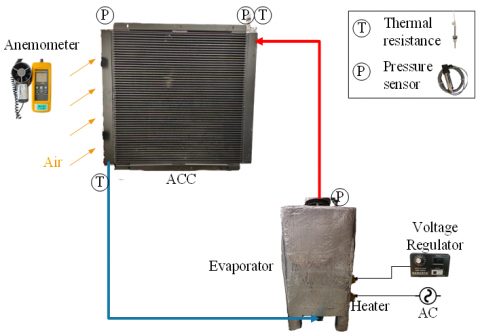
Figure 3 illustrates that the electric heaters in the evaporator are connected to both AC power supplies and a voltage regulator for adjusting the heating power. The cool liquid-phase HTF is then heated until it becomes gas phase in the evaporator, as shown in the bottom right of the figure. The two-phase liquid-gas HTF flows through the riser, as indicated by the red line, into the ACC located at the top left of the figure. After releasing heat to the air side, the HTF condenses into liquid phase and flows back into the evaporator via gravity through the downcomer, represented as the blue line.
Figure 3. Experimental apparatus
To measure the actual HTF pressure drop, high-precision pressure transmitters are installed at the inlet and outlet of the horizontal flow passage of the ACC. Thermal resistances are installed not only at the HTF inlet and outlet of the ACC but also at the air inlet and outlet of the ACC to collect temperature. All the data are recorded in FLUKE 2686 DAQ. Air velocity is measured by using an anemometer, while fan speed is adjusted to control air velocity. The value of the evaporator's heating power is read directly from the distribution box's power meter. The FLUKE 9171 is used to carefully calibrate all thermal resistances.
In the experiment apparatus, the parameters of main sensors and actuators are shown in Table 2.
Table 2. The main parameters of sensors and actuators
|
Parameter |
Range |
Accuracy |
|
Pressure sensor |
-50 - +50 kPa |
0.1% |
|
Anemometer |
0 - 25 m/s |
2% |
|
Thermal resistance |
0 - 100℃ |
0.35℃ |
|
Voltage regulator |
0 - 220 V |
1 V |
|
Frequency inverter |
0 - 50 Hz |
0.1 Hz |
In the experimental apparatus, the inlet pipe of the condenser is made of low thermal conductivity material. To ensure the actual condenser heat transfer greater than 17kW, the heating power inside the evaporator is 17.3 kW, which compensates the heat loss of inlet pipe.
After connecting the pipe by flange or thread, the maximum heating power was loaded on the evaporator, and the non-condensing gas was removed by multiple venting. After preheated, the heat power was adjusted for many times to 17.3kW and all experimental data was recorded in steady state with temperature fluctuation less than 0.35℃ for more than 30 minutes.
The experiment result shows that the condenser can satisfy the heat transfer power of 17 kW. Moreover, the measured HTF pressure drop between inlet and outlet is 519 Pa. Then the calculated pressure drop of 432 Pa is 16.6% different from that of experimental value. Since the relative error of 16% is less than the acceptable error limit of 20%, it is considered that the design method is reliable.
During the calculation process, the geometry and flow rate of each HTF channel in the ACC are identical while the wind speed in each channel on the windward side is uniformly distributed. And the surface roughness of the riser and downcomer pipes differs from that of the actual pipeline. Consequently, these differences lead to deviations in test conditions from the ACC's design values, which result in variations in vapor quality and flow rates. These variations, in turn, result in deviations in HTF pressure drops between the design and testing phases.
In this section, the hydraulic diameter on the HTF side, the air speed in air side and the fin parameters of the structure are taken as variables to analyze the influence on the heat transfer coefficient and flow pressure drop. These variables may have a great impact on ACC as a whole or on part and the detailed analysis is as follows.
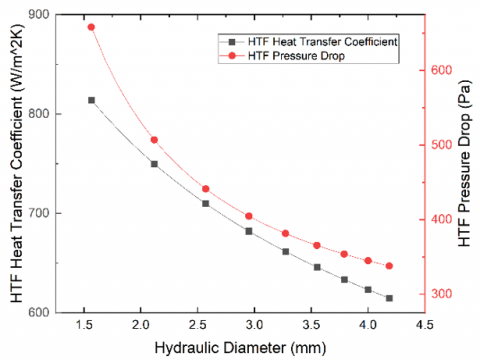
4.1 The influence of hydraulic diameter
Figure 4. The influence of hydraulic diameter
Fixed the fin height in the channel, the effect of the hydraulic diameter is obtained shown in Figure 4 by adjusting the fin spacing. From the figure, the smaller the hydraulic diameter is, the better the HTF heat transfer performance is, and the larger the HTF pressure drop is. When the hydraulic diameter is less than 2.5 mm, the increase of flow resistance is faster than that of heat transfer enhancement. Therefore, it is reasonable to adopt 2.5-3mm diameter.
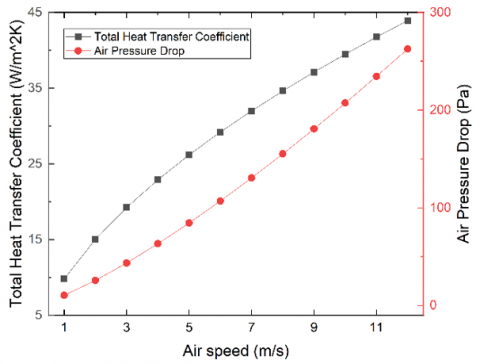
4.2 The influence of air speed
According to the Eq. (13), the increased air speed can increase the heat transfer coefficient in air side. Therefore, the total heat transfer coefficient increases as shown in Figure 5, which contributes to the reduced size of the heat transfer surface and the structure of the condenser. However, the air pressure drop increases as well according to Eq. (21). Then, the cost will be greater increase for the choice of higher requirements for fans. Therefore, it has the better economy at the air speed of 7 m/s.
Figure 5. The influence of air speed
4.3 The influence of fin spacing and height
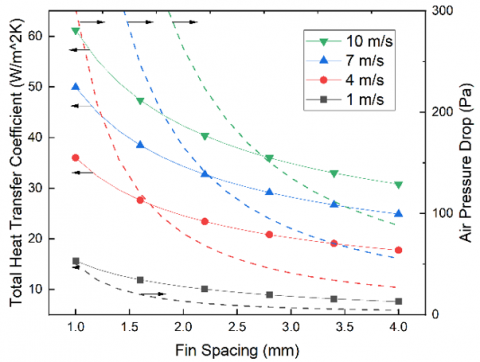
Figure 6. The influence of fin spacing
From Figure 6, the total heat transfer coefficient and pressure drop of the air increase sharply with the increase of the windward air speed on the constant structure parameters structure. The heat transfer coefficient and pressure drop of the air side decrease gradually with the increase of fin spacing. In addition, the pressure drop decreases greatly when the fin spacing is small.
Comparing heat transfer coefficient and pressure drop with the fin spacing under different windward air speed, the fin spacing has a greater effect on the air pressure drop and a smaller effect on the heat transfer coefficient at high air speed. When the wind speed is low, the fin spacing has little effect on both the heat transfer coefficient and pressure drop.
Therefore, the influence of fin spacing on heat transfer coefficient and air pressure drop (especially pressure drop) should be considered comprehensively in the design of condenser. And the proper fin spacing should be selected to improve the overall performance of heat exchanger.
According to the Eqs. (10)-(13), the heat transfer coefficient of the air side becomes greater with the increase of the fin height. However, considering the fin efficiency, the heat transfer coefficient per unit height is gradually reduced, and the numerical difference is small. Thus, it has little influence on the design of the condenser. And in the design process, the fin height could be the final adjustment, with the design of the heat transfer area and heat transfer exchanger body volume.
While self-circulating evaporative cooling technology can meet the heat dissipation requirements of high heat flux density, it possesses weak circulating power. Thus, the HTF pressure drop of ACC needs to be minimized in self-circulating system. In view of the heat exchange capacity of 17 kW and the pressure drop limit below 500Pa, the design process of low flow resistance ACC is presented and verified by experiments. Then the influencing factors of the HTF side parameter, the air side parameter, and the fin structure are analyzed. Thus, the following conclusions are obtained.
1. The design process of the low flow resistance ACC is reasonable. The experimental results show that the heat transfer power meets the design requirement of 17kW. The HTF pressure drop error between design and experiment is less than 16.6% while the acceptable error limit is 20%. Thus, the ACC design process is reliable in self-circulating system.
2. Once the flow resistance meets design requirements, the insert fin on the HTF side adopts a smaller hydraulic diameter to enhance the heat transfer coefficient. As Di decreases, hc and hsc increase according to Eq. (7), resulting in a greater heat transfer coefficient. Conversely, this increase also causes a rise in ΔP as stated in Eq. (18) and Eq. (21). Thus, the hydraulic diameter of 2.5-3mm strikes a better balance.
3. The heat transfer coefficient of ACC increases with higher air speeds. However, the fan requirements increase significantly to generate higher static pressure. Due to the large flux and limited geometry, a fan with high airflow and static pressure is needed, but it is usually not cost-effective. If size requirements are less strict, a conventional fan with slightly higher fin dimensions can often satisfy the heat dissipation needs.
4. In design, it is necessary to consider the influence of fin spacing on heat transfer coefficient, especially the influence on the air pressure drop. A decrease in fin spacing causes an increase in air friction resistance due to an increase in the friction factor and a decrease in hydraulic diameter. A slight decrease in fin spacing under specific smaller conditions can lead to significant increases in friction resistance, and this might necessitate a high static pressure fan to compensate for it, which could render the system impractical. In this paper, a fin spacing of approximately 2mm would be suitable.
|
A |
total effective heat transfer area, m2 |
|
Ba |
depth of exchanger body, m |
|
cp |
HTF specific heat, J∙kg-1∙K-1 |
|
cpa |
air specific heat, J∙kg-1∙K-1 |
|
Di |
hydraulic diameter in HTF side, m |
|
Dpa |
fin spacing in air side, m |
|
Dpf |
fin spacing in HTF side, m |
|
fg |
vapor friction factor |
|
fl |
liquid friction factor |
|
Fr |
froude number |
|
g |
Gravity, m∙s-2 |
|
G |
liquid mass flow, kg∙s-1 |
|
h |
Equivalent convective heat transfer coefficient, W∙m-2∙K-1 |
|
Ha |
total heicht in air side, m |
|
hc |
convective heat transfer coefficient of condensation, W∙m-2∙K-1 |
|
hECF |
overall heat transfer coefficient of HTF, W∙m-2∙K-1 |
|
Hf |
total heicht in HTF side, m |
|
hsc |
convective heat transfer coefficient of supercooled region, W∙m-2∙K-1 |
|
kl |
liquid heat conductivity coefficient, W∙m-1∙K-1 |
|
km |
clapboard heat conductivity coefficient , W∙m-1∙K-1 |
|
Lxa |
channel width in air side, m |
|
Lxf |
channel width in HTF side, m |
|
Lya |
channel height in air side, m |
|
Lyf |
channel height in HTF side, m |
|
na |
Layers in air side |
|
nf |
Layers in HTF side |
|
p |
Presure, Pa |
|
pc |
critical pressure, Pa |
|
Prl |
liquld Prandtl number |
|
Qc |
heat transfer of condensation, W |
|
Qsc |
heat transfer of supercooled region, W |
|
Qtotal |
total heat transfer, W |
|
r |
interface resistance, m2K∙W-1 |
|
Rel |
liquid Reynolds number |
|
St |
Stanton number |
|
T |
Temperature, ℃ |
|
Ta |
fin thichness in air side, m |
|
Tc,i |
air inlet temperature, ℃ |
|
Tc,o |
air outlet temperature, ℃ |
|
Tf |
fin thichness in HTF side, m |
|
Th,i |
HTF inlet temperature, ℃ |
|
Th,o |
HTF outlet temperature, ℃ |
|
Tw |
wall temperature, ℃ |
|
Wa |
width of exchanger body, m |
|
We |
weber number |
|
x |
vapor quality |
|
Greek symbols |
|
|
α |
air convective heat transfer coefficient , W∙m-2∙K-1 |
|
α’ |
air equivalent convective heat transfer coefficient, W∙m-2∙K-1 |
|
$\dot{m}_a$ |
air mass flow, kg∙s-1 |
|
$\dot{m}_f$ |
HTF mass flow, kg∙s-1 |
|
μl |
liquid viscosity, Pa∙s |
|
Φl2 |
two-phase friction multiplier |
|
ρg |
vapor density, kg∙m-3 |
|
ρl |
liquid density, kg∙m-3 |
|
η |
surface efficiency |
|
ηa |
fin efficiency |
|
ΔD |
clapboard thickness, m |
|
Δhlg |
HTF latent heat, J∙kg-1 |
|
ΔPf |
HTF pressure drop, Pa |
|
ΔPl |
pressure drop for liquid flow area, Pa |
|
ΔPlg |
pressure drop for two-phase flow area, Pa |
|
ΔTLM |
logarithmic mean temperature difference, ℃ |
[1] Piancastelli, L. (2022). Continuous, high efficiency defrosting of air-to-air heat pumps. Power Engineering and Engineering Thermophysics, 1(1): 2-7. https://doi.org/10.56578/peet010102
[2] Oni, T.O., Aliyu, S.J., Adaramola, B.A., Rominiyi, O.L. (2023). A semiconductor-based refrigeration system for cooling of water: Design, construction, and performance tests. Power Engineering and Engineering Thermophysics, 2(1): 15-25. https://doi.org/10.56578/peet020102
[3] Li, Z., Gao, F., Zhao, C., Wang, Z. (2018). Research review of power electronic transformer technologies. Proceedings of the CSEE, 38(05): 1593. https://doi.org/10.13334/j.0258-8013.pcsee.172575
[4] Cao, R., Ruan, L. (2018). Feasibility study of evaporative cooling technology on converter valve. Power Electronics, 52(06): 40-42.
[5] Gu, G., Ruan, L., Liu, F., Xiong, B. (2015). Developments, applications and prospects of evaporative cooling technology. Transactions of China electrotechnical Society, 30(11): 1-6. https://doi.org/10.19595/j.cnki.1000-6753.tces.2015.11.001
[6] Wang, Y., Ruan, L. (2022). Self-circulating evaporative cooling system of a rotor and its experimental verification. Processes, 10(5): 934. https://doi.org/10.3390/pr10050934
[7] Mahvi, A.J., Rattner, A.S., Lin, J., Garimella, S. (2018). Challenges in predicting steam-side pressure drop and heat transfer in air-cooled power plant condensers. Applied Thermal Engineering, 133: 396-406. https://doi.org/10.1016/j.applthermaleng.2018.01.008
[8] Kamil, M.G., Kassim, M.S., Mahmood, R.A. (2022). Experimental investigation of coolant side characteristic on the performance of air-cooled condenser structured by horizontal flattened tube. International Journal of Heat and Technology, 40: 828-36. https://doi.org/10.18280/ijht.400323
[9] Saechan, P., Wongwises, S. (2008). Optimal configuration of cross flow plate finned tube condenser based on the second law of thermodynamics. International Journal of Thermal Sciences, 47(11): 1473-81. https://doi.org/10.1016/j.ijthermalsci.2007.12.009
[10] Barbosa Jr, J.R., Melo, C., Hermes, C.J., Waltrich, P.J. (2009). A study of the air-side heat transfer and pressure drop characteristics of tube-fin ‘no-frost’ evaporators. Applied Energy, 86(9): 1484-91. https://doi.org/10.1016/j.apenergy.2008.11.027
[11] Chen, L., Yang, L., Du, X., Yang, Y. (2016). A novel layout of air-cooled condensers to improve thermo-flow performances. Applied Energy, 165: 244-59. https://doi.org/10.1016/j.apenergy.2015.11.062
[12] Başaran, A., Yurddaş, A. (2021). Thermal modeling and designing of microchannel condenser for refrigeration applications operating with isobutane (R600a). Applied Thermal Engineering, 198: 117446. https://doi.org/10.1016/j.applthermaleng.2021.117446
[13] Lin, J., Mahvi, A.J., Kunke, T.S., Garimella, S. (2020). Improving air-side heat transfer performance in air-cooled power plant condensers. Applied Thermal Engineering, 170: 114913. https://doi.org/10.1016/j.applthermaleng.2020.114913
[14] Shah, MM. (2022). Improved correlation for heat transfer during condensation in mini and macro channels. International Journal of Heat and Mass Transfer, 194: 123069. https://doi.org/10.1016/j.ijheatmasstransfer.2022.123069
[15] Ismail, L.S., Velraj, R. (2009). Studies on fanning friction (f) and colburn (j) factors of offset and wavy fins compact plate fin heat exchanger–A CFD approach. Numerical Heat Transfer, Part A: Applications, 56(12): 987-1005. https://doi.org/10.1080/10407780903507957
[16] Xu, Y., Fang, X. (2013). A new correlation of two-phase frictional pressure drop for condensing flow in pipes. Nuclear Engineering and Design, 263: 87-96. https://doi.org/10.1016/j.nucengdes.2013.04.017