Dhuha Radhi Nayyef*![]() | Ala'a Abbas Mahdi
| Ala'a Abbas Mahdi![]()
© 2023 IIETA. This article is published by IIETA and is licensed under the CC BY 4.0 license (http://creativecommons.org/licenses/by/4.0/).
OPEN ACCESS
The ability of the chilled ceiling combined with mixing ventilation and personal ventilation system (CC/MVPV) to provide comfort and protect occupants from negative pollutants in an office room in Iraq City-Hilla climate (hot and dry climate) was studied considering the occupied density. A transient 3D computational fluid dynamics (CFD) model was used to evaluate the mean air life, temperature distribution, carbon dioxide concentration and thermal efficiency with the best flow rate of the proposed system and compared with the mixing ventilation and chilled ceiling (CCMV) by using AIRPAK software. Three tests were conducted for three different cooling load cases treated with (25, 50, and 80%) cooled ceiling with a total cooling load of (14.8, 29.6, 47.4) W/m2 of floor area. The chilled ceiling surface temperature ranged between (23, 21.39, 19)℃ and the mixing ventilation supply air temperature (19, 21, 23)℃ at a constant supply air flow rate (46 L/s) with two PV air flow rate (5 l/s, 7.5 l/s), room air temperature (25℃). It was discovered that by using a (CC/MVPV) system with an air flow rate (7.5 L/sec), the air quality in the breathing area can be improved based on the values of air exchange efficiency (ɳa) and air distribution performance index (ADPI), which are (72%, 89.9) respectively, the efficiency of air exchange (ɳD) when the visiting person (the person standing) stays in the room for an one hour, one and half hour , two hours by (99%, 96%, 94%), so we notice the longer he stays, the less the air change for the passengers due to the low ventilation rate.
chilled ceiling, mixing ventilation, personalized ventilation, age of air, air exchange efficiency, occupant density
The health, comfort, and productivity of office workers are all affected by the thermal climate and indoor air quality [1, 2]. Heating and cooling systems consume around 40% of a building's total energy. As a result, HVAC engineers have a difficult time creating pleasant conditions in low-energy environments, necessitating the development of new technologies. Mixed ventilation systems work to maintain a constant indoor atmosphere in the occupied zone of rooms when none of the occupants can be satisfied [3]. Before entering people's breathing zones, ventilation air is blended with contaminated room air when it is supplied from a distance [4].
Building ventilation has been systematically studied as a dynamic discipline for the past 100 years [4, 5]. To obtain an acceptable indoor environment, ventilation system designers and operators must be conscious of human comfort and air quality requirements [6]. It has been evaluated that the damage in the indoor climate leads to the loss of productivity about (2.7) billion euros/year in Finland [7]. Important factors influence thermal comfort and discomfort is human physical activity and indoor contamination concentrations [8]. Many review studies proved that most of illnesses there is strong and enough evidence to establish the link between ventilation and air movement in buildings and the spread of illnesses diseases such as SARS highlighting the importance of indoor environmental control [9]. There is no uncertainty that ventilation of the building directly impacts the indoor air quality as shown in different studies [10].
Personalized ventilation supplies clean air directly to occupants' breathing zones and allows for customized control of the microclimate at each workstation, resulting in promising air distribution [11]. In comparison to total volume ventilation, personal ventilation has the ability to improve inhaled air quality [3]. As a result, personal ventilation has the potential to improve inhaled air quality compared to total volume ventilation [3]. Previous study has discovered that customized ventilation lessens the severity of certain Sick Building Syndrome symptoms when compared to mixed ventilation [12]. Due to decreased airflow rates and the constraint of the lowest supply air temperature, personalized ventilation systems, on the other hand, are unable to remove a considerable percentage of the sensible heat load generated in areas [3]. Traditional mixing and displacement ventilation systems that condition the environment by delivering cool fresh air have been offered as a way to achieve these objectives [13]. Radiant cooling systems, such as the chilled ceiling (CC) system, use heated surfaces to exchange both convective and radiative heat [3]. The (CC) is a widely used gadget that is simple to implement in the workplace [14]. A metal panel hung from the ceiling and cooled by chilled water pipes is its distinguishing feature. Warmth is transferred from the cool ceiling to numerous heated items in the environment, such as people, walls, and computers, to create comfort. Chilled ceilings are a typical hydronic radiant cooling technique that can be found in a wide range of buildings. It has a higher cooling capacity. It is less complicated to maintain than traditional full air systems [15]. Radiant ceiling cooling provides the "cool head, warm feet" atmosphere. Total volume air systems are typically the cause, which is preferable to a "warm head and cool feet" option [16].
Previous research has shown that combining personal ventilation and mixed ventilation with a cooled ceiling is an effective way to increase thermal comfort and enhance perceived air quality in rooms with temperatures above the upper limit of the norm (26℃), [17, 18]. Increasing the maximum allowable air temperature in space and using PV with MV has been shown to be an effective energy-saving strategy [17]. Changing from total volume to target air distribution in workstations can also improve the perceived air quality. Most of the previous studies dealt with ventilation and the cooled roof system but did not focus directly on the occupied density index. It will be needed to estimate and clearly identify areas affecting human exposure to pollutants.
The aim of this study is to study the effectiveness of the (CC/MV PV) system with a preferential ratio of the load of the treated coolant to the ceiling in terms of thermal environment and air age and compare it with the system (CCMV), taking into account the density index occupied in an office room under the climate of Iraq - Hilla city, which is considered a new starting point in the Iraqi buildings because it was not used in advance.
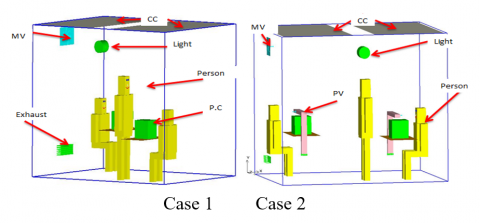
The simulation was carried out in an office room with dimensions (3×2.5×2.5) m3 equipped with a mixing ventilation system and personal ventilation (PV) units on each desk at a distance (0. 4m) from the seated person and breathing height (1.1 m), cooled ceiling (CC), as shown in (Figure 1). The medium voltage was achieved using the supply distributor located in the middle of the north wall, under the room ceiling (0.2×0.1) m. The exhaust grille is located at the bottom of the diffuser, near the floor (30 cm above the floor), with a total area (0.16×0.1) m2. The suspended ceiling is equipped with two radiator cooling panels in height (2.5 m) and covers (80%) of the surface area of the room. The room has a total heat load of (445W) distributed between (occupants: 75 W/manikin, computers: 60 W/computer; lighting: 100 W and tables) as shown in Figure 1. The operating condition of chilled ceiling (23 to 19), mixing ventilation between (19 to 23℃) and air flow rate (46l/s) and personal condition of (22℃) and air flow rate (5 l/s ,7.5 l/s).
Figure 1. Illustration of the tested room equipped with CC/MV, CC/MVPV
Calculating the cooling loads by calculating the thermal loads inside the room as detailed in (ASHRAE Handbook) [18] by using the following Eq. (1).
$C L_{M V}=q o e+q l+q e x$ (1)
Determination of supply air temperatures for MV and PV systems using room air temperature as the design parameter as suggested in (EN 15251 and EN ISO 7730) [3, 19, 20].
In order to avoid the discomfort caused by clouds, the difference between the temperature of the PV supplied air and the temperature of the room air was set to (3K).
Calculating the supply air flow rate (QS) according to the following Eq. (2) [21]:
$\mathrm{Q}_S=\frac{\mathrm{CL}_{\mathrm{MV}}}{C P \times\left(T_{r d}-T_S\right)}$ (2)
3.1 Air supply diffusers
Calculating the surface area of the rectangular diffuser for the air according to the following equations:
$\mathrm{Q}_S=V s \times A s$ (3)
$A \mathrm{e}=80 \% \times A \mathrm{~s}$ (4)
$A C H=\mathrm{Q}_S Vroom \times 3600$ (5)
where, Vs: Supply air speed (m/s), As: Surface area of supply diffuser (m²) [22].
The air terminal device for PV system has 48 holes with a diameter of (1.5cm) spread equally and with similar dimensions over its surface area. Whereas (the total number of holes divided by the total area of each hole).
3.2 Chilled ceiling surface temperature
The chilled ceiling surface temperature was calculated using an empirical Eq. (7) [23].
$\eta=\frac{C L_{C C}}{\left(C L_{M V}+C L_{C C}\right)}$ (6)
$T_{C C}=T_{r d}-\left(\frac{C L_{M V} / C L_{C C}}{8.92 \ f \ A_f}\right)^{0.9}$ (7)
where, $f=\frac{\text { chilled ceiling area }\left(\mathrm{A}_{\mathrm{CC}}\right)}{\text { floor area }\left(\mathrm{A}_{\mathrm{f}}\right)}=0.8$ .
Table 1. Numerical operating condition for three cases
|
Case |
η (%) |
CLMV (W) |
CLCC (W) |
QS (l/s) |
QPV (l/s) |
TS (℃) |
QS % |
TCC (℃) |
|
Case 1 |
25 |
333.7 |
111 |
46 |
---- |
19 |
75 |
23 |
|
50 |
222.5 |
222.5 |
46 |
---- |
21 |
65 |
21.3 |
|
|
80 |
89 |
356 |
46 |
---- |
23 |
58 |
19 |
|
|
Case 2 |
25 |
333.7 |
111 |
46 |
5 |
19 |
75 |
23 |
|
50 |
222.5 |
222.5 |
46 |
5 |
21 |
65 |
21.3 |
|
|
80 |
89 |
356 |
46 |
5 |
23 |
58 |
19 |
|
|
Case 3 |
25 |
333.7 |
111 |
46 |
7.5 |
19 |
75 |
23 |
|
50 |
222.5 |
222.5 |
46 |
7.5 |
21 |
65 |
21.3 |
|
|
25 |
89 |
356 |
46 |
7.5 |
23 |
58 |
19 |
The dew point temperature for an office room with (50%) relative humidity and (25℃) dry bulb temperature is (14℃), hence the chilled ceiling surface temperature needs to be higher than (15℃) to prevent condensation risk. For two situations, the values of (Ts) and (TCC) at different value of (η) are shown in Table 1.
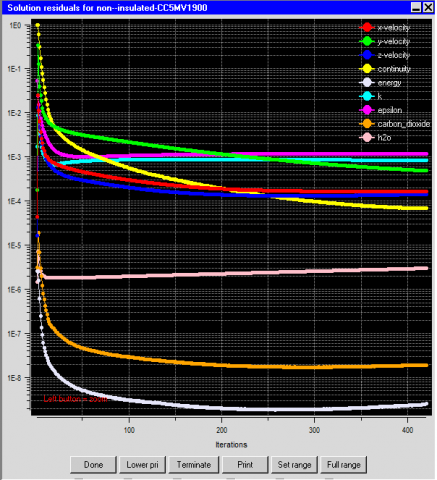
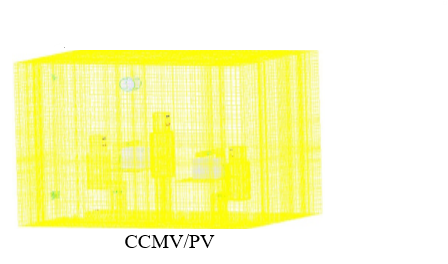
AIRPAK simulation software to simulate airflow, pollutants, and thermal comfort rapidly and precisely. The use of the premier computational fluid dynamics (CFD) program, to ventilation problems is made easier with AIRPAK software to solve thermal calculations and flow of fluid to solve the equation to conserve mass, energy, and air momentum [24]. (RNG k-ε) turbulence model was chosen to solve flow equations improved wall treatment, and full buoyancy effect. The (CC/PVMV) mesh contained (334923, 382089, 405595) element no, (343678, 402618, 419772), size element (0.07), normal mesh parameter with maximum side ratio (2), The choice was made after numerous tries for (CCMV, CCMV/PV) element no by using Hexa unstructured geometry to discretize. For this function, the space should be suitably meshed for correct predictions of flow behavior (Figure 3). Simulations were performed until the results were stable, as indicated in the picture, at a level of approximation (10-5) (Figure 2). The aspects of the mesh improvement are the creation of four different mesh systems of the type of (coarse, course, medium, and fine) take the test. These improvements led to determining and reducing the error resulting from estimate and obtaining accurate and stable solutions. In this numerical analysis, the governing equations are [25-27].
Continuity equation
$\nabla \cdot \overrightarrow{\mathrm{V}} \ =0$ (8)
Momentum equation
$\frac{\partial}{\partial t}(\rho \vec{v})+\nabla. (\rho \vec{v} \vec{v})=-\nabla P+\nabla(T)+\rho \vec{g}$ (9)
Energy equation
$\frac{\partial}{\partial t}(\rho h)+\nabla \cdot(\rho h \vec{v})=\nabla\left[K+K_t \nabla T\right]+S_h$ (10)
Figure 2. Residual error monitor
Figure 3. Illustration of the meshed model for three cases
4.1 Validation of AIRPAK software
The results of the AIRPAK program for the two systems (CC/MVPV, CC/MV) were validated by a pilot study conducted by it (A. and compared the experimental results obtained in an office room in Poland with the experimental results (using the k-RNG perturbation model). The comparison was based on the distribution of temperature with height (vertical gradients of temperature) for seated and standing people between head and ankle levels, and breathing area (Figure 4). Experimental and numerical results were in agreement with a maximum relative error (5.04%) at height (2 m). The computational and experimental results agreed well with a maximum relative error (4.53%) for the abdominal region, and the following equation was used to obtain the average total error.
Figure 4. Validation of the AIRPAK software with experimental data by Lipczynska et al. [3]
4.2 Turbulence model and numerical schemes
The numerical simulation setup is detailed in Table 2. There are three different types of working fluid. The most important of which is air, followed by (CO2 and H2O) as pollution and moisture, respectively. Knowing the properties of the materials is critical to the modeling process of simulating different working fluids because it helps to reduce the number of iterations needed for convergence, allowing convergence to occur as quickly as possible, and it also plays an important role in obtaining an accurate and reliable solution.
Table 2. Setup of the numerical model and solver
|
Flow |
3D Pressure based, steady state, incompressible fluid, without chemical reaction, frictionless and implicit formulation |
|
Methods of solution |
Semi Implicit (SIMPLE Scheme) for pressure and velocity. Pressure Staggering Option (PRESTO) for pressure, Second order upwind for velocity, temperature, H2o, CO2. |
4.3 Boundary conditions
The boundary conditions for the three insulated office room cases are shown in Table 3.
Table 3. A description of the simulated systems and their boundary conditions
|
Part |
Details |
|
Ventilation systems (MV, PV) |
Constant inlet velocity and temperature for MV VMV=2.5 m/s, TMV=17℃ [20]. Constant inlet temperature for PV TPV=22℃ [22]. Room air temperature Trd=25℃ Outdoor air temperature TO=47℃ Turbulence intensity=10% Discrete phase modeling of (MV,PV)=Reflect |
|
Exhaust grille |
Pressure: Outlet, gauge pressure=Zero Discrete phase modeling: Escape |
|
Thermal manikin, walls, Table floor, chair |
Wall: Stationary, No slipping Sidewalls, ceil and floor: Zero heat flux Occupants, computers, lights: Constant heat sources Thermal manikin (75 W), lamp (100 W) Comp (60 W), Discrete phase modeling Trap |
|
Manikin (Human Body) |
Constant skin temperature of body for all parts |
|
CO2 source |
Constant inlet velocity, Turbulence Intensity =7.7% Constant inlet value of concentration Cin=1000 ppm |
5.1 Age of the air
Age of air defined as the ability of the ventilation process to replace the old air in a room by fresh air [28]. the average mean age of air was regarded as the average time elapsed between entering fresh air until it reaches a certain point in the room, and it could be used to measure the overall ventilation performance inside room. The nominal time constant (τn) of a ventilated zone (the ratio of zone volume to the air flow rate supply) [28].
$\tau_n=\frac{V}{Q_S}$ (11)
Then the air exchange efficiency (ηa) represented as [28]:
$\eta_a=\frac{\tau_n}{2(\tau)}$ (12)
5.2 Occupied density
It's used to describe the distribution of people in a space. It's the proportion of time occupants spend in a specific area to the total time they spend in the room [28].
$D_i=\frac{\sum_{i=1}^N I D_i}{N}$ (13)
$\langle\tau\rangle_D=\sum_i\langle\tau\rangle_{i } D_i$ (14)
where, $\langle\tau\rangle_i$ mean age of air in the i- location (sec); and Di=1.
5.3 Air exchange efficiency of occupants
$\left(\eta_{\mathrm{a}}\right)_D=\frac{\tau_{\mathrm{n}}}{2(\tau)_D}$ (15)
5.4 Predicted mean vote PMV
It's described as an index that a prediction of the population's average vote on a seven-point thermal sensation scale from (+3) for cold interior air to (-3) for hot indoor air [29].
PMV $=[0.303 \exp (-0.036 \mathrm{M})+0.028] \mathrm{L}$ (16)
According to (ASHRAE guidelines), the optimal range of (PMV) for adequate internal comfort is (-0.5<PMV< 0.5) [29].
5.5 Predicted percentage dissatisfied PPD
(PPD) predicts the proportion of people experiencing extreme heat discomfort. The anticipated mean vote (PMV) was used to determine the PPD, as shown in Eq. (17) [29].
The maximum PPD for a favorable thermal environment is 10% [29].
$\begin{array}{r}\text { PPD }=100-\mathrm{ex}-\left[0.03353(\mathrm{PMV})^4+0.2179(\mathrm{PMV})^2\right]\end{array}$ (17)
It is the ratio of the nominal time constant to the average age of the air weighted by the inhabited density.
5.6 Air diffusion performance index ADPI
(ADPI) is a metric for evaluating the overall performance of an air distribution system, It's ratio of the total number of temperature points in an occupied region with an EDT value between (-1.7 and 1.1)℃ divided by the total number of temperature points in the same area, (ADPI) value of 80% is usually acceptable for cooling mode operation [29].
$A D P I=\left(\mathrm{N}_\theta / \mathrm{N}\right) \times 100$ (18)
The performance of the (CCMV/PV) system in the highest summer temperatures of the Iraqi climate was studied and compared with the (CCMV system using the Airpak program. Each case was subjected to three tests with different cooling load ratios treated with coolant ceiling (25%, 50%, 80%) and air supply temperature for mixing ventilation (19℃, 21℃, 23℃). In three cases, the air flow rate was set to (0.046 m3/s, 8.6 ACH) and two typical PV flow rates (5 L/s, 7.5 L/s). Detailed information on the numerical results for three cases are listed in Table 4.
Table 4. Numerical results for three cases
|
Case |
η% |
Ts C |
RH% |
TCC C |
MRT |
ADPI% |
PPD% |
PMV |
ηa% |
ηa)D% 1 hour |
ηa)D % 1.5 hour |
ηa)D% 2 hour |
|
|
Case 1 |
CC/MV |
25 |
19 |
75 |
23 |
25.3 |
84 |
20 |
0.72 |
54 |
76 |
73 |
71 |
|
CC/MV |
50 |
21 |
65 |
21.3 |
25.8 |
85.7 |
18.8 |
0.7 |
53 |
74 |
71 |
69 |
|
|
CC/MV |
80 |
23 |
58 |
19 |
26.1 |
87.2 |
17 |
0.66 |
50 |
71 |
68 |
66 |
|
|
Case 2 |
CC/MVPV_1 |
25 |
19 |
75 |
23 |
24.8 |
86.8 |
16.3 |
0.61 |
65 |
91 |
87 |
85 |
|
CC/MVPV_1 |
50 |
21 |
65 |
21.3 |
25.6 |
87 |
16 |
0.62 |
63 |
87 |
84 |
82 |
|
|
CC/MVPV_1 |
80 |
23 |
58 |
19 |
25.8 |
88.9 |
14.6 |
0.59 |
61 |
85 |
82 |
80 |
|
|
Case 3 |
CC/MVPV_2 |
25 |
19 |
75 |
23 |
24.5 |
87.6 |
13.8 |
0.59 |
72 |
99 |
96 |
94 |
|
CC/MVPV_2 |
50 |
21 |
65 |
21.3 |
25.2 |
88.1 |
13.4 |
0.49 |
71.5 |
97 |
94 |
92 |
|
|
CC/MVPV_2 |
80 |
23 |
58 |
19 |
25.5 |
89.9 |
12.3 |
0.44 |
70 |
96 |
93 |
91 |
|
6.1 Mean air age and air exchange efficiency
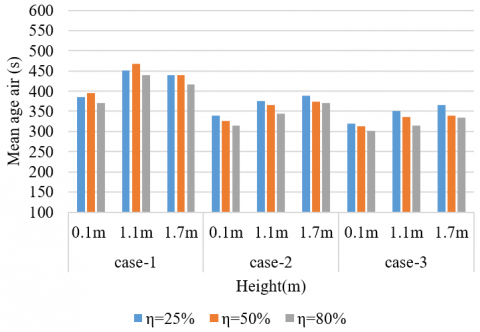
Figure 5 shows the relation of mean age of air with height at different value of (η) for three cases. It is noticed that the average air age increases with height and then returns to decrease near the breathing area of the sitting and standing person. The highest values for the mean air age in the occupied area appeared in the case (CC/MV), this means that the use of PV resulted in a significant decrease in the average age of the air in the breathing area and the perimeter of the room which means that the air in the breathing area is refreshed more quickly than it does .When the PV system is not used, resulting in a greater thermal comfort for the individual compared to the (CC/MV) condition.
Figure 5. Illustration of the mean age of air with height at various (η) for three case
The numerical results show that increasing the air supply velocity (ATD) lowers the temperature in the breathing area, averages room temperature, and reduces the lifespan of the air in the room even though the increase in air velocity should not cause inconvenience to the space occupants if the velocity remains air is less than (0.25 m/s). At a higher level (1 m), it is observed that the effect of temperature of the cooled ceiling is evident as the average life of the air increases with the increase of the cooling load fraction treated by the ceiling cooled by two air flow rates. This result illustrates the effect of cold air moving downward due to convection from the cooled ceiling and the effect as hot air rises, resulting in a lower air velocity. In fact, increased turbulence increases the mixing effect which leads to an increased diffusion of pollutants from carbon dioxide generation sources into the overall climate. The reduction of pollutants mainly depends on the location of the pollution source in relation to its occupants and on the PV air flow rate [3]. Therefore, in (case-2), the mean air age was lower compared to (case-3) due to the increase in the PV air flow rate, and this leads to better protection of the occupants from pollutants and viruses as shown in (Figure 5).
Low air exchange efficiency (ηa) refers to the amount of time it takes fresh air to replace stale air in the room area, as well as lower occupant performance. The efficiency of the air exchange increases with the decrease in the average age of the air and the increase in the PV air flow rate. So the highest value (ηa) in PVMVCC at air flow rate (7.5 L/sec) as shown in (Figure 6). As a result, flow rate (7.5 l/s) is the best option to protect occupants from direct pollution in the BZ area and in the surrounding microclimate Table 4.
Figure 6. Illustration of the air exchange efficiency at varies (η) for three cases
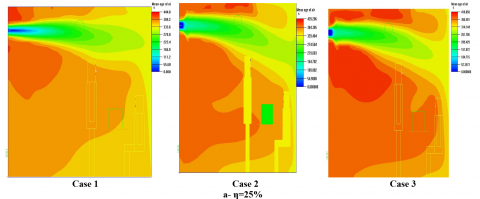
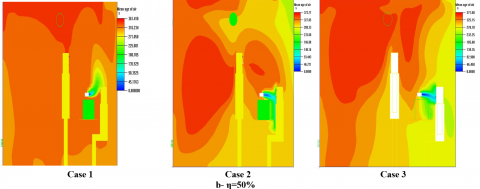
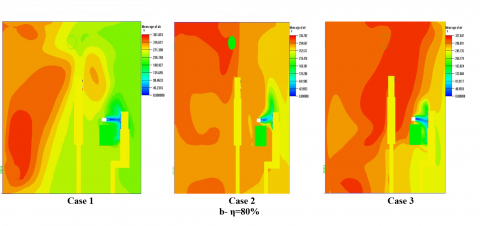
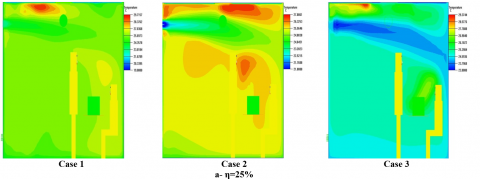
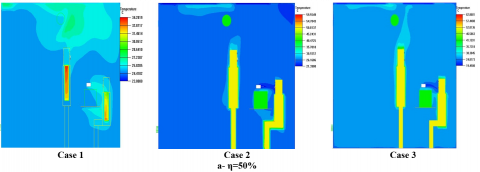
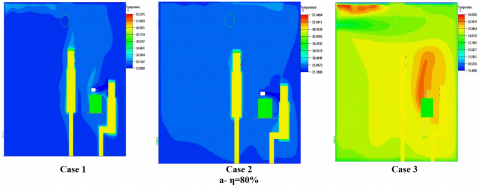
Figure 7 displays the contour of distribution of air age profiles in different value of (η) for three case at plane (Z=1.25 m). In the air supply diffuser, the age of the air starts from zero and increases in the indoor area. The age of the air increases with the height of the room and reaches its maximum above the dispenser location, which means that low air movement in this area leads to increased pollutants and discomfort to the occupants. The air age increase with increase the value of (η), due to the exchange of hot air rising to the top and cold air coming from the chilled ceiling. It is noted that the increase in the air velocity around the human body caused a decrease in the life of the air in this region as a result of the increase in the air temperature caused by convection near the heat sources (person and computer).
Figure 7. Contours of mean age of air in plane z=1.25m with different value of (η) for three cases
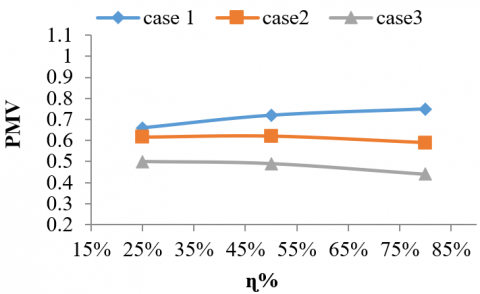
6.2 Thermal comfort and Air quality
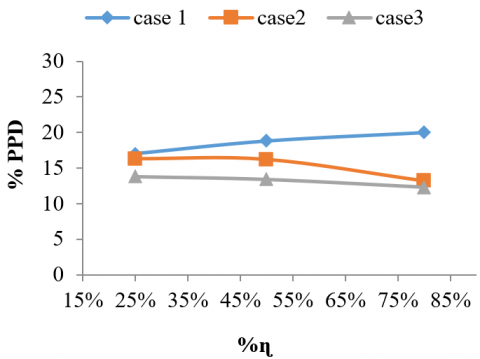
Figures 8, 9 show the relative air quality profiles, and thermal comfort indices (PMV and PPD) at different values of (η) for three conditions. It is observed in all cases that as the value of (η) increases, the PMV and PPD values decrease and converge with the comfort values defined by ASHRAE 2017 standard (-0.5 PMV 0.5 and PPD=10%), due to the higher temperature and the lower air supply velocity inside the room, which leads to reducing air mixing levels and turbulence intensity (weak air mixing and low turbulence intensity), reducing heat loss from the body and raising the room temperature. It is noted that the values of (PMV and PPD) decreased with the (CC/MV) system in all cases, which means that the introduction of cool PV air at warmer temperatures led to heat attenuation and improved comfort, which means integration (CC/VPV) to improve thermal comfort. The (PMV and PPD) values decrease with the increase in the air flow rate, which means that the increase in the PV rate leads to an increase in the turbulence near the person as well as the heat loss from the upper parts of the body caused by the CC, which leads to an improvement in comfort and this can be seen in Figures 8, 9.
Figure 8. Illustration of the PPD at varies (η) for three cases
Figure 9. Illustration of the PPD at varies (η) for three cases
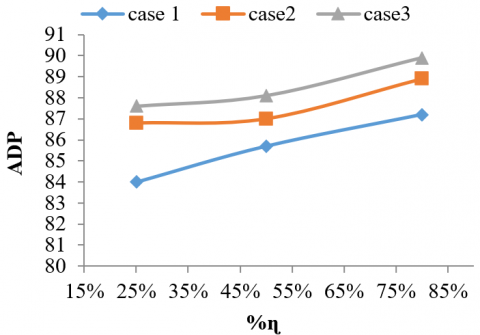
Figure 10. Illustration of the ADPI at varies (η) for three cases
For all cases analyzed, ADPI achieves values greater than (80%), which is above the minimum value (ADPI) recommended by the ASHRAE standard for good indoor air mixing. It is noted in all cases that with an increase in the value of (η), the values of ADPI increase and this means that when the convection is removed in the cooled ceilings, it leads to better thermal comfort. Values of (ADPI) go down with system (CCMV) so that use of PV in the (CCMV/PV) system for both airflow rate (5 L/s, 7.5 L/s) resulted in a higher IAQ in BZ due to continuous cleaning and mitigation of pollutants (Figure 10). This study shows that PV is able to create a uniform thermal environment and good air quality in the occupied area when combined with (CC) and may be higher than conventional (CC/MV), These results are compatible with the experimental results obtained [3].
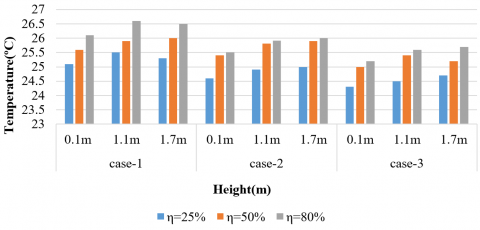
6.3 Air Temperature distribution
Figure 11 shows the relationship of air temperature distribution by a different value of (η) for three cases. It is noted that the temperature increases with the rise and with an increase (η) the average room temperature increases with an increase in the feeding air temperature due to the low air cooling capacity, it is noted that the temperature begins to rise when it passes through the sources of heat and moves up as a result of the fluting effects, then It returns to a decrease near the breathing area and the MV due to the cold air currents coming from the personal ventilation devices (ATD) as well as the air supply distributor above the room wall. The temperature difference was obtained between the head and the foot with less than (2), which is an acceptable range as specified in the ASHRA standards. It was noted that the lowest temperature inside the room at the level of (0.1 m) over the floor of the room inside the occupied area as a result of the absence of this level of sources the heat. The air enters from a height of (0.4 m) to be supplied with a person's breathing area, and the air output below the distributor is at a height of (0.3 m) from the room floor, and the speed of the air exit is higher than the speed of the room. The highest values of the anchored temperatures of the person sitting and standing with the (CC/MV) system appeared, as well as irregular distribution of temperature on parts of the entire body, as the air temperature in the breathing area and the lower parts of the body rises while it decreases in the upper parts of the body. Therefore, the use of photovoltaic leads to the entire body cooling and reduces the differences between the head and the ankle compared to the condition of (CC/MV). Parts of the upper part of the body are cooled (CC) due to the increase in radiation. It is noted that when (PV) is increased from (5 L /s to 7.5 L/s), (25% to 50%), the air temperature drops near the head at (1.7 m) (Figure 11). This is due to the increase in the rate of pure air supply that provides more cooling (Figure 12). So the breathing area in the case of (CC/MVPV) is characterized by a decrease in temperature with a good rise in the permissible air speed within the recommended thermal convenience. These results are compatible with the experimental results obtained [3].
The contours of the distribution of air temperature with different (ɳ) at Z=1.25m in the testing room are shown in (Figure 13). Notes that the effect of the cold air supply coming from the diffuser positioned in the upper section of the room wall causes the temperature to drop with the height of the office room in all cases. The temperature differential between the head and the foot is less than (2℃), which is within the ASHRAE standards' permissible range. When increase in the rate of airflow, the average room temperature decreases in the breathing zone and an increase in the speed of the air within a breathing zone resulted in a decrease in room temperatures in general (Figure 13). Because the air diffuser is situated towards the ceiling, the ceiling temperature is cooler than the room's floor temperature. Due to the arrival of cold air currents from personal ventilation devices (ATD) as well as the air supply diffuser, the air temperature begins to increase and then gradually decreases near (MV device).
Figure 11. The average age of air temperature distribution with heights at various (η) for three case
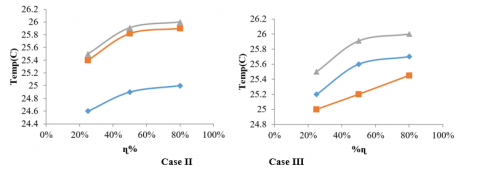
Figure 12. Relationship between of air exchange efficiency and temperature of air at two PV
Figure 13. The average age of air profiles at various heights (η) for three case
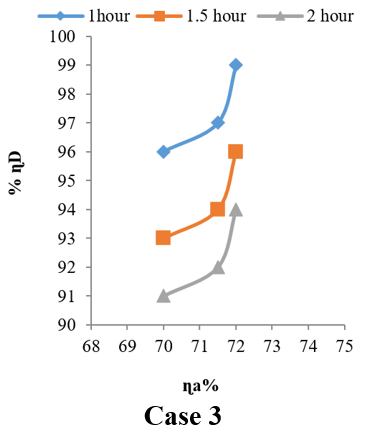
6.4 Occupied density and occupant air exchange efficiency
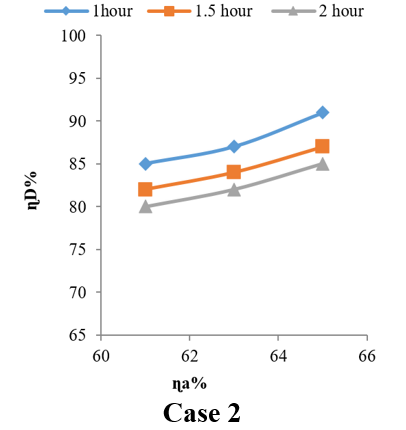
Figure 14. Relationship between of air exchange efficiency and occupant air exchange at three times
Air exchange efficiency takes into account the fact that air in different places has varying effects on ventilation. If the population stays longer or there are more of them, the effect is greater. By taking into account the spatio-temporal distributions of occupants, occupant air exchange efficiency can better indicate room air conditions than standard air exchange efficiency, which addresses the effect of air flow at different locations in the same way. A similar idea can be applied to determine the level of thermal comfort in a room [27].
In all cases, the longer the time people stay in the room, the less efficient the air change for the occupants, which means if the residents stay longer or there are more of them, the effect is greater as shown in (Figure 14).
In all cases, we note that the efficiency of air change for passengers is higher than the efficiency of air exchange, and this means that fresh air replaces the air in the well of the occupied area, which leads to an improvement in air quality as indicated in (Figure 14).
The visiting person (the person standing) the longer he stays in the room, the less efficient the air change for the passengers due to the low rate of ventilation. This means that occupant air exchange efficiency better refers to room air conditions than standard air exchange efficiency, which addresses the effect of air flow at different locations in the same way to determine the room's thermal comfort level as shown in (case-2, case-3). So that increase PV air flow rate leads to increase air exchange efficiency and then increase occupant air exchange efficiency (case-3).
The overall ventilation effect can be analyzed more comprehensively by using the passenger air exchange efficiency. Therefore, we30 note that the efficiency of air exchange for passengers increases in cases (case-2 and case-3), but this means that personal ventilation improves the efficiency of air exchange and determines the level of comfort inside the room as a result of its unique characteristics.
Due to the low aeration rate, the results showed a high efficiency of air exchange (9 ACH). However, since the weight of the density occupied inside the room is higher, the air exchange efficiency of the occupants is higher than the air exchange efficiency. The results show that the updated air exchange efficiency can be used to improve the criterion for evaluating the effect of ventilation. Otherwise, a system designed to improve indoor air quality can be beneficial. All of these cases show that the updated air exchange efficiency can be used to improve the criterion for assessing the impact of ventilation. Otherwise, a system designed to improve indoor air quality can be beneficial.
AIRPAK software was used to investigate the effect of mean indoor air age and thermal environment of a personal ventilation system and mixing ventilation combined with a cooled ceiling and compared to the MVCC system in an office room under Iraqi climate (hot and dry climate) in most cities of Iraq, and the (Hilla- city) was chosen as an example of that climate. The model was used to measure occupant protection against many pollutants that could directly or indirectly infect the occupant. This was achieved by the ratio of the cooled ceiling treated cooling load to the total office room cooling load at a constant air flow supplied by mixing ventilation in this study. The air supply temperature ranged from (19-23℃) depending on the percentage of cooling load taken up by the cooled ceilings (25% to 80%). Here are the main conclusions:
(1) For all cases, as the ceiling-chilled cooling load (η) increases, the average air life increases with altitude.
(2) The lowest values of the average air life in the occupied area appeared in the case of (CCMV).
This work is supported by the College of Engineering University of Babylon.
|
As |
Surface area of supply diffuser, m2 |
|
Ae |
Exhaust area of exhaust diffuser, m2 |
|
Af |
Floor area, m2 |
|
CP |
Specific heat of the air at constant pressure, kJ/kg.K |
|
g |
Gravitational acceleration, m/s2 |
|
h |
Convection heat transfer coefficient, W/m2.K |
|
I.D |
Individual O.D |
|
K |
Conduction or heat transfer coefficient, W/m.K |
|
L |
Thermal load |
|
M |
Metabolic heat generation |
|
N |
Total number of draft temperature points measured in occupied zone |
|
Nθ |
Number of points of draft temperature measured in occupied zone |
|
O.D |
Occupant density |
|
P |
Pressure, N/m2 |
|
CLCC |
Cooling load of chilled ceiling |
|
CLMV |
Cooling load of mixing ventilation |
|
Qs |
Supply air flow rate, l/s |
|
qex |
Cooling load for the heat conduction, W |
|
ql |
Cooling load for the overhead lighting, W |
|
qoe |
Cooling load for occupant, desk and equipment, W |
|
Sh |
Source term for the rate of thermal energy Production, J/kg |
|
T |
Temperature, ℃ |
|
Te |
Exhaust Air Temperature, ℃ |
|
To |
Outdoor air temperature, ℃ |
|
Trd |
Room air temperature design (℃) |
|
Ts |
Supply air temperature ℃ |
|
Vx |
Local air speed, m/s |
|
Vroom |
Volume of office room, m3 |
|
Greek letters |
|
|
η |
The percentage of the cooling load covered by chilled ceiling to the total cooling load |
|
RH |
Relative humidity,% |
|
ρ |
Air density, kg/m |
|
$\tau$ |
Mean age of air |
|
t |
Time constant, s |
|
ɳa |
Air exchange efficiency |
|
ɳD |
Occupant Air exchange efficiency |
|
ΔT |
Temperature difference, ℃ |
|
Abbreviations |
|
|
ACH |
Air Change per hour |
|
ADPI |
Air Distribution Performance Index |
|
ASHRAE |
American Society for Heating, Refrigeration, and Air Conditioning Engineers |
|
ATD |
Air terminal device |
|
CFD |
Computational Fluid Dynamics |
|
CC |
Chilled ceiling |
|
EDT |
Effective Draft Temperature |
|
IAQ |
Indoor air quality |
|
MV |
Mixing Ventilation |
|
PV |
Personal Ventilation |
|
PAQ |
Perceived air quality |
|
Sub-Scripts |
|
|
rd |
Room design |
|
e |
External |
|
f |
Floor |
|
hf |
Head to foot level |
|
i |
Location |
|
n |
Nominal time constant |
|
o |
Outdoor |
|
oe |
Occupants and equipment |
|
S |
Supply |
|
P |
Person |
|
x |
Local |
|
D |
Density of occupant |
[1] Seppanen, O., Fisk, W., Mendell, M. (2002). Ventilation rates and health. Ashrae Journal-American Society of Heating Refrigerating and Air-Conditioning Engineers, 4(8): 56-58.
[2] Seppanen, O., Fisk, W. (2006). Some quantitative relations between indoor environmental quality and work performance or health. HVAC&R Res, 12(4): 957-973. https://escholarship.org/uc/item/80v061jx
[3] Lipczynska, A., Kaczmarczyk, J., Melikov, A.K. (2015). Thermal environment and air quality in office with personalized ventilation combined with chilled ceiling. Building and Environment, 92: 603-614. http://dx.doi.org/10.1016/j.buildenv.2015.05.035
[4] Harris, E. (1858). Ventilation in American Dwellings. Viley & Halsted. https://lccn.loc.gov/08013404
[5] Billington, N.S., Roberts, B.M. (1982). Building services engineering: A review of Its Development, pp. 413-425.
[6] Haghighat, F. (2009). Thermal comfort in housing and thermal environments. Sustainable Built Environment, 1: 22.
[7] Seppänen, O. (2008). Ventilation strategies for good indoor air quality and energy efficiency. International Journal of Ventilation, 6(4): 297-306. https://doi.org/10.1080/14733315.2008.11683785
[8] Li, Y., Leung, G.M., Tang, J.W., Yang, X., Chao, C.Y., Lin, J.Z., Yuen, P.L. (2007). Role of ventilation in airborne transmission of infectious agents in the built environment-a multidisciplinary systematic review. Indoor Air, 17(1): 2-18. https://doi.org/10.1111/j.1600-0668.2006.00445.x
[9] Clements, C.D.J. (1975). Air conditioning and Ventilation of Buildings. Pergamon Press.
[10] Croome, D.J., Roberts, B.M. (1981). Air conditioning and ventilation of buildings. William Clowes (Beccles) Limited,Beccles and London.
[11] Kaczmarczyk, J., Melikov, A., Fanger, P.O. (2004). Human response to personalized ventilation and mixing ventilation. Indoor Air, 14: 17-29. https://doi.org/10.1111/j.1600-0668.2004.00300.x
[12] Babiak, J., Olesen, B.W. (2013). Low temperature heating and high temperature cooling federation of european heating and air conditioning associations. Federation of European Heating, Ventilation and Air Conditioning Associations REHVA, Brussels.
[13] Chakroun, W., Ghaddar, N., Ghali, K. (2011). Chilled ceiling and displacement ventilation aided with personalized evaporative cooler. Energy and Buildings, 43(11): 3250-3257. http://dx.doi.org/10.1016/j.enbuild.2011.08.026
[14] Mirzai, S., Ghaddar, N., Ghali, K., Keblawi, A. (2015). Design charts for sizing CC/DV system aided with personalized evaporative cooler to the desired thermal comfort. Energy and Buildings, 86: 203-213. https://doi.org/10.1016/j.enbuild.2014.09.084
[15] Halvonová, B., Melikov, A.K. (2010). Performance of ductless personalized ventilation in conjunction with displacement ventilation: impact of workstations layout and partitions. HVAC&R Research, 16(1): 75-94. https://doi.org/10.1111/ina.12672
[16] Schiavon, S., Melikov, A.K., Sekhar, C. (2010). Energy analysis of the personalized ventilation system in hot and humid climates. Energy and Buildings, 42(5): 699-707. https://doi.org/10.1016/j.enbuild.2009.11.009
[17] Hodder, S.G., Loveday, D.L., Parsons, K.C., Taki, A.H. (1998). Thermal comfort in chilled ceiling and displacement ventilation environments: vertical radiant temperature asymmetry effects. Energy and Buildings, 27(2): 167-173. https://doi.org/10.1016/S0378-7788(97)00038-8
[18] ASHRAE Fundamentals Handbook. 2013.
[19] EN 15251. Indoor environmental input parameters for design and assessment of energy performance of buildings addressing indoor air quality, thermal environment, lighting and acoustics. European Committee for Standardization, Brussels, 2007.
[20] EN ISO 7730. (2007) Ergonomics of the Thermal Environment – Analytical Determination and Interpretation of Thermal Comfort Using Calculation of the PMV and PPD Indices and Local Thermal Comfort Criteria, European Committee for Standardization, Brussels,2005.
[21] ASHRAE handbook (2012). and Air- Conditioning Systems and Equipment (I-P Edition), 871. D. Müller, C. Kandzia, R. Kosonen, A. Melikov, P. Nielsen (2013). Mixing Ventilation - Guidebook on Mixing Air Distribution Design, Federation of European Heating, Ventilation and Air Conditioning Associations, Finland.
[22] Hao, X., Zhang, G., Chen, Y., Zou, S., Moschandreas, D. (2007). A combined system of chilled ceiling, displacement ventilation and desiccant dehumidification. Building and Environment, 42(9): 3298-3308. http://dx.doi.org/10.1016/j.buildenv.2006.08.020
[23] Fluent Inc. Airpak(3.0.16). User's Guide. Fluent Inc; 2007.
[24] Cao, G., Awbi, H., Yao, R., Fan, Y., Sirén, K., Kosonen R., Zhang J. (2014). A review of the performance of different ventilation and airflow distribution systems in buildings. Building and Environment, 73: 171-186. https://doi.org/10.1016/j.buildenv.2013.12.009
[25] Roulet, C.A. (2012). Ventilation and airflow in buildings: Methods for diagnosis and evaluation. https://doi.org/10.4324/9781849773713
[26] Chen, Q. (1995). Comparison of different k-ε models for indoor air flow computations. Numerical Heat Transfer Part B Fundamentals, 28(3): 353-369. https://doi.org/10.1080/10407799508928838
[27] Zhao, B., Li, X., Li, D., Yang, J. (2012). Revised air-exchange efficiency considering occupant distribution in ventilated rooms. Air and Waste Management, 53: 759–763. https://doi.org/10.1080/10473289.2003.10466215
[28] ASHRAE. Standard 55 (2019). Thermal environmental conditions for human occupancy American Society of Heating, Refrigerating and Air-Conditioning Engineers. https://www.ashrae.org/technical resources/bookstore/standard-55-thermal environmental-conditionsfor- human-occupancy.
[29] Assaad, D.A., Ghali, K., Ghaddar, N., Habchi, C. (2018). Effectiveness of intermittent personalized ventilation assisting a chilled ceiling for enhanced thermal comfort and acceptable indoor air quality. Building and Environment, 144: 9-22. http://dx.doi.org/10.1016/j.buildenv.2018.08.005