Andriyanto Setyawan* | Hafid Najmudin | Apip Badarudin | Cecep Sunardi
© 2022 IIETA. This article is published by IIETA and is licensed under the CC BY 4.0 license (http://creativecommons.org/licenses/by/4.0/).
OPEN ACCESS
An experimental investigation on the performance of an air conditioner and its operating conditions under constant outdoor moisture content and varied dry-bulb temperature has been accomplished. The test was conducted on an air conditioner using R32 with a nominal cooling capacity of 2.6 kW and the test was carried out in a controlled and standardized test room. During the test, the outdoor temperature was varied from 24 to 36℃ while maintaining the humidity ratio at 14.9 kg vapor per 1 kg of dry air. The indoor compartment was maintained at 27℃ dry-bulb temperature and 19℃ wet-bulb temperature. Generally, as the temperature of outdoor air increases by 1℃, the input power increases by 1.4%, the cooling capacity decreases by 0.9%, and the coefficient of performance decreases by 1.95%. In addition, the outdoor air temperature has a more significant effect on the refrigerant discharge and liquid line temperature than that of refrigerant suction temperature.
cooling capacity, COP, outdoor air temperature, power consumption
Global warming, as indicated by the increase of air temperature near the earth surface, has been studied extensively for decades. The greenhouse effect is considered as the main cause that responsible for the increase of global temperature. As reported by the Intergovernmental Panel on Climate Change (IPCC), the mean global temperature is predicted to increase in the range of 1.0 to 3.5℃ by 2100, depending on the scenarios related to the emissions that cause the greenhouse effect [1]. Global warming also impacts to the increase of cooling degree days (CDD) up to 54.1% in 2050s and 83.0% in 2080s in major cities in India [2]. A study in Singapore reported that climate change would increase the air temperature by 2.2 to 3.8℃ at the rural area in Singapore [3]. Refrigeration system has a significant contribution in global warming, including system with hydrofluorocarbon-based refrigerant [4]. In addition to global warming, the CO2 concentration could reach 570-750 ppm [5].
The presence of global warming could also affect the demand for cooling. It was predicted that the need of household air conditioner (AC) in the US increases up to 8% [6]. It is also predicted that 2/3 of households in the world will be equipped by air conditioners in 2050, in which half of the total number of air conditioners can be found in China, India, and Indonesia [7]. The International Energy Agency also forecasts that the global number of air conditioners could reach 5.5 billion and the number of household refrigerator will also increase to more than 2 billion in 2050 [8]. Globally, the electricity demand for cooling was about 10% of total electricity demand in 2016. This demand was projected to triple by 2050. Minimum energy performance standards (MEPS) for air conditioners are therefore needed to anticipate the high demand of electricity for space cooling [9]. Tropical area usually requires more energy than other areas when its environmental temperature increases [10]. For a smaller region such as ASEAN (the Association of Southeast Asian Nations), the electricity consumption for space cooling was reported at 80 TWh in 2020 and projected to reach 300 TWh in 2040 [11].
Higher environmental air temperature has a harmful effect on the performance of an air conditioner. Under high outdoor air temperature, the ability of condenser to reject heat decreases and resulting a high condensing pressure. This causes the higher work of compression to overcome the high pressure difference across evaporator and condenser. In addition, at higher condensation pressure, the suction pressure increases slightly. This increases the mass density of the refrigerant and increases the power required by the compressor to compress the refrigerant.
High condensing pressure due to the higher outdoor air temperature is indicated by the higher discharge and condensing temperature. A study with R-417A and R-422D as possible substitutes for R-22 was carried out at different environmental air temperature from 24 to 33℃ [12]. It was observed that the variation of environmental temperature resulted in the variation of discharge temperature from about 83 to 92℃ when R-22 was used. An increase in condensing temperature with increasing ambient temperature was also reported from experiments using R22 and its substitutes R290, R407C and R410A in 2 TR air conditioners [13]. An increase in condensing temperature was observed for all refrigerants when the ambient temperature was changed from 35℃ to 55℃. Due to the rise in ambient air temperature, power consumption increased, cooling capacity decreased, and COP (coefficient of performance) decreased. An experimental study by varying environmental air temperature from 29 to 43℃ in a 2.64 kW air conditioner resulted in the increase of condensing temperature from 42 to 50℃ [14]. Other results of this study are a 36% increase in power consumption, a 32% reduction in cooling capacity, and a 45% reduction in COP.
The effect of weather variation on the performance of split-ducted air conditioners from 2020 to 2080 in an office building Malaysia has been studied [15]. It was reported that every 1℃ increase of outdoor air temperature causes 2% reduction of cooling capacity and COP (coefficient of performance). A weather simulation was accomplished to produce the monthly average ambient air temperature in 2020, 2050, and 2080. From this study, it can be concluded that the performance degradation of the air conditioners is faster in the period of 2050 to 2080 than that of 2020 to 2050. The faster decrease of air conditioner performance is mainly caused by the higher ambient temperature increase in 2050 to 2080. The effect of the environmental condition on the COP of supermarket refrigeration system has also been studied [16]. Here, the performance depends on the month that reflects the temperature of outside air.
An experiment by varying ambient temperature from 30 to 50℃ in a window air conditioner employing 4-circuit and 8-circuit condenser has been carried out using refrigerant R407C [17]. As the ambient temperature increases, the condenser heat rejection decreases by about 9.5% and COP decreases by 16%. By varying refrigerant charge and ambient temperature, Yusof et al. [18] reported the similar results for all level of charges, i.e., the decrease of COP. Through an experiment by varying the outdoor air temperature from 35 to 41℃, Oruç et al. [19] reported a decrease of cooling capacity by an average of 15.5% and an increase of input power by about 3.9%. This experiment was accomplished by using five different refrigerants, i.e., R22, R422A, R422D, R417A, and R424A. An increase of discharge temperature in the range of 2 to 15℃ was also revealed, depending on the refrigerant. Another important finding from this experiment is the increase of compression ratio by averagely 10.5% with the increase of the outside air dry-bulb temperature (DBT). A slight decrease of compressor capacity has also been found with the increase of ambient air temperature. This data was obtained from an experiment with R22, R417A, and R424A [20]. Tarish et al. [21] reported a wide variation in condenser capacity, COP, and cooling capacity due to the variation of outside air DBT. They used EES software to analyze a split air conditioning unit in terms of exergy and thermal performance. In this test the outdoor and indoor temperatures were varied from 30-55℃ and 17-27℃, respectively. This study used temperature and humidity data of six cities in Iraq. The advantages of R-161 when operated under the same conditions have also been highlighted.
Under constant relative humidity at 50%, Mitrakusuma et al. [22] conducted an experiment to test the performance of an air conditioner by varying the outdoor DBT from 24 to 38℃. This study was carried out using refrigerant R32 with a cooling capacity of 2.6 kW. The study reported that the power drawn by the compressor increased by 1.6% if outside temperature increases by 1℃. Also, for every 1℃ increase in outside air temperature, the energy efficiency ratio and cooling capacity were reduced by 2.1% and 1.0%, respectively. Another study was carried out by varying ambient air DBT (dry-bulb temperature) and maintaining outdoor WBT (wet-bulb temperature) at a constant value [23]. From this study, for every 1℃ increase in outside temperature, the input power increased by 1.4%, cooling capacity decreased by 0.8%, and COP decreased by 2.0%. Unlike the variation of outside air DBT, the outdoor air humidity does not significantly affect the capacity and COP of the unit [24]. The capacity, input power, and COP were constant in an experiment with constant outside air DBT, even though the RH (relative humidity) was varied from 40 to 70%.
In conjunction with the increase of outside air DBT, the presence of outdoor wind and obstruction around the condenser has the similar effect on the performance of an air conditioner. By varying the direction of wind to the condenser outlet by 30, 45, 60, and 90° at a velocity of 6.5 m/s, Setyawan [25] reported an increase of condensing temperature from 50.9 to 55.3℃, in which the 90° direction (perpendicular to condenser outlet) has the most significant effect. This study also noted that the power consumption increased by 10.2%, while the capacity and energy efficiency reduced by 7.9% and 16.5%, respectively. Similar to the high outdoor air DBT, the presence of condenser obstruction decreases the capacity and COP of an air conditioner [26]. The effect has been experimentally investigated by installing airflow barriers in front and side of condenser.
Many techniques have been studied and implemented to minimize the harmful effect of high ambient air temperature. One of the most popular methods is by utilizing evaporative cooler. The use of cold mist water evaporative cooler in an air-cooled chiller has been experimentally investigated by injecting the mist water in the condenser air stream. This method could improve the COP in the range of 56 to 91% than that of conventional evaporative cooler [27]. An application of evaporative cooler in a window air conditioner has also been studied by applying evaporative cooler media made from grass to decrease the outside air DBT before entering the condenser. This technique can reduce the power consumption up to 13% and improve the COP up to 18% [28]. By using evaporative pads to reduce the condenser air temperature, Martinez et al. [29] reported a reduction of input power by 11.4%, an improvement of cooling capacity by 1.8%, and an increase of COP by 10.6%. The use of condensate water from the evaporator as a precooler for condenser air has also been studied [30]. This technique could improve the COP by about 21.4% and reduce the power consumption by up to 6%.
Apart from evaporative cooling, the improvement of air conditioner performance could also be made by using nanoparticles [31], increase subcooling [32], and ejector [33]. The use of condensate to increase the liquid refrigerant subcooling has been investigated and proven to improve the COP by 16.4% and reduce the power consumption by 5.9% [34]. By replacing the expansion device with ejector, a decrease of exergy loss from an experiment with R290 air conditioner was reported [35].
Studies to evaluate the effect of outdoor air temperature has been extensively carried out for decades. However, no specific research study on the performance of an air conditioner at constant moisture content of outdoor air has been published yet. This article discusses the performance evaluation of a split air conditioning unit at various outside air DBT and constant outdoor moisture content.
In this experiment, an air conditioner using R32 with a nominal cooling capacity of 2.64 kW or 9000 Btu/hr and compressor nominal capacity of 1 HP was tested in a controlled test facility. R32 or difluoromethane is a refrigerant from a group of HFC (hydrofluorocarbons) refrigerant. It was chosen in this experiment because it has a low GWP (global warming potential) and zero ODP (ozone depleting potential). Due to its superior characteristics, this refrigerant is now used as a substitute for refrigerant R22 and R410A.
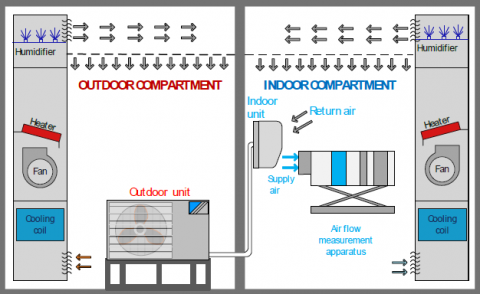
The outdoor unit of the air conditioner (comprises of compressor and condenser) was installed at a controlled room called as outdoor compartment while the indoor unit (evaporator) was installed in an indoor compartment according to ISO 5151-2017 for testing and rating of non-ducted heat pump or air conditioner. A standard cooling capacity rating for moderate climates, usually designated by T1 Standard Rating Condition, was used. During the test, the outdoor compartment was maintained at constant humidity ratio (or specific humidity) of 14.9 g water vapor per kg of dry air while the dry-bulb temperature was varied from 24 to 38℃. The indoor compartment was conditioned at dry-bulb temperature of 27℃ and wet-bulb temperature of 19℃. The sketch of the test chamber is presented in Figure 1 and the air conditions at the outdoor and indoor compartments are summarized in Table 1. Symbol tdb denotes the dry-bulb temperature, W denotes the specific humidity, and twb represents the wet-bulb temperature.
Figure 1. Air conditioner test room sketch. The indoor compartment was maintained at 27℃ DB/19℃ WBT while the outdoor compartment temperature changed from 24 - 38℃ at a constant specific humidity of 14.9 g/kg
Table 1. Setting of outdoor and indoor conditions for experiment
|
No |
Outdoor conditions |
Indoor condition |
||||
|
tdb (℃) |
W (g/kg) |
twb (℃) |
tdb (℃) |
W (g/kg) |
twb (℃) |
|
|
1 |
24 |
14.9 |
20.3 |
27 |
11.82 |
19 |
|
2 |
26 |
14.9 |
20.9 |
27 |
11.82 |
19 |
|
3 |
28 |
14.9 |
21.5 |
27 |
11.82 |
19 |
|
4 |
30 |
14.9 |
22.0 |
27 |
11.82 |
19 |
|
5 |
32 |
14.9 |
22.6 |
27 |
11.82 |
19 |
|
6 |
34 |
14.9 |
23.2 |
27 |
11.82 |
19 |
|
7 |
36 |
14.9 |
23.6 |
27 |
11.82 |
19 |
|
8 |
38 |
14.9 |
24.3 |
27 |
11.82 |
19 |
Heater, cooling coil, and humidifier in both outdoor and indoor compartments are used to maintain the compartments in the desired conditions. A heater can be used to increase the temperature of the compartment if the temperature is below set point. When the compartment is considered too hot and too humid, the cooling coil decreases the temperature and humidity of the compartment. The humidifier is used when the compartment is too dry below the set point.
In this experiment, various parameters were measured to obtain the COP (coefficient of performance) and cooling capacity of the tested air conditioner. The COP is defined as the ratio of the cooling provided by the refrigeration system to the work needed to operate the air conditioner. In the other words, COP is the ratio of heat removed from the cold side reservoir to the mechanical work provided. For an air conditioner, the cooling capacity is defined as the ability of the evaporator to remove heat from a room. As the unit of the cooling capacity is kW and the work provided to operate the air conditioner is also indicated by kW, the COP is expressed without units. Electrical parameters, such as current, voltage, and power were measured to obtain the power required to operate the air conditioner. The thermal performance of the AC unit was calculated based on the DBT and WBT of the air entering and leaving the AC evaporator, the volumetric air flow across the evaporator, and quantity of water vapor condensed in the evaporator.
From the measurement of the condition of air entering and leaving the evaporator, the enthalpy of the entering air (hea) and leaving air (hla) can be determined. The enthalpy difference is then used to calculate of the air conditioner cooling capacity by using:
$q_e=\dot{m}\left(h_{e a}-h_{l a}\right)$ (1)
Here, qe denotes the cooling capacity and $\dot{m}$ denotes the air mass flow rate in the evaporator.
To calculate the mass flow rate, the following relation is used:
$\dot{m}=\rho Q$ (2)
where, ρ represents the average density of air across the evaporator and Q is the volumetric flow rate. The last parameter can be measured using air flow measurement apparatus installed in the compartment. Basically, the volumetric flow can be obtained by measuring the average velocity and cross-sectional area of the channel in the air flow measurement apparatus.
By combining Eqns. (1) and (2), the cooling capacity can be calculated using:
$q_e=\rho Q\left(h_{e a}-h_{l a}\right)$ (3)
For this experiment, the following equation can be used for calculating the cooling capacity:
$q_e=\frac{Q\left(h_{e a}-h_{l a}\right)}{v_{d a}}$ (4)
where, νda denotes the specific volume of dry air of the mixture of air and water vapor.
In term of specific volume of air and vapor mixture, Eq. (4) can be written as:
$q_e=\frac{Q\left(h_{e a}-h_{l a}\right)}{v_{d a}^{\prime}(1+W)}$ (5)
Here, $v_{d a}^{\prime}$ is the specific volume of air and water vapor mixture and W denotes the specific humidity of moist air.
The total cooling capacity comprises of two components, sensible (qs) and latent cooling capacity (ql).
$q_e=q_s+q_l$ (6)
where,
$q_s=\frac{Q\left(c_{p a 1} t_{a 1}-c_{p a 2} t_{a 2}\right)}{v_{d a}}=\frac{Q\left(c_{p a 1} t_{a 1}-c_{p a 2} t_{a 2}\right)}{v_{d a}^{\prime}(1+W)}$ (7)
$q_l=\frac{L Q\left(W_{i 1}-W_{i 2}\right)}{v_{d a}}=\frac{L Q\left(W_{i 1}-W_{i 2}\right)}{v_{d a}^{\prime}(1+W)}$ (8)
In Eqns. (7) and (8) L denotes the latent heat of evaporation of water, Wi1 and Wi2 denote the specific humidity of air entering and leaving the evaporator, respectively.
The coefficient of performance (COP) and energy efficiency ratio (EER) of the air conditioner can be calculated using the following equations:
$C O P=\frac{q_e(k W)}{P_i(k W)}$ (9)
and
$E E R=3.412 \frac{q_e(B t u / h r)}{P_{\text {in }}(W)}$ (10)
COP measures the performance of air conditioning in term of ratio of thermal cooling capacity in kW per power required in kW. Meanwhile, the EER measures the performance of the air conditioner in term of ratio of cooling capacity in Btu/hr per input power in kW. In this study, the electrical input power was directly measured using a power meter. Meanwhile, the cooling capacity was determined using Eqns. (1) to (8). These equations can be solved using the data of dry bulb and wet bulb temperature of supply and return air and the air mass flow rate across the evaporator. In Eq. (10), the coefficient 3.412 expresses the conversion of Watt to Btu/hr.
This section describes the performance of the tested air conditioner in terms of COP, cooling capacity, and power consumption. The operating conditions of the refrigeration unit of the air conditioner are also examined to enrich the discussion in this section. The parameter discussed for the operating conditions are suction temperature, discharge temperature, suction pressure, discharge pressure, condensation temperature, and compression ratio. All data presented in this section were taken at stable operating conditions of the tested air conditioner.
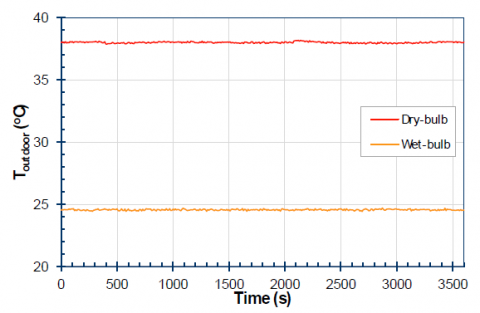
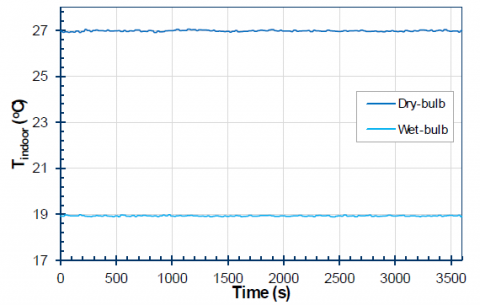
As mentioned in Section 2, the conditions of the compartments were maintained according to the temperature setting as summarized in Table 1. The data samples of temperature for outdoor and indoor compartments are presented in Figure 2. In this figure, the dry-bulb and wet-bulb temperature for outdoor temperature setting of 38℃/24.1℃ and indoor temperature setting of 27℃/19℃ are presented.
3.1 Suction and discharge temperature
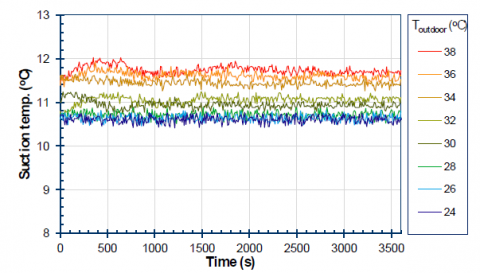
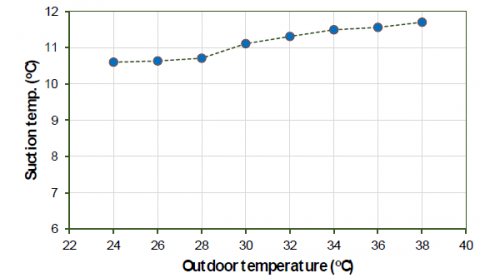
The profile of suction temperature is presented in Figure 3. Figure 3(a) shows the change in suction temperature with time, while the effect of the outside air DBT on the suction temperature is summarized in in Figure 3(b).
The lowest outside air DBT (24℃) results in the temperature at suction line of 10.6℃ while the highest outdoor temperature (38℃) results in the average suction temperature of 11.73℃. The difference of the suction temperature is, therefore, only about 1.1℃ for the lowest to the highest outdoor DBT. Here, the outside air DBT has no significant effect on the suction temperature.
(a) Outdoor compartment
(b) Indoor compartment
Figure 2. Samples of dry-bulb and wet-bulb temperature at the experiment using outdoor temperature of 38℃
(a) Suction temperature vs time
(b) Suction temperature vs outdoor DBT
Figure 3. Data for the experiments with outdoor air temperature varied from 24 to 38℃
Using linear approximation, each 1℃ of the increase in outside air DBT, the suction temperature only increases by approximately 0.09℃. The expression of the effect of change of outside air DBT at constant humidity ratio on the suction temperature can be expressed as:
$t_{\text {suct }}=0.0886 t_{o a, d b}+8.3912$ (11)
where, tsuct expresses the refrigerant suction temperature and toa,db denotes the outdoor dry-bulb temperature. The linear trend of the suction temperature with the outdoor air temperature has a correlation coefficient (R-square) of 0.957. It means that the dependence of suction temperature on the outdoor air temperature can be expressed in a linear equation with a strong correlation.
For a comparison, the similar range of suction temperature from 10.52℃ to 11.62℃ were reported for an experiment with varied DBT and constant WBT [23]. This increases the suction temperature by about 0.1℃ for each 1℃ of the increase of outside air DBT. Another experiment with varied dry-bulb temperature from 24 to 38℃ and constant relative humidity of 50% also resulted in the similar range of suction temperature 10.36℃ to 11.46℃ [22]. It provides the increase of the suction temperature by by 0.081℃ per 1℃ of the increase of outside air DBT under constant relative humidity. Meanwhile, Joudi and Al-Amir [13] informed that the suction temperature increases by 0.06℃ if the outside air temperature increase by 1℃. This data was obtained from their experiment using R22. A Less significant effect of outside air temperature was found for experiment using R290 and R407C.
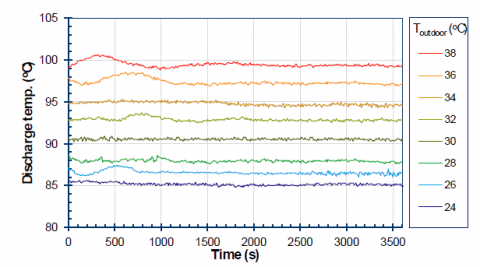
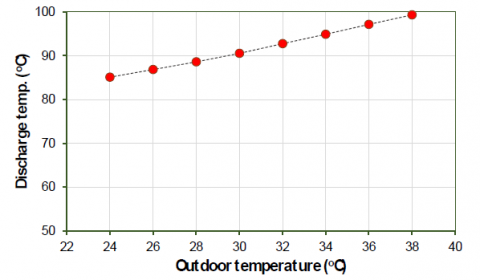
(a) Discharge temperature vs time
(b) Discharge temperature vs outdoor DBT
Figure 4. Profile of discharge temperature
On the other hand, the discharge pressure is significantly affected by the outside air DBT (Figure 4). The average discharge temperature is in the range of 85.1℃ for outdoor temperature of 24℃ to 99.4℃ for outdoor temperature of 38℃. The difference of discharge temperature reaches 14.3℃ for the same range of outside air DBT variation. Averagely, an increase of discharge temperature by about 1.03℃ was noted per 1℃ increase of outside air DBT. The correlation of the discharge and the outside air DBT can be expressed as:
$t_{d i s c}=1.026 t_{o a, d b}+60.1$ (12)
where, tdisc is the refrigerant discharge temperature.
The range of discharge temperature of 85.10℃ to 99.98℃ was reported in an experiment under constant relative humidity and varied DBT of outside air [22]. It means that the increase of outside air DBT by 1℃ causes the increase of discharge temperature by 1.08℃. Meanwhile, experiment with varied outdoor air DBT under constant WBT caused the discharge temperature increase by 0.97℃ per 1℃ change of outdoor air DBT [23]. The range of discharge temperature for this experiment was reported to be 88.4 to 96.7℃. Another experiment with R424A with outdoor air DBT range from 25 to 35℃ showed that the discharge temperature increases from 58.6 to 67.5℃ [19]. This means that the discharge temperature increases by 0.89℃ for every 1℃ increase of outside air DBT. The similar effect of ambient temperature on the discharge temperature has also been confirmed for refrigeration machine [36]. A range of discharge temperature from 77 to 87℃ was reported when the fridge was operated at ambient temperature range from 19 to 25℃.
3.2 Suction and discharge temperature
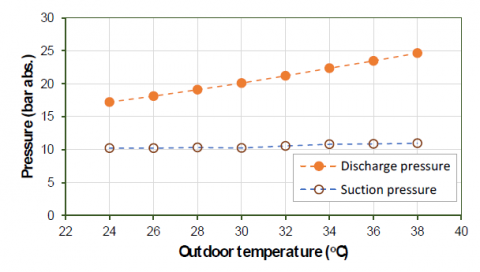
The increase of suction and discharge temperature of refrigerant cause the increase of suction and discharge pressure. In this experiment, the suction pressure was measured at 1021 to 1095 kPa (10.21-10.95 bar) while the discharge pressure was measured at 1721 to 2466 kPa (17.21-24-66 bar) (Figure 5). If a linear approximation is used, the increase of outside air DBT 1℃ causes the increase of suction pressure by 0.0601 bar and discharge pressure by 0.5348 bar. The expressions for suction and discharge pressure (in bar) as a function of outdoor air DBT for this experiment can be written as:
$P_{\text {suct }}=0.0601 t_{o a, d b}+8.6513$ (13)
$P_{\text {disc }}=0.5348 t_{o a, d b}+4.1993$ (14)
Here, Psuct and Pdisc denote the suction and discharge pressure in bar.
Figure 5. Suction and discharge pressure vs outdoor DBT
Again, the outside air DBT significantly affects the discharge pressure than that of the suction pressure. Experiment with the same cooling capacity, same refrigerant, and similar outside air DBT range under constant relative humidity of 50% resulted in the range of suction and discharge pressure of 10.10 to 11.32 bar and 19.52 to 28.18 bar, respectively. The compression ratio (ratio of discharge pressure and suction pressure) of this experiment is in the range of 1.69 to 2.25. This range is similar to the previous experiment with the range of compression ratio from 1.94 to 2.49 [22]. Experiment with R417A resulted in the increase of suction pressure by 13.1% (from about 5.8 bar to 6.56 bar) and discharge pressure by 15.7% (from about 26.5 bar to 30.5 bar) when the outside air DBT was varied from 35 to 51.5℃ [37]. This gives the pressure ratio range from 4.6 to 4.84. Using higher range of outside air DBT (35 to 55℃), Joudi and Amir [13] reported a variation of pressure ratio from 4.22 to 4.75. The higher compression ratio is caused by the higher condensing pressure needed to condensate vapor refrigerant in the condenser at high outside air DBT.
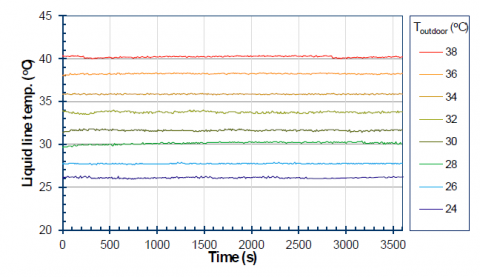
3.3 Liquid line
Measured at the condenser outlet, this parameter represents the temperature of liquid refrigerant after condensation in the condenser. The profile of liquid line temperature can be seen in Figure 6. At outdoor DBT of 38℃ the average liquid refrigerant temperature is 40.21℃. The average liquid line temperature decreases to 38.24℃, 35.86℃, and 33.72℃ when the outside air DBT decreases to 36℃, 34℃, and 32℃, respectively. When the outside air DBT was reduced to 30℃, 28℃, and 26℃ liquid line temperature decreased to 31.80℃, 30.15℃, and 27.74℃, respectively. The lowest outside air DBT gives the liquid line temperature of 25.59℃. Averagely, the liquid line temperature is 1.92℃ higher than that of outdoor air. By a linear interpolation, for every 1℃ rise in outside air DBT, the temperature of liquid line rises 1.014℃. The relation between the outside air DBT (toa, db) and the temperature of refrigerant in the liquid line (tll) can be expressed as:
$t_{l l}=1.0139 t_{o a, d b}+1.2863$ (15)
Figure 6. Liquid refrigerant temperature data for various outdoor DBT
Previous experiment with varied outside air DBT from 24℃ to 36℃ at constant wet-bulb temperature of 22℃ resulted in the variation of liquid line temperature from 25.6℃ to 37.7℃ [23]. For every 1°C rise in outside air DBT, the temperature of refrigerant in the liquid line rises 1.01°C, similar to that of present work. Meanwhile, experiment by varying outside air DBT 24℃ to 38℃ at constant relative humidity of 50% gave a range of condensing temperature from 30.49℃ to 45.36℃ [22]. It should be noted that the liquid line temperature is not equal to the condensing temperature. Subcooling may occurs in the refrigerant at the liquid line measuring point. Therefore, the condensing temperature will be higher than that of liquid line temperature. Another experiment under high ambient temperature from 35℃ to 55℃ resulted in the condensing temperature range of 43℃ to 53℃, 52℃ to 59℃, and 56℃ to 63℃ for R290, R407C, and R22, respectively [13].
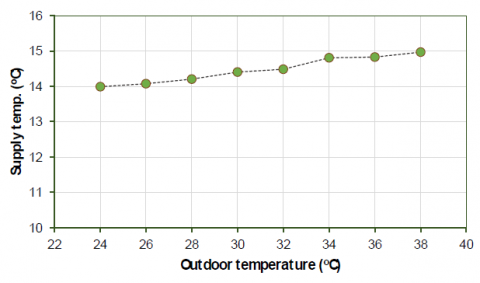
3.4 Supply air temperature
This parameter represents the air temperature after being cooled by the evaporator and it was measured at the evaporator outlet. Generally, the lower supply air temperature gives the higher cooling capacity. As in refrigerant suction temperature, the supply air temperature slightly increases with the increase of outside air DBT. In this experiment, a range of supply air temperature of 14.0℃ to 14.97℃ was resulted. The lower outside air DBT gives the lower supply air temperature. By examining Figure 7, it is clear that the outside air DBT has a less significant effect on the temperature supply air, as indicated by its slope. A difference of 14℃ of outside air DBT only results in the difference of supply air temperature of 0.7℃. By using a linear interpolation, every 1℃ increase in outside air DBT provides 0.074℃ increase in supply air temperature. The relation between the supply air temperature (tsa) and the outside air DBT for this experiment is
$t_{s a}=0.0744 t_{o a, d b}+12.164$ (16)
This linear correlation has a correlation coefficient of 0.977. It means that the supply air temperature has a strong linear correlation with outdoor air temperature.
The slight variation of supply air temperature is probably caused by the slight variation in evaporating temperature of refrigerant in the evaporator. This can be inferred from the slight variation of the suction pressure data from 10.21 to 10.95 bar absolute.
Figure 7. Supply air temperature as a function of outdoor DBT
The supply air temperature profile of the present data is in accordance with the results of experiment by varying outdoor dry-bulb temperature when the WBT is constant [23]. In this previous experiment, the rate of change of supply air temperature rises 0.068℃ if the outside air DBT rises by 1℃. The similar result was reported for an experiment by varying the outside air DBT under constant relative humidity [22]. Using higher range of outdoor temperature from 35 to 51.5℃, Elgendy et al. [37] reported an increase of supply air temperature from 14 to about 15.4℃. On average, every 1℃ increase in outside air DBT gives 0.08℃ increase of supply air temperature. This result is also in a good agreement with the current data.
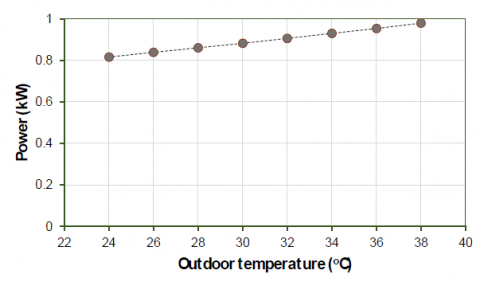
3.5 Power
An almost linear change in power consumption due to the change of the outside air DBT was revealed in this experiment. As shown in Figure 8, the power required to operate the air conditioner is about 817 kW at outside air DBT of 24℃. The power increase to 980 W when the outside air DBT increases to 38℃. In other words, every 1℃ changes in outdoor air temperature gives 11.6 W change in power consumption, or 1.43%/℃. The effect of the outside air DBT at constant humidity ratio on the power required by the air conditioner can be written as:
$P_{\text {in }}=11.6 t_{o a, d b}+535.8$ (17)
where, Pin is the input power in Watts.
Previous experiment using the same equipment under constant relative humidity resulted in the rate of change in power by 1.6% per 1℃ change in outside air DBT [22]. Meanwhile, experiment with constant WBT resulted in the rate of change in power by 1.4% per ℃ of change in outdoor air [23].
Using R417A and range of outside air DBT from 35 to 51.2℃, it was reported that the power consumption increased by 25.4% (1.57% for each 1℃ increase of in outside air DBT) [37]. Instead of in term of outside air DBT, Kumbhar et al. [38] informed that 1℃ increase in condensing temperature can cause an increase of compressor power 1.9%.
An increase of power drawn by compressor about 1.3% was noted when the outside air DBT increases 1℃ [18]. The data was obtained from an experiment using a split-type air conditioner with a nominal cooling capacity of 3.81 kW in an experiment using outside air DBT 30 to 36℃. Tarish et al. [21] reported an increase of compressor power from 1.604 kW to 3.523 kW when the outside air DBT was varied from 30 to 55℃. In this report, every increase of outside air DBT 1℃ causes the increase of compressor power 4.7%. This rate of change of power per ℃ variation of outside air DBT is higher because a constant cooling capacity was used in this experiment.
Figure 8. The power required to operate the air conditioner as a function of outside air DBT
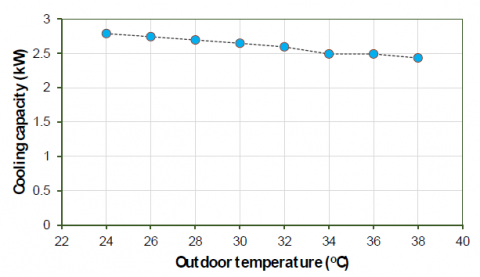
3.6 Cooling capacity
At the outside air DBT of 24℃, the cooling capacity of the tested air conditioner was recorded to be 2.79 kW. Increasing the outside air DBT to 26, 28, and 30℃ results in the drop of capacity to 2.74, 2.69, and 2.64 kW, respectively. The capacity continuously drops to 2.59, 2.49, and 2.48 kW with the increase of outside air DBT to 32, 34, and 36℃, respectively. At the hottest outside air (38℃), the cooling capacity was reduced to 2.43 kW. The profile of the cooling capacity with various outside DBT is presented in Figure 9. Detailed examination of this figure reveals that the cooling capacity decreases 12.7% when the outside air DBT increases 14℃. On average, for every 1°C increase in outside temperature, the cooling capacity decreases by 0.9%. The relationship between the cooling capacity (qe) and outside air DBT can be written in the following expression:
$q_e=26.28 t_{o a, d b}+3423.4$ (18)
Previous experiment by varying outside air DBT and constant WBT revealed that the cooling capacity decreased by 0.8% per 1℃ increase of outside air DBT [23]. Similar experiment using a constant 50% relative humidity with the varied outside air DBT reveals that the cooling capacity drops by 1% for every 1℃ increase of outside air DBT [22]. A higher decrease of capacity of 1.3% for every increase of saturated condensation temperature by 1℃ was reported by Kumbhar et al. [38]. Yau dan Pean [15] reported the highest drop of cooling capacity per degree increase of outside air DBT, i.e., 2% per ℃. In addition, experiment with R417A resulted in the decrease of cooling capacity by 39.3% when the outside air DBT increases from 35 to 51.5℃ [37]. Averagely, it gives 2.38% capacity reduction per 1℃ increase in outside air DBT. Another experiment using R424A with outside air DBT range from 35 to 41℃ resulted in the drop of cooling capacity by 11.4%. Averagely, it gives a drop of 1.9% per ℃ increase of outside air DBT [19]. Experiment with lower range of outside air DBT with the same refrigerant gives a drop of refrigeration capacity by 0.9% for each ℃ increment of outside air DBT [20]. This result is similar to the current work.
Figure 9. The cooling capacity of the air conditioner as a function of outside air DBT
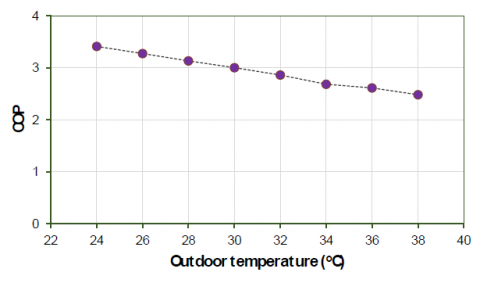
3.7 Coefficient of performance (COP)
The COP of this experiment ranges from 2.48 to 3.41. The lowest COP was resulted from experiment with the highest outside air DBT and the highest COP was obtained from the lowest outside air DBT. For the predetermined range of outside air DBT, the COP drops by 27.3% for 14℃ increase of outside air DBT. Particularly, every 1℃ increase of outside air DBT causes the decrease of COP by 1.95%. The profile of COP is depicted in Figure 10.
The COP is in a good agreement with that of experiment with varied outside air DBT and constant relative humidity [22], in which 2.1% decrease of COP was reported per 1℃ of increase of outside air DBT. The similar result for COP or EER variation of 2.28% per 1℃ change in outdoor air temperature was reported for an experiment by varying outside air DBT at constant wet-bulb temperature [23]. These COP profile as function of outdoor air temperature were confirmed by Yau and Pean [15], in which every 1℃ change in outside air DBT caused change of COP by 2%. A decrease of COP from 6.5 to 2.8 when the outside air DBT increases from 30 to 55℃ was reported by Tarish et al. [21]. Here, 25℃ increase of outside air DBT caused a decrease in COP by 67%. Averagely, every 1℃ of the increase of outside air DBT gives a decrease in COP by 2.3%. A lower rate of decrease of COP per degree Celsius change in outdoor air temperature was reported from an experiment using four and eight circuit condensers. About 17% decrease of COP was obtained for the change of outside air DBT from 30 to 50℃ [17].
Figure 10. The COP of the air conditioner as a function of outside air DBT
From the experiment with constant moisture content (14.9 g water vapor per 1 kg of dry air) and varied outside air DBT (24 to 38℃), it was revealed that the outside air DBT has a significant effect on the discharge and liquid line temperature than those of suction temperature and supply air temperature. A more significant effect on the discharge pressure rather than suction pressure has also been recorded in this experiment.
As the outside air DBT was varied from 24 to 38℃, the power consumption increases by 20% or 1.4% for every 1℃ increase of outside air DBT. For the same range of outside air DBT, the cooling capacity drops by 12.7% or 0.9% per 1℃ increment of outside DBT. It gives in the decrease of the coefficient of performance by 27.3% or 1.95% per 1℃.
The authors thank to (1) The Ministry of Education, Culture, Research, and Technology, (2) Politeknik Negeri Bandung, Indonesia, and (3) Balai Besar Bahan dan Barang Teknik Bandung, Indonesia, for the kind supports during the experiment and preparation of this paper.
|
COP |
coefficient of performance (-) |
|
|
cp |
specific heat (kJ kg-1 ℃-1) |
|
|
DBT |
dry-bulb temperature (℃) |
|
|
EER |
energy effciency ratio (Btu.hr-1W-1) |
|
|
h |
enthalpy (kJ kg-1) |
|
|
L |
latent heat of evaporation (kJ kg-1) |
|
|
$\dot{m}$ |
mass flow rate (kg s-1) |
|
|
P |
pressure (bar) |
|
|
Pin |
input power (W) |
|
|
q |
cooling capacity (W) |
|
|
Q |
volumetric flow rate (m3 s-1) |
|
|
t |
temperature (℃) |
|
|
v |
specific volume (m3 kg) |
|
|
W |
humidity ratio/specific humidity (kg water vapor/kg dry air) |
|
|
WBT |
wet-bulb temperature (℃) |
|
|
Greek symbols |
||
|
$\rho$ |
density (kg. m-3) |
|
|
Subscripts |
||
|
$a$ |
air |
|
|
da |
dry-air |
|
|
db |
dry-bulb |
|
|
disc |
discharge |
|
|
e |
evaporator |
|
|
ea |
entering air |
|
|
in |
input |
|
|
l |
latent |
|
|
la |
leaving air |
|
|
ll |
liquid line |
|
|
s |
sensible |
|
|
suct |
suction |
|
|
wb |
wet-bulb |
|
[1] Yadav, P., Jaiswal, D.K., Sinha, R.K. (2021). Climate change: Impact on agricultural production and sustainable mitigation. In Global Climate Change, pp. 151-174. https://doi.org/10.1016/B978-0-12-822928-6.00010-1
[2] Ukey, R., Rai, A.C. (2021). Impact of global warming on heating and cooling degree days in major Indian cities. Energy and Buildings, 244: 111050. https://doi.org/10.1016/j.enbuild.2021.111050
[3] He, W., Zhang, L., Yuan, C. (2022). Future air temperature projection in high-density tropical cities based on global climate change and urbanization–A study in Singapore. Urban Climate, 42: 101115. https://doi.org/10.1016/j.uclim.2022.101115
[4] Kibria, M.T., Islam, M., Saha, B.B., Nakagawa, T., Mizuno, S. (2019). Assessment of environmental impact for air-conditioning systems in Japan using HFC based refrigerants. Evergreen, 6(3): 246-253. https://doi.org/10.5109/2349301
[5] Varotsos, C., Krapivin, V., Mkrtchyan, F., Zhou, X. (2021). On the effects of aviation on carbon-methane cycles and climate change during the period 2015-2100. Atmospheric Pollution Research, 12(1): 184-194. https://doi.org/10.1016/j.apr.2020.08.033
[6] Obringer, R., Nateghi, R., Maia-Silva, D., Mukherjee, S., Cr, V., McRoberts, D.B., Kumar, R. (2022). Implications of increasing household air conditioning use across the United States under a warming climate. Earth's Future, 10(1): e2021EF002434. https://doi.org/10.1029/2021EF002434
[7] International Energy Agency. (2018). The Future of Cooling: Opportunities for Energy-Efficient Air Conditioning. OECD Publishing.
[8] UNEP. (2018). The importance of energy efficiency in the refrigeration and heat pump sectors. Environ. Program. Brief. Note, pp. 1-15.
[9] Karali, N., Shah, N., Park, W.Y., Khanna, N., Ding, C., Lin, J., Zhou, N. (2020). Improving the energy efficiency of room air conditioners in China: Costs and benefits. Applied Energy, 258: 114023. https://doi.org/10.1016/j.apenergy.2019.114023
[10] Romitti, Y., Sue Wing, I. (2022). Heterogeneous climate change impacts on electricity demand in world cities circa mid-century. Scientific Reports, 12(1): 1-14. https://doi.org/10.1038/s41598-022-07922-w
[11] Roadmap Towards Sustainable and Energy-Efficient Space Cooling in ASEAN. (2022). Roadmap Towar. Sustain. Energy-Efficient Sp. Cool. ASEAN. https://doi.org/10.1787/2b555a7a-en.
[12] Torrella, E., Cabello, R., Sanchez, D., Larumbe, J.A., Llopis, R. (2010). On-site study of HCFC-22 substitution for HFC non-azeotropic blends (R417A, R422D) on a water chiller of a centralized HVAC system. Energy and Buildings, 42(9): 1561-1566. https://doi.org/10.1016/j.enbuild.2010.04.001
[13] Joudi, K.A., Al-Amir, Q.R. (2014). Experimental Assessment of residential split type air-conditioning systems using alternative refrigerants to R-22 at high ambient temperatures. Energy Conversion and Management, 86: 496-506. https://doi.org/10.1016/j.enconman.2014.05.036
[14] Elsayed, A.O., Hariri, A.S. (2011). Effect of condenser air flow on the performance of split air conditioner. In World Renewable Energy Congress-Sweden; 8-13 May; 2011; Linköping; Sweden, 057: 2134-2141. https://doi.org/10.3384/ecp110572134
[15] Yau, Y.H., Pean, H.L. (2014). The performance study of a split type air conditioning system in the tropics, as affected by weather. Energy and Buildings, 72: 1-7. https://doi.org/10.1016/j.enbuild.2013.12.010
[16] Islam, M., Pal, A., Kyaw, T., Saha, B.B. (2019). Study on performance and environmental impact of supermarket refrigeration system in Japan. Evergreen, 6(2): 168-176. https://doi.org/10.5109/2321014
[17] Khalifa, A.H.N., Fataj, J.J., Shaker, A.K. (2017). Performance study on a window type air conditioner condenser using alternative refrigerant R407C. Engineering Journal, 21(1): 235-243. https://doi.org/10.4186/ej.2017.21.1.235
[18] Yusof, M.H., Muslim, S.M., Suhaimi, M.F., Basrawi, M.F. (2018). The effect of refrigerant charge and outdoor temperature on the condenser and evaporator of a split-unit type air conditioner using R22 refrigerant. In MATEC Web of Conferences, 225: 02013. https://doi.org/10.1051/matecconf/201822502013
[19] Oruç, V., Devecioğlu, A.G., Berk, U., Vural, İ. (2016). Experimental comparison of the energy parameters of HFCs used as alternatives to HCFC-22 in split type air conditioners. International Journal of Refrigeration, 63: 125-132. https://doi.org/10.1016/j.ijrefrig.2015.11.004
[20] Oruc, V., Devecioğlu, A.G. (2015). Thermodynamic performance of air conditioners working with R417A and R424A as alternatives to R22. International Journal of Refrigeration, 55: 120-128. https://doi.org/10.1016/j.ijrefrig.2015.03.021
[21] Tarish, A.L., Hamzah, M.T., Jwad, W.A. (2020). Thermal and exergy analysis of optimal performance and refrigerant for an air conditioner split unit under different Iraq climatic conditions. Thermal Science and Engineering Progress, 19: 100595. https://doi.org/10.1016/j.tsep.2020.100595
[22] Mitrakusuma, W.H., Badarudin, A., Najmudin, H., Setyawan, A. (2021). Performance of split-type air conditioner under varied outdoor air temperature at constant relative humidity. Journal of Advanced Research in Fluid Mechanics and Thermal Sciences, 90(2): 42-54. https://doi.org/10.37934/arfmts.90.2.4254
[23] Setyawan, A., Susilawati, S., Sutandi, T., Najmudin, H. (2021). Performance of air conditioning unit under constant outdoor wet-bulb temperature and varied dry-bulb temperature. Journal homepage: International Journal of Heat and Technology, 39(5): 1483-1490. https://doi.org/10.18280/ijht.390510
[24] Setyawan, A., Badarudin, A. (2020). Performance of a residential air conditioning unit under constant outdoor air temperature and varied relative humidity. In IOP Conference Series: Materials Science and Engineering, 830(4): 042032. https://doi.org/10.1088/1757-899X/830/4/042032
[25] Setyawan, A. (2020). The effects of wind orientation on the performance of a split air conditioning unit. In AIP Conference Proceedings, 2248(1): 070002. https://doi.org/10.1063/5.0013163
[26] Setyawan, A. (2020). Effect of air flow obstruction in a condensing unit on split air conditioner performance. Jurnal Teknologi, 82(5): 23-30. https://doi.org/10.11113/jt.v82.14185.
[27] Kabeel, A.E., El-Samadony, Y.A.F., Khiera, M.H. (2017). Performance evaluation of energy efficient evaporatively air-cooled chiller. Applied Thermal Engineering, 122: 204-213. https://doi.org/10.1016/j.applthermaleng.2017.04.103
[28] Sawant, A.P., Agrawal, N., Nanda, P. (2012). Performance assessment of an evaporative cooling-assisted window air conditioner. International Journal of Low-Carbon Technologies, 7(2): 128-136. https://doi.org/10.1093/ijlct/ctr029
[29] Martínez, P., Ruiz, J., Cutillas, C.G., Martínez, P.J., Kaiser, A.S., Lucas, M. (2016). Experimental study on energy performance of a split air-conditioner by using variable thickness evaporative cooling pads coupled to the condenser. Appl. Therm. Eng., 105: 1041-1050. https://doi.org/10.1016/j.applthermaleng.2016.01.067
[30] Ibrahim, N.I., Al-Farayedhi, A.A., Gandhidasan, P. (2017). Experimental investigation of a vapor compression system with condenser air pre-cooling by condensate. Applied Thermal Engineering, 110: 1255-1263. https://doi.org/10.1016/j.applthermaleng.2016.09.042
[31] Gunjo, D.G., Yadav, V.K., Sinha, D.K. (2022). Performance analysis of latent heat storage systems using CuO nanoparticles. Evergr. Jt. J. Nov. Carbon Resour. Sci. Green Asia Strateg., 9(2): 292-299.
[32] Perera, U., Takata, N., Miyazaki, T., Higashi, Y., Thu, K. (2021). The exergy investigation of a mechanical vapor compression chiller for cooling using R410a. Evergreen, 8(1): 213-220. https://doi.org/10.5109/4372281
[33] Tritjahjono, R.I., Sumeru, K., Setyawan, A., Sukri, M.F. (2019). Evaluation of subcooling with liquid-suction heat exchanger on the performance of air conditioning system using R22/R410A/R290/R32 as refrigerants. Journal of Advanced Research in Fluid Mechanics and Thermal Sciences, 55(1): 1-11.
[34] Sumeru, K., Pramudantoro, T.P., Setyawan, A. (2018). Experimental investigation on the performance of residential air conditioning system using water condensate for subcooling. In MATEC Web of Conferences, 197: 08002. https://doi.org/10.1051/matecconf/201819708002
[35] Sumeru, K., Pratikto, P., Setyawan, A., Abioye, A.M. (2019). The influence of room and ambient temperatures of exergy loss in air conditioning using ejector as an expansion device with R290 as working fluid. In E3S Web of Conferences, 130: 01019. https://doi.org/10.1051/e3sconf/201913001019
[36] Olatunji, O R., Ohunakin, O.S., Adelekan, D.S. (2019). Effect of ambient temperatures on an R134a domestic refrigerator retrofitted with R600a and LPG refrigerants. Journal of Physics: Conference Series, 1378(2): 022100. https://doi.org/10.1088/1742-6596/1378/2/022100
[37] Elgendy, E., Melike, M., Fatouh, M. (2018). Experimental assessment of a split air conditioner working with R-417A under different indoor and outdoor conditions. International Journal of Refrigeration, 85: 268-281. https://doi.org/10.1016/j.ijrefrig.2017.10.005
[38] Kumbhar, A., Gulhane, N., Pandure, S. (2017). Effect of various parameters on working condition of chiller. Energy Procedia, 109: 479-486. https://doi.org/10.1016/j.egypro.2017.03.076