Atheer Raheem Abdullah | Bassim Mohammed Majel*
© 2022 IIETA. This article is published by IIETA and is licensed under the CC BY 4.0 license (http://creativecommons.org/licenses/by/4.0/).
OPEN ACCESS
Renewable energy sources are becoming more and more popular, regarding the pollution and non-sustainability of common energy sources. Photovoltaic is the most direct way to convert solar radiation into electricity using the photovoltaic effect. This technology generates direct current (DC) electrical power from semiconductors when they are illuminated by photons. This paper presents a mathematical model in CFD that simulates the thermal presentation of a solar thermal photovoltaic panel equipped with circler, square and elliptic pin fin cooling module. The effect of cooling water velocity on photovoltaic panel average temperature and average cooling water temperature has been studied and the effect of cooling water velocity on photovoltaic panel average temperature and average cooling water temperature. The results show that velocity contours for water flows in circular, elliptic and square pin fin cooling module with inlet water velocities (0.0002, 0.0004 and 0.001 m/s). It is noticed that for square pin fin, the velocity between the pins is higher than the other types of pins, which leads to more circulation of water and more cooling.
photovoltaic cell (PV), solar energy, solar thermal collectors
The growing using fossil fuel in various transference sectors, produces important attention in the global as a result of the environs contamination and worldwide warming [1]. The sun is regarded as a main resource of energy for its cleanliness and constancy, different other types of energy for example oil, coal, and derivations of oil that contaminate the environs and air.
Most researchers emphasize the significance of solar energy due to the abundance of sunshine capable of satisfying our energy wants in the next years [2]. Solar energy is the maximum plentiful renewable energy source on earth, so be the key for the rising request of worldwide energy consuming. Generally, the using of solar energy is distributed into two ways: photovoltaic (PV) and photo thermal [3]. Modules of PV are sold commercially providing with efficiency, rated power output, and other electrical features at standard test conditions (STC). These conditions are definite as trying underneath solar irradiance of 103 W.m-2 which is equal to 1 sun, pressure of 1.5 AM and ambient temperature of 25℃. Nevertheless, for the duration of process in outdoor conditions the presentation of the PV experience differences which are related with conditions of climate and industry of solar cell [4].
Cells of PV are expensive, and the PV devices features are extremely reliant on ecological circumstances. As a result, to confirm the extreme using of the obtainable solar energy via a PV power scheme, it is significant to study its performance over modeling, beforehand applying it in reality [5]. The climate is permanently varying and as many researchers are hard to plan methods to improve the effectiveness of photovoltaic panel. So, solar simulators are very useful in investigation of a solar energy. Solar simulators are a light resource providing lighting estimated to the usual sunlight. They are used for manipulating indoor of the several components and devices to evaluate, but sometimes for the study Photovoltaic cells, the cell features and presentation validation of components is attained [6].
Photovoltaic cells are affected via the temperature in a reluctant method owing to the negative temperature coefficient of crystalline silicon. The negative temperature coefficient was found to be in the choice of (0.3 to 0.65) %/℃ depending on the kinds and material utilized of the photovoltaic panel. This is directed to the production power and electrical effectiveness of the photovoltaic panel decreased [7]. A suitable control and organization of the flow rate of air circulating over the PV/T collector will be an active mean to attain this aim and to confirm a valuable use of the device for many usages along with of the seasons. Actually, usage of direct photovoltaic powering of a DC fan delivers the probability of getting a solar irradiance reliant on air flow rate [8].
As a result, PV/T-air and PV/T-water systems have been widely investigated and different kinds of configurations developed to test the overall performance of the combined system, but this research introduce new methods to enhance the heat transfer rate and reduce the panel temperature using various sections of pin fins in addition to the traditional method of cooling, which is water.
In the current work, the thermal model has been prolonged to a three-dimensional geometry and thermo-fluid dynamic equations have been resolved via a Computational Fluid Dynamic (CFD) program. The algorithm is applied in the profitable software tool ANSYS/FLUENT, which gives the benefit of studying complicated geometries, producing both unstructured and structured meshes, and of resolving thermo-fluid dynamic equations with modified source terms via a User-Defined Function (UDF), in which models of thermal and electrical have been completely coupled with the solver.
PV schemes are categorized in relation to how the components of scheme are connected to other power sources for example schemes of utility-interactive (UI) and stand-alone (SA). In a stand-alone system showed in Figure 1, the scheme is designed to run independent of the electric utility grid, and is usually planned and sized to deliver definite DC- and/or AC electrical loads [9].
Figure 1. Schematic diagram of stand-alone photovoltaic system [9]
The way Integrating concentrators with photovoltaic cells can improve the production of power and decrease the cost of photovoltaic schemes. Several solar concentrator designs were used in the previous years for different systems of photovoltaic to attain high optical effectiveness [10]. Taking into consideration the optics of the refractor and reflector the solar concentrators categorized with two kinds that is imaging and nonimaging [11, 12]. As the name defines solar concentrator with imaging improve an optical image of the sun on the objective area for example linear lenses and solar tower, whereas solar concentrators with nonimaging optics simply concentrate the sunlight on aim but don’t grow slightly presence of the sun for example compound parabolic [13].
The acceptance angle (θs) defined where the angle of incidence with respect to 90% of the extreme optical effectiveness at normal incidence [14, 15]. The supreme concentration of concentrator (CRmax) is a function of acceptance angle (θs) and the surrounded dielectric material (n) refractive index. Regularly, three dimensions concentrator are utilized in attaining great concentration via reducing the acceptance angle, nevertheless complicated apparatus for example sun tracking is essential so as to preserve the concentrator directed at the sun [16, 17]. Additionally, small acceptance angle might cause optical damages to the scheme from misalignment producing removal of the CPV scheme total presentation [18]. Figure 2 demonstrates different solar collector shapes.
Figure 2. Various designs of solar concentrators: (a) Parabolic concentrator (b) Fresnel lens (c) Central receiver scheme with reflectors. (d) Tubular receivers (e) Plane receiver (f) Asymmetric parabolic concentrator [16]
The numerical simulations permit the analysis of complex phenomena devoid of resorting to expensive prototypes and problematic investigational measurements. For the duration of the latest years, the Computational Fluid Dynamics (CFD) becomes one of the utmost powerful and suitable programs for predicting the temperature distribution and water flow behavior in environments that conditioned. Numerical modeling of heat transfer, flow, and related phenomena is of pronounced significance. With the development of computer technology, mathematical method has been recognized as the third method in scientific world, especially in the area of fluid dynamics [19]. It is an approval of the first two methods in scientific world, i.e., theoretical and investigational method.
4.1 PV panel creation of geometry
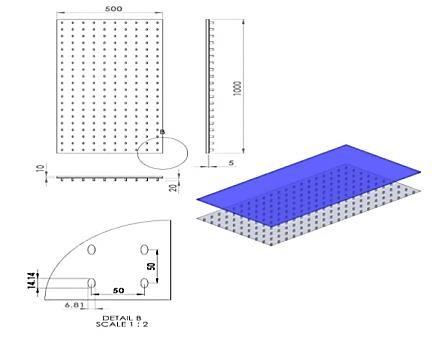
The geometry considered in the present work is a photovoltaic panel equipped with pin fin cooling module, the fins is of three shapes (square, circler and elliptic) in order to find the maximum thermal performance of a solar thermal photovoltaic panel and which of the aforementioned sections gives the highest value for the heat transfer rate. Figure 3-5 shows basic dimensions of the CAD geometry model.
Figure 3. Basic dimensions in (mm) of the panel model with square pin fin cooling module
Figure 4. Basic dimensions in (mm) of the panel model with circular pin fin cooling module
Figure 5. Basic dimensions in (mm) of the panel model with elliptic pin fin cooling module
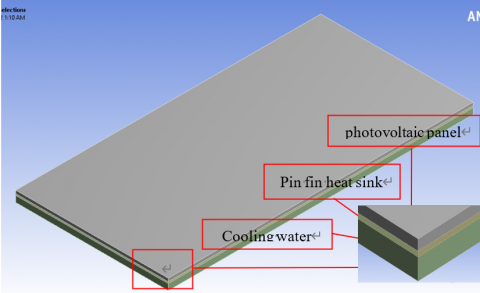
For the computational model, the geometry is produced via utilizing solid works software to build the photovoltaic panel equipped with pin fin cooling module three-dimensional solid model.
The surfaces of the model were then assigned to the subsequent sections:
a. Collector-Boundary
b. Collector-Water-Interface
c. Collector-outer
The subsequent step was to identify the fields in the model. The models in this study consisted of two material fields:
d. Solid Domain
e. Water Domain
4.2 Mesh generation
The mesh was produced by utilizing the volume meshing procedure and the choice to extrude the prism layers instantly afterward the tetra meshing had ended was chose. Three different meshes, 3.5×10⁶, 4×10⁶, and 4.5×10⁶ tested and compared in terms of panel temperature. It is found that mesh number of around 4×10⁶ gives about 1% deviation compared to mesh size of 4.5×10⁶; whereas the results from mesh number of 3.5×10⁶ deviate by up to 8% compared to those from the finest one. Therefore, a mesh of around 4×10⁶ elements was considered sufficient for the numerical investigation purposes. Standard Computational Fluid Dynamics methods need a mesh that turns the boundaries of the computational field. The production of computational mesh that is appropriate for the discretized solution of three-dimensional Navier-Stokes, continuity and energy equations has continuously been the subject of intensive researches. This type of problematic covers an extensive choice of engineering implementations.
4.3 Three- dimensional mesh generation
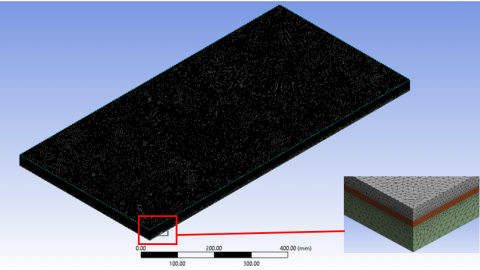
Mesh generation of solid geometry and three-dimensional models are more durable to be divided into following steps containing two main issues for additional controlling of the mesh. This may include the followings: As far as panel surface has been meshed, now volume mesh can be created. Building the mesh needs fine cells in area close the surface of panel. Oppositely, utilizing this size of part in the entire field would lead to a massive number of elements. That is why it was decided to utilize a fine mesh in the area close to the surface of panel and utilize coarse meshes as the space from the surface produces as shown in Figure 6. Table 1 and 2 show the momentum and thermal boundary conditions, respectively.
Figure 6. Mesh panel model with pin fin cooling module
Table 1. Momentum boundary conditions
|
Part |
Type |
Momentum Conditions |
|
|
Wall Motion |
Shear Condition |
||
|
Panel |
Wall |
Stationary |
No Slipping |
|
Side Walls |
Wall |
Stationary |
No Slipping |
|
cooling module inlet |
Velocity Inlet |
- Velocity Magnitude = (0.0002, 0.0004 and 0.001 m/s). or (0.002, 0.004 and 0.01 kg/s) |
|
|
cooling module outlet |
Pressure Outlet |
- Gauge Pressure=(0 pascal), [costant]. Method: (Normal to Boundary). |
|
Table 2. Thermal boundary conditions
|
Part |
Type |
Thermal Conditions |
|
Panel |
Wall |
- Heat flux Rate=900 (W/m2). - Wall Thickness=0.01 (m). |
|
Side Walls |
Wall |
- Heat flux Rate=0 (W/m2). |
|
Cooling module inlet |
Velocity Inlet |
Temperature=25℃. |
4.4 Basic governing equations
The conservation equations for continuity, momentum, and energy equations and turbulent model can be written as follows [20]:
-Conservation of Mass
$\frac{\partial u}{\partial x}+\frac{\partial v}{\partial y}+\frac{\partial w}{\partial z}=0$
-Navier-Stokes Equations
$\frac{\partial(\rho u u)}{\partial x}+\frac{\partial(\rho v u)}{\partial y}+\frac{\partial(\rho w u)}{\partial z}=-\frac{\partial p}{\partial x}+\mu\left[\frac{\partial^2 u}{\partial x^2}+\frac{\partial^2 u}{\partial y^2}+\frac{\partial^2 u}{\partial z^2}\right]$
$\frac{\partial(\rho u v)}{\partial x}+\frac{\partial(\rho v v)}{\partial y}+\frac{\partial(\rho w v)}{\partial z}=-\frac{\partial p}{\partial y}+\mu\left[\frac{\partial^2 v}{\partial x^2}+\frac{\partial^2 v}{\partial y^2}+\frac{\partial^2 v}{\partial z^2}\right]+S_{b j}$
$\frac{\partial(\rho u w)}{\partial x}+\frac{\partial(\rho v w)}{\partial y}+\frac{\partial(\rho w w)}{\partial z}=-\frac{\partial p}{\partial z}+\mu\left[\frac{\partial^2 w}{\partial x^2}+\frac{\partial^2 w}{\partial y^2}+\frac{\partial^2 w}{\partial z^2}\right]$
-Energy Equation
$\rho \frac{\partial}{\partial x}(u T)+\rho \frac{\partial}{\partial y}(v T)+\rho \frac{\partial}{\partial z}(w T)=\frac{\partial}{\partial x}\left(\Gamma_{\text {eff.h }} \frac{\partial T}{\partial x}\right)+\frac{\partial}{\partial y}\left(\Gamma_{\text {eff. } h} \frac{\partial T}{\partial y}\right)+\frac{\partial}{\partial z}\left(\Gamma_{\text {eff. }} \frac{\partial T}{\partial z}\right)+S_T$
A model of the PV panel with pin fin cooling module which has the following dimensions (L=1m, W=0.5m and H=0.03m), was taken in this study. Many computational runs were performed at various mean panel temperature, air inlet temperature and velocity. One method of offering data graphically is to display slices (plane) of the flow in which (y =0.02m) coordinate is held constant. Wholly graphic outcomes are schemed on the plane. All slices, sections, temperature contours and velocity vectors for the numerical work were presented.
5.1 Velocity contours
The plots and velocity contours are presented in this section for all the simulated cases with different inlet water velocities were considered, i.e. (0.0002, 0.0004 and 0.001 m/s). The water flow is designed to pass the pins which is used to cool the photovoltaic panel as a heat sink, this will lower the photovoltaic panel temperature to increase its efficiency. The velocity contours are shown in Figures 7-13 below for water flows in circular, elliptic and square pin fin cooling module respectively. It is noticed that for square pin fin, the velocity between the pins is higher than the other types of pins, this is because the sharp edges of the square shape work to separate the thermal boundary layer and thus increase the speed which leads to more circulation of water and more cooling.
Figure 14 shows the panel temperature versus inlet velocities, and the square pin fin cooling module is the best choice for design optimization due to lower panel temperature as compared to the other types, and as the velocity increases the panel surface temperature decreases, because the high velocities lead to disrupt the boundary layer, this leads to an increase in the rate of heat transfer which is considered a good indicator to increase the efficiency of the solar panel.
Figure 15 demonstrates the effect of working fluid velocity on cooling water average temperature, as a result the water temperature decreases with the increasing of inlet velocity due to the because of the increase in the heat transfer coefficient and radiation.
Figure 7. Temperatures & velocity contours for photovoltaic panel equipped with circler pin fin cooling module at Tin=25℃, Vin=0.0002 m/s
Figure 8. Temperatures & velocity contours for photovoltaic panel equipped with circler pin fin cooling module at Tin=25℃, Vin=0.0004 m/s
Figure 9. Temperatures & velocity contours for photovoltaic panel equipped with circler pin fin cooling module at Tin=25℃, Vin=0.001 m/s
Figure 10. Temperatures & velocity contours for photovoltaic panel equipped with elliptic pin fin cooling module at Tin=25℃, Vin=0.0002 m/s
Figure 11. Temperatures & velocity contours for photovoltaic panel equipped with elliptic pin fin cooling module at Tin=25℃, Vin=0.0004 m/s
Figure 12. Temperatures & velocity contours for photovoltaic panel equipped with elliptic pin fin cooling module at Tin=25℃, Vin=0.001 m/s
Figure 13. Temperatures & velocity contours for photovoltaic panel equipped with square pin fin cooling module at Tin=25℃, Vin=0.0004 m/s
Figure 14. Effect of cooling water velocity on photovoltaic panel average temperature
Figure 15. Effect of water velocity on cooling water average temperature
5.2 Temperature contours
In order to show the effect of water velocity on the temperature distribution shown in figures above, the temperature contours for (Tin=25℃) as a cooling medium temperature. It is noticed that as the cooling water velocity increase, the photovoltaic panel temperature decreases which is the scope of the study for all types of pin fins used. And the square pin fin has a lower water temperature and photovoltaic panel temperature, the elliptic pin fins have higher water temperature and photovoltaic panel temperature, the circular one is between them. So, the square pin fins cooling module is better in achieving the lower temperature of photovoltaic panel and increase its effectiveness, and this fact is clear which displays the influence of cooling water velocity on photovoltaic panel average temperature and average cooling water temperature.
The present work studies the performance of cooling photovoltaic panel equipped with various pin fin cooling modules. A model of the PV panel with pin fin cooling module which has the following dimensions (L=1m´W=0.5m´H=0.03m), was taken in this study. According to the previous discussion of the obtained results, the following points can be concluded:
(1) The plots of the velocity contours are presented in this section for all the simulated cases with inlet water velocities were considered, i.e. (0.0002, 0.0004 and 0.001 m/s).
(2) It is noticed that for square pin fin, the velocity between the pins is higher than the other types of pins, which leads to more circulation of water and more cooling.
(3) In order to show the effect of water velocity on the temperature distribution, the temperature contours for (Tin=25℃) was considered as a cooling medium temperature and it is noticed that as the cooling water velocity increase, the photovoltaic panel temperature decreases which is the scope of the study for all types of pin fins used.
(4) The square pin fins cooling module is batter in achieving the lower temperature of photovoltaic panel and increase its effectiveness.
[1] Alani, W.K., Zheng, J., Fayad, M.A., Lei, L. (2022). Enhancing the fuel saving and emissions reduction of light-duty vehicle by a new design of air conditioning worked by solar energy. Case Studies in Thermal Engineering, 30: 101798. https://doi.org/10.1016/j.csite.2022.101798
[2] Rustemli, S., Dincer, F. (2011). Modeling of photovoltaic panel and examining effects of temperature in Matlab/Simulink. Elektronika ir Elektrotechnika, 109(3): 35-40. https://doi.org/10.5755/j01.eee.109.3.166
[3] Arifin, Z., Tjahjana, D.D.D.P., Hadi, S., Rachmanto, R.A., Setyohandoko, G., Sutanto, B. (2020). Numerical and experimental investigation of air cooling for photovoltaic panels using aluminum heat sinks. International Journal of Photoenergy, 2020: 1574274. https://doi.org/10.1155/2020/1574274
[4] Sopian, K., Alwaeli, A.H., Kazem, H.A. (2019). Novel designs of photovoltaic thermal (PV/T) systems. International Journal of Recent Technology and Engineering, 8(4): 6223-6229.
[5] Jha, V., Triar, U.S. (2017). An improved generalized method for evaluation of parameters, modeling, and simulation of photovoltaic modules. International Journal of Photoenergy, 2017: 2532109. https://doi.org/10.1155/2017/2532109
[6] Irwan, Y.M., Leow, W.Z., Irwanto, M., Amelia, A.R., Gomesh, N., Safwati, I. (2015). Analysis Air Cooling Mechanism for Photovoltaic Panel by Solar Simulator. International Journal of Electrical & Computer Engineering, 5(4): 636-643.
[7] Zhe, L.W., Yusoff, M.I., Abd Razak, A., Misrun, M.I., Ibrahim, S., Fahmi, M.I., Rosmi, A.S. (2019). Effect of water cooling temperature on photovoltaic panel performance by using computational fluid dynamics (CFD). Journal of Advanced Research in Fluid Mechanics and Thermal Sciences, 56(1): 133-146.
[8] Sellami, R., Amirat, M., Mahrane, A., Slimani, M.E.A., Arbane, A., Chekrouni, R. (2019). Experimental and numerical study of a PV/Thermal collector equipped with a PV-assisted air circulation system: Configuration suitable for building integration. Energy and Buildings, 190: 216-234. https://doi.org/10.1016/j.enbuild.2019.03.007
[9] Al-Shamani, A.N., Othman, M.Y.H., Mat, S., Ruslan, M.H., Abed, A.M., Sopian, K. (2015). Design & sizing of stand-alone solar power systems a house Iraq. Conference: Recent Advances in Renewable Energy Sources, pp. 145-150.
[10] Antonini, A., Stefancich, M., Coventry, J., Parretta, A. (2013). Modelling of compound parabolic concentrators for photovoltaic applications. International Journal of Optics and Applications, 3(4): 40-52.
[11] Shanks, K., Senthilarasu, S., Mallick, T.K. (2016). Optics for concentrating photovoltaics: Trends, limits and opportunities for materials and design. Renewable and Sustainable Energy Reviews, 60: 394-407. https://doi.org/10.1016/j.rser.2016.01.089
[12] Chapin, D.M., Fuller, C.S., Pearson, G.L. (1954). A new silicon p-n junction photocell for converting solar radiation into electrical power. Journal of Applied Physics, 25(5): 676-677. https://doi.org/10.1063/1.1721711
[13] Algora, C., Rey-Stolle, I. (2016). Handbook of Concentrator Photovoltaic Technology. John Wiley & Sons.
[14] Sarmah, N. (2012). Design and performance evaluation of a low concentrating line-axis dielectric photovoltaic system. Doctoral dissertation, Heriot-Watt University. http://hdl.handle.net/10399/2656.
[15] Luque, A., Hegedus, S. (2011). Handbook of Photovoltaic Science and Engineering. John Wiley & Sons.
[16] Green, M.A., Emery, K., Hishikawa, Y., Warta, W., Dunlop, E.D. (2016). Solar cell efficiency tables (version 47). Progress in Photovoltaics: Research and Applications, 24: 3-11. https://doi.org/10.1002/pip.2728
[17] Martin, J. (2012). Monocrystalline vs Polycrystalline Solar Panels: Busting Myths. Solar choice, (Solar Panels/Modules, Solar System Products), https://www.solarchoice.net.au/blog/monocrystalline-s-polycrystalline-solar-panels-busting-myths/.
[18] Empa, Empa takes thin film solar cells to a new level. Swiss Federal Laboratories for Materials Testing and Research, 2015. A new world record for solar cell efficiency, https://www.empa.ch/web/s604/weltrekord.
[19] Rodrigues, E.M.G., Melicio, R., Mendes, V.M.F., Catalao, J.P. (2011). Simulation of a solar cell considering single-diode equivalent circuit model. In International conference on renewable energies and power quality, Spain, pp. 13-15.
[20] Green, M.A., Emery, K., Hishikawa, Y. (2015). Solar cell efficiency tables (Version 45). Progress in Photovoltaics: Research and Applications, 23(1): 1-9. https://doi.org/10.1002/pip.2573