Pengyu Zhao | Yuliang Zhao | Songping Li* | Jumin Yang | Juanfang Xu | Lei Li | Xueping Zhao
© 2022 IIETA. This article is published by IIETA and is licensed under the CC BY 4.0 license (http://creativecommons.org/licenses/by/4.0/).
OPEN ACCESS
Spillway is an important flood control facility for hydraulic architectures, whether the design and layout of the spillway are reasonable or not can directly affect the safety of hydraulic architectures and the investment of the entire project. To discuss the rationality of the designed reinforcement scheme for spillway of Goushuipo Reservoir in China, this paper employed the Computational Fluid Dynamics (CFD) methods, Volume of Fluid (VOF) model and Re-Normalization Group (RNG) model to simulate the water surface line of spillway under different verified flood standard conditions based on the measured data of water surface line of spillway of the Goushuipo Reservoir. By comparing with the test values, it’s verified that the simulation results are of high accuracy; then on this basis, this paper analyzed the relationship between water level and water flow of spillway under different conditions and other hydraulic performance such as the water flow state. Moreover, according to the simulation results, this paper analyzed the problems with the original design scheme and further proposed an optimized scheme: the two-step water-drop energy dissipation scheme for the Goushuipo Reservoir, and performed numerical simulation on the optimized scheme. At last, the simulation results proved the rationality of the optimized scheme, and the research findings of this paper provide useful references for the reinforcement project of the target reservoir in the future.
spillway, numerical simulation, 3D flow field, water surface line, bent flow
3.1 Comparative analysis of simulation results and test results
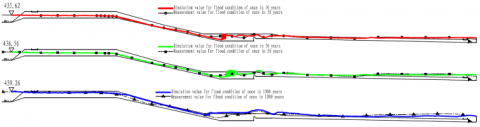
To verify the accuracy of numerical simulation, the calculated values and the physical model test measurement values were respectively compared under the flood conditions of once in 30 years, once in 50 years and once in 1000 years. Judging from the comparison results (Figure. 3), under the flood conditions of once in 30 years and once in 50 years, the maximum deviation between simulation value and measurement value of the water surface line of the spillway was 9.2%, the difference was relatively small, so the simulation accuracy was relatively high. Under the flood condition of once in 1000 years, the maximum deviation between simulation value and measurement value of the tailrace section was 38.7%, the difference was relatively large, but such small difference had little impact on the overall water surface line, so it’s known that the accuracy of numerical simulation was relatively high, and the numerical simulation method could be adopted to modify the original design scheme.
Figure 3. Comparison of simulation value and measurement value of the water surface line of central axis
3.2 Relationship between water level and water flow
When analyzing the changes of water level and water flow of the spillway, the upstream part of the spillway can be regarded as a wide-roof weir. Since in the upstream, there are bent sections with complex shapes and structures, plus the influence of the bridge piers, when water flows into the weir mouth, the width of the overflow section near the bridge pier is smaller than the width of the weir, which increases the local head loss and reduces the overflow capacity of the weir at the same time, causing the phenomenon of side contraction, so when calculating the flow rate, the influence of side contraction should be taken into consideration, and the relationship between water level and water flow is quite complicated. The effect of side contraction could be described by the contraction coefficient, then the water flow of non-flooded wide-roof weir without side contraction is [19, 20]:
$\text{Q}=\text{m}\varepsilon \text{b}\sqrt{2~\text{g}}{{\text{H}}^{\frac{3}{2}}}$ (4)
where, m is the flow coefficient; b is the weir width; ε is the contraction coefficient; and H is the water head above the weir.
Figure 4. Relationship curve of water level and water flow
By analyzing the water level-water flow data under different working conditions, the relationship between water level and water flow was concluded as shown in Figure 4. After fitting, the relationship function of water level and water flow under three flood conditions: once in 30 years, once in 50 years and once in 1000 years, was attained:
Q=-14.60832H2+13048.7113H–2.91148E+06
R² = 1 (5)
The function can be taken as a reference for flood discharge.
3.3 State of water flow in steep slope section
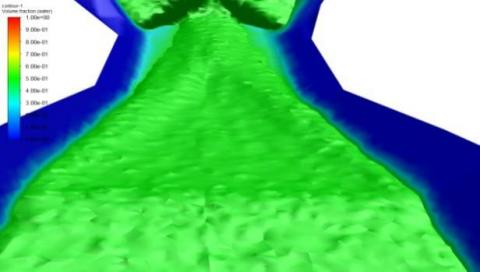
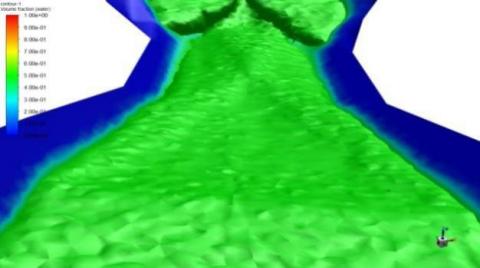
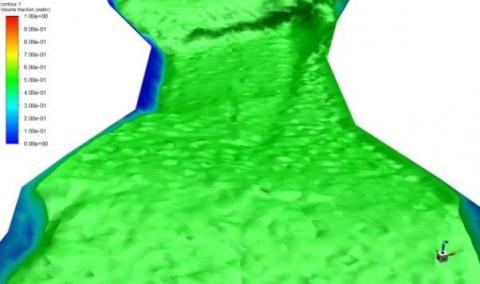
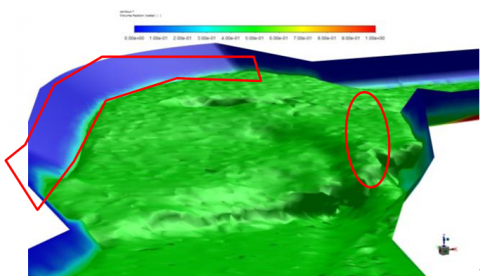
Since the front part of the spillway is a bent section, the water flow in this section is subject to centrifugal force; when flowing through this section, the surface water flows from the right bank to the left bank, and such lateral flow destroys the uniform distribution of water depth in the cross section, so that the outer side water depth is greater than the inner side water depth, resulting in water surface exceeding the specified height; at this time, the distribution of water flow in the cross-section is uneven, and the state of water flow tends to be complex. When the flow of discharged flood is large and rapid, the direction of water flow is deflected due to the side walls of the channel, generating a series of disturbance waves in the downstream of the deflection point, the waves appear as diamond-shaped crosses, forming shock waves [21]. Figure 5 shows the water surface distribution of the spillway under flood conditions of once in 30 years, once in 50 years and once in 1000 years. As shown in the figure, when the once-in-30-years flood flows into the overflow weir section through the bent section, diamond-shaped water flows would form on the surface of the spillway during the flood discharge process due to the action of the narrow cross-section of the channel. Then, with the increase of the flow volume, the water flow is affected by the bent section in the upstream, and the flow is unevenly distributed in per unit width, resulting in unstable diamond-shaped water flows in the overflow weir section, and they move towards the direction of the right bank. For flood that happens once in 50 years, the height of the side walls of the spillway could meet the flood discharge requirement; but for flood that happens once in 1000 years, the water level on the right bank of the spillway is higher than that on the left bank, and the risk of overflow would occur.
(a) Water surface of spillway under flood condition of once in 30 years
(b) Water surface of spillway under flood condition of once in 50 years
(c) Water surface of spillway under flood condition of once in 1000 years
Figure 5. Water flow state in spillway under different characteristic flows
3.4 Water flow state in stilling pool
Figure 6 shows the distribution of water surface in the stilling pool under different flood conditions. For floods once in 30 years and once in 50 years, the water flow exhibits submerged hydraulic jumps after entering the stilling pool, and the energy dissipation effect of the pool is obvious; however, due to the limitation of the height of side walls of the stilling pool, the energy generated by the water flow falling from upstream is huge, and the water flow rolls sharply in the stilling pool. Under the flood condition of once in 30 years, there’s a risk of overflow at the position of left side walls; under the flood condition of once in 50 years, there’s a risk of overflow on both left and right banks of end part of the stilling pool; under the flood condition of once in 1000 years, the energy dissipation effect of the stilling pool is not significant.
(a) Water surface in stilling pool under flood condition of once in 30 years
(b) Water surface in stilling pool under flood condition of once in 50 years
(c) Water surface in stilling pool under flood condition of once in 1000 years
Figure 6. Water flow state in stilling pool under different characteristic flows
According to the numerical simulation results, the height of steep slope section of spillway in the original design scheme can meet the flood discharge requirements of floods that happen once in 30 years and once in 50 years, but for the flood that happens once in 1000 years, the height of steep slope couldn’t meet the flood discharge requirement, and there’s a risk of overflow on the right bank of the spillway. Due to the large influence scope of hydraulic jumps, there’s overflow risk in some sections of the left bank under the flood condition of once in 30 years; for flood that occurs once in 50 years, there’s overflow risk in some sections on both the left and right banks of the stilling pool; for flood that occurs once in 1000 years, all sections of the stilling pool would have overflow risks. Therefore, it is necessary to modify the original design scheme. Since the maximum elevation of water surface of the left bank under the flood condition of once in 30 years is 412.87m, however, the height of side slop of the stilling pool is 511.53m, exceed 1.34m, according to the design requirements of once-in-30-years floods, the elevation of side slopes of both left and right banks should be increased to a height that is not lower than this maximum elevation. Under the flood condition of once in 30 years, there’s no overflow in the bent apron section, but there’s a sharp contracted section in the connection area between the bent apron section and the left bank of the tailrace channel, under the influence of the inflow of the bent apron section, this area would have overflow risk under the flood condition of once in 30 years, so the height of side slopes in this area should be increased.
4.1 Scheme design
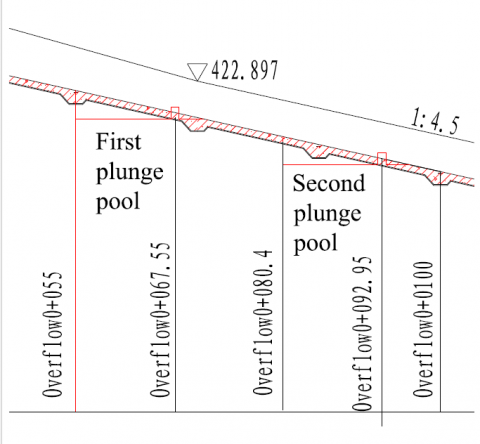
Figure 7. Structure of the two-step water-drop energy dissipation spillway
Increasing the height of side walls will greatly increase the project cost. In order to reduce the project investment and the overflow phenomenon to the greatest extent, taking the design standards of once-in-30-years floods as the reference, the original design scheme has been modified in this paper. In terms of once-in-30-years floods, under the action of the bent sections in the approach channel, the distribution of discharge per unit width is uneven, it’s greater on the left bank and smaller on the right bank; moreover, due to the influence of the contracted section at the inlet of the spillway, the diamond-shaped water flows tend to move to the right during the inflow process, forming lateral rolling phenomenon in the chute, and causing overflow risk to the left bank, therefore, the solution is to set two steps in the spillway, on the one hand, it could prevent the formation of diamond-shaped waves in the spillway and re-adjust the distribution of water flow in the cross section; on the other hand, it could form multi-step water-drop energy dissipation in the spillway during flood discharge, reduce the rolling of water flow in the chute, and minimize the occurrence of overflow risks. The specific design scheme is shown in Figure 7.
4.2 Analysis of improved results
Figure 8 compares the water flow state of the original scheme and the improved scheme under the flood condition of once in 30 years. According to the figure, in the two-step water-drop energy dissipation scheme, some energy has been attenuated in the spillway section, when water flow enters the stilling pool, the rolling of water flow has been reduced, the flow state becomes stabler, the maximum elevation of water surface under the flood condition of once in 30 years is 411.21m, lower than height of side slop of the stilling pool, there’s no overflow risk on the side walls of left and right banks, and the water flow in the chute smoothly connects with the water flow in the apron section, and the effect is relatively ideal. In the two-step water-drop energy dissipation scheme, the elevation of water surface line increases significantly in the steep slope section of the spillway, but still, there is no overflow; the elevation of water surface line drops significantly in the stilling pool section, and there is no overflow risk in this section as well; the water surface line in the tailrace section is relatively smooth, however, due to the influence of the backwater of the mountain body in the end section, the elevation of water level is still higher than the side wall height in the original design scheme.
(a) Original design scheme
(b) Water surface of two-stage water-drop energy dissipation scheme
Figure 8. Comparison of water flow state between original design scheme and the two-stage water-drop energy dissipation scheme
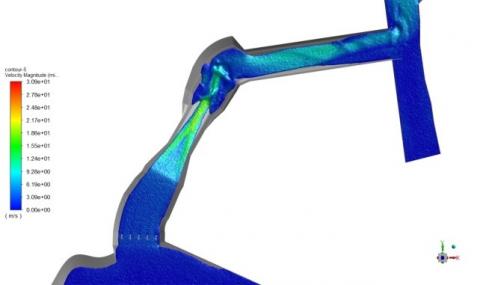
Figure 9 compares the flow velocity distribution of the original design scheme and the two-stage water-drop scheme, and the maximum velocity of the original design scheme and the two-stage water-drop energy dissipation scheme were exported by postprocessing tool of fluent. As shown in the figure, when water flow enters the first step, the maximum flow rate is 11.92m/s, when entering the second step, the maximum flow rate is 10.53m/s, when it flows from the second step to the stilling pool, the maximum flow rate is 12.94m/s; comparing with the maximum flow rate of 19.81m/s when spillway water flow enters the chute in the original scheme, the flow rate is significantly reduced, and the effect of the two-step water-drop energy dissipation is significant. After the water flows through the stilling pool and the apron section and enters the tailrace section, the maximum flow rate in the tailrace section is 7.78m/s, which is larger than that (6.42m/s) in the original design scheme.
Figure 10 shows the pressure distribution in of the spillway. When water flow falls into the plunge pool, the pressure on the bottom of the plunge pool is large, since the depth of the plunge pool is shallow, the discharged water impacts directly on the rectangular pier, and the pressure on the plunge pool bottom and the rectangular pier are greater. After calculation, the maximum pressure on the plunge pool bottom and the rectangular pier surface is 81.2kPa, therefore the deigned reinforcement of the plunge pool bottom and the rectangular piers should be strengthened. According to the figure, the maximum water pressure in the stilling pool is 87.5kPa, which is significantly lower than that (131kPa) in the original design scheme.
(a) Original design scheme
(b) Water surface of the two-stage water-drop energy dissipation scheme
Figure 9. Comparison of flow rate between original design scheme and the two-stage water-drop energy dissipation scheme
Figure 10. Pressure distribution of spillway of the Goushuipo Reservoir
This paper simulated the hydraulic performance of the spillway of the Goushuipo Reservoir in CFD software, and compared the simulation results with model test data under 3 different flood conditions of once in 30 years, 50 years, and 1000 years. For problems with the original design scheme, this paper proposed an improved scheme, and then analyzed the hydraulic performance of the improved scheme and attained the following conclusions:
(1) Based on the VOF water-gas two-phase flow model, this paper calculated the hydraulic performance of the Goushuipo Reservoir, and the numerical simulation has been proved to have a high accuracy. By analyzing the water level and water flow data under different flood conditions, this paper concluded the relationship between water level and water flow, and gave the relationship function under 3 different flood conditions after fitting, which provided a reference for flood discharge.
(2) The height of steep slope section of spillway in the original design scheme can meet the flood discharge requirements of floods that happen once in 30 years and once in 50 years, but for flood that happens once in 1000 years, the height of steep slope couldn’t meet the flood discharge requirement, and there’s a risk of overflow on the right bank of the spillway. Overflow occurs in the stilling pool under all 3 different flood conditions.
(3) To solve overflow in stilling pool under the flood condition of once in 30 years, this paper proposed a two-step water-drop energy dissipation design scheme. Compared with the original design scheme, which the height of water surface exceed 1.34m over side slop, the water flow state, water surface line, flow rate, and pressure of optimization scheme have been improved significantly, the maximum elevation of water surface is 411.21m, there’s no overflow risk on side walls of both left and right banks, the water flow in the chute smoothly connects with the water flow in the apron section, and the effect is relatively ideal. The improved scheme proposed in this paper could be taken as a reference for relevant studies and projects.
Henan Provincial Key Water Conservancy Science and Technology Research Project (Grant No.: GG202117).
[1] Wang, R., Zhang, F.K. (2022). Analysis and countermeasures of common problems in flood control and scheduling of large and medium-sized reservoirs. Harnessing the Huaihe River, 2022(1): 48-50. https://doi.org/10.3969/j.issn.1001-9243.2022.01.023
[2] Wu, X.Y., Jin, S.N., Xiong, L. (2018). Discussion on energy dissipation design of hydraulic structures. Water Economy, 2018(4): 1.
[3] Dong, Y.L. (2013). Research on composite energy dissipation of multi-stage water drop and underflow in curved spillway. Dalian University of Technology.
[4] Chen, Q., Dai, G., Liu, H. (2002). Volume of fluid model for turbulence numerical simulation of stepped spillway overflow. Journal of Hydraulic Engineering, 128(7), 683-688. https://doi.org/10.1061/(ASCE)0733-9429(2002)128:7(683)
[5] Johnson, M.C., Savage, B.M. (2006). Physical and numerical comparison of flow over ogee spillway in the presence of tailwater. Journal of Hydraulic Engineering, 132(12): 1353-1357. https://doi.org/10.1061/(ASCE)0733-9429(2006)132:12(1353)
[6] Meireles, I., Matos, J. (2009). Skimming flow in the nonaerated region of stepped spillways over embankment dams. Journal of Hydraulic Engineering, 135(8), 685-689. https://doi.org/10.1061/(ASCE)HY.1943-7900.0000047
[7] Liu, W., Han, H.Q. (2006). Experimental study on spillway of Dongzhou reservoir. Shandong Water Conservancy Science and Technology Forum, 571-573.
[8] Boes, R.M., Hager, W.H. (2003). Two-phase flow characteristics of stepped spillways. Journal of Hydraulic Engineering, 129(9): 661-670. https://doi.org/10.1061/(ASCE)0733-9429(2003)129:9(661)
[9] Zhou, B.B., Feng, W. (2016). Experiment on hydraulic characteristics of stepped spillway. Journal of Water Resources and Water Engineering, 27(2): 179-184. https://doi.org/10.11705/j.issn.1672-643X.2016.02.33
[10] Li, J.B., Li, L. (2015). Three-dimensional Numerical Simulation on the Hydraulic Properties of the Spillway of Zhangfeng Reservior. Journal of Taiyuan University of Technology, 2015(6): 775-779. https://doi.org/10.16355/j.cnki.issn1007-9432tyut.2015.06.025
[11] Wu, Z.S. (2017). Three-dimensional numerical simulation of scour pit shape downstream of gate and dam. Northwest A&F University.
[12] Peng, R.W., Zhang, X., Peng, Y.H. (2012). Experimental research on hydraulic characteristics of wall pressing flow for rectangle sharp-crested weir. Journal of North China Institute of Water Conservancy and Hydroelectric Power, 33(3): 23-26. https://doi.org/10.3969/j.issn.1002-5634.2012.03.007
[13] Chen, Q., Dai, G.Q. (2002). Three-dimensional numerical simulation of the stepped spillway overflow at the Yubeishan Reservoir. Journal of Hydroelectric Engineering, 2002(3): 62-72. https://doi.org/10.3969/j.issn.1003-1243.2002.03.009
[14] Liu, Y., Wang, W.E., Hu, X.T. (2014). Comparison of water-measuring column in u-shaped channel based on CFD. Journal of Irrigation and Drainage, 33(4): 163-167. https://doi.org/10.13522/j.cnki.ggps.2014.04/05.035
[15] Water Resources and Hydropower Planning and Design Institute of the Ministry of Water Resources, Changjiang Survey, Planning, Design and Research Co., Ltd. "Water Resources and Hydropower Engineering Classification and Flood Standards" SL252-2017.
[16] Sun, D.J., Shi, X., Zhang, Y., Zhang, L. (2021). Spatiotemporal distribution of traffic emission based on wind tunnel experiment and computational fluid dynamics (CFD) simulation. Journal of Cleaner Production, 282: 124495. https://doi.org/10.1016/j.jclepro.2020.124495
[17] Zhang, G., Zhou, G., Song, S., Zhang, L., Sun, B. (2020). CFD investigation on dust dispersion pollution of down/upwind coal cutting and relevant countermeasures for spraying dustfall in fully mechanized mining face. Advanced Powder Technology, 31(8): 3177-3190. https://doi.org/10.1016/j.apt.2020.06.009
[18] Kositgittiwong, D., Chinnarasri, C., Julien, P.Y. (2013). Numerical simulation of flow velocity profiles along a stepped spillway. Proceedings of the Institution of Mechanical Engineers, Part E: Journal of Process Mechanical Engineering, 227(4): 327-335. https://doi.org/10.1177/0954408912472172
[19] Musa, V.A., Mahmood, R.A., Khalifa, S.M.N., Ali, O.M., Abdulkareem, L.A. (2021). Flow patterns of oil-gas and pressure gradients in near-horizontal flow pipeline: Experimental investigation using differential pressure transducers. International Journal of Heat and Technology, 39(2): 621-628. https://doi.org/10.18280/ijht.390233
[20] Lv, H.X., Pei, G.X., Yang, L.X. (2011). Hydraulics. China Agricultural Press.
[21] Dong, Y.L., Liu, Y.K., Sun, H.L., Zhou, L. (2013). Research on composite energy dissipation system of multi-stage plunge with bottom flow for curved spillway. Journal of Water Resources and Architectural Engineering, 2013(5): 1-4, 9.