Guglielmina Mutani* | Valeria Todeschi | Simone Beltramino
© 2022 IIETA. This article is published by IIETA and is licensed under the CC BY 4.0 license (http://creativecommons.org/licenses/by/4.0/).
OPEN ACCESS
Improving outdoor thermal comfort of the urban spaces is one of the most important challenges that cities have to carry out in the next years. The aim of this work consists of assessing the impact of urban variables and to quantify the influence of greening on outdoor thermal comfort conditions. The work compares six neighborhoods in the city of Turin characterized by different urban forms, contexts, and green areas. External thermal comfort conditions were measured by evaluating a series of indicators with the support of the ENVI-met tool. Through the analysis of various scenarios, outdoor thermal comfort conditions were measured using green mitigation measures, like vegetated areas, trees, and green roofs. The results allow the evaluation on how outdoor thermal comfort varies in relation to urban form and greenery. By comparing neighborhoods with different urban characteristics, it was possible to define the most effective form for the city of Turin. Higher levels of mean radiant temperature were obtained with open form neighborhoods with a prevalent East-West orientation, a low buildings’ density, and a low height-to-width ratio. However, thermal comfort conditions can be mitigated by court-form districts and the presence of greenery, to increase the livability of the urban outdoor environment.
greening, neighborhood scale, outdoor thermal comfort, thermal comfort indexes, urban morphology
Increasing temperatures and urbanization tendencies improve the phenomenon of the urban heat island, making the external urban environments of cities thermally stressful. To improve living conditions in cities, reducing the energy consumption of the building stock needs a combination of other policies and techniques that can help reduce greenhouse gas emissions and mitigate heat island effects [1, 2].
A series of research on outdoor thermal comfort has shown that the factors with the most influence on thermal comfort are the quantity and duration of direct solar radiation and the mean radiant temperature, factors that strongly depend on the urban form [3, 4]. Analyzing these relationships, it can be observed how some results have shown correlations between urban parameters and thermal comfort indexes. In particular, among all the urban parameters, the building density is the one that finds the greatest correlation with thermal comfort conditions, as demonstrated in the studies of Chen et al. and Mutani et al. [5, 6]. Other studies in this field have shown that the materials used for the pavements of urban spaces and sidewalks affect the comfort of pedestrians and citizens. In particular, darker materials store solar radiation during the day and release it during the night. While the lighter and permeable materials mitigate the conditions of thermal comfort [7]. Finally, the impact of vegetation was assessed with some green actions for mitigating the urban heat island effects and improving the quality of urban areas [8].
Therefore, this work focused on mitigation strategies that can be implemented to improve thermal comfort of external urban environments; in particular on the effects of: urban geometry, vegetation, trees and outdoor surface materials [9].
The purpose of this analysis is to evaluate, in six typical neighborhoods located in Turin, how urban morphology and green mitigation actions affect outdoor thermal comfort conditions. This study analyses a scenario for integrating greenery into the urban context, taking into account the urban characteristics of each neighborhood. Four days, representative of seasonal climatic conditions, were examined with the aim of assessing how urban morphology and greening affect outdoor comfort during the year. The results obtained provide useful evaluations and correlations to identify more effective strategies for the implementation of building regulations with the objective of improving the livability of outdoor spaces.
The analysis of thermal comfort conditions in urban contexts is a topic that has recently seen the publication of a considerable amount of literature. The following paragraphs focus on the identification of the most common models and tools in the literature to assess thermal comfort conditions in combination with the main used outdoor thermal comfort indexes.
2.1 Urban climate models and tools
This paragraph shows a comprehensive overview of existing models and tools available to assess outdoor thermal comfort conditions, including the most commonly used outdoor thermal comfort indexes, that were found in literature. This analysis started with studies on experimental campaigns or in situ surveys and besides the use of various models and tools and analyses about various indexes. Some of the existing tools are: ENVI-met, Ray-man, CitySim, and SOLWEIG [6]. The literature review shows that one of the most used tool for the analysis about outdoor thermal comfort is ENVI-met, whose good results are given for granted. The most commonly adopted thermal comfort indexes are: PET, UTCI, PMV [6]. In particular, the study of Lam [9] is presented a comprehensive review on 130 researches and studies on the outdoor thermal comfort conditions in urban environments published in peer-reviewed journals from 2006 to 2019; the results of this research show that the most widely used tool and index are ENVI-met and Physiological Equivalent Temperature (PET), respectively.
2.2 Thermal comfort indexes
This research analyses thermal comfort conditions to compare the livability of different districts considering their built shape, and use of several materials and types of vegetation. Thermal comfort has been evaluated through a series of thermal comfort indexes considering only the objective physical characteristics of built environment and the average characteristics of people [10].
For outdoor thermal comfort, the literature review identifies the three most utilized indexes based on a thermal balance of human body: PMV, PET and UTCI. The most suitable indexes to evaluate really variable conditions of external environments are PET and UTCI. Moreover, this analysis also considers the mean radiant temperature (Tmrt) because it is an objective variable of outdoor environments and fundamental for the evaluation of PET, PMV, and UTCI indexes.
As noted in the previous paragraph, various tools can be used today to simulate human response about thermal comfort. In this work, ENVI-met software was used for the analysis of comfort indexes.
The Predicted Mean Vote PMV and the Physiological Equivalent Temperature PET are calculated through a heat balance between the human body and the external environment under controlled quasi steady-state conditions. The PMV is calculated with a one-node model and then with no thermoregulation within the human body; its value depends on a scale of seven values about thermal sensation (e.g., -3 ÷ +3). The PET is a two-node model that considers heat fluxes between the core and the skin layer of the human body and the external environment, then considering a simple model of thermo-regulation; its value describes the air temperature of the environment when there is thermal equilibrium with the actual values of core and skin temperatures, excluding wind speed and solar radiation.
The Universal Thermal Climate Index UTCI [11] is a multi-node model able to calculate the thermal response of the human body under quasi-transitory conditions, with a complex thermoregulation system with fifteen nodes and for all climates; its value describes the air temperature of a reference environment which causes the same effect to actual conditions.
To assess the outdoor thermal comfort conditions, one of the main variables is the mean radiant temperature Tmrt. The Tmrt is the temperature of a hypothetical uniform enclosure in which the radiant heat flow from/to the human body is equal to the radiant heat flow in the real non-uniform environment, according to the standard EN ISO 7726:2001. Tmrt has a substantial effect on thermo-physiological comfort indexes like PET, PMV, and UTCI. In practice, urban climate instruments like ENVI-met, SOLWEIG and CitySim simulate Tmrt according to the following Eq. (1):
$T_{m r t}=\sqrt[4]{\frac{\sum_{i=1}^{6} W_{i} \cdot\left(a_{p} \cdot K_{i}+a_{l} \cdot L_{i}\right)}{a_{l} \cdot \sigma}}$ (1)
where, $i$ is the direction; $W_{i}$ is form factor influenced by the relative position of the human body within the environment; $K_{i}$ is the short-wave radiation; $L_{i}$ is the long-wave radiation; $a_{p}$ and $a_{l}$ are the absorption coefficients of clothing respectively for the short and long wave radiation (default values: $0.7$ and $0.97) ; \sigma$ is the Stefan Boltzmann constant (5.67∙10–8 W/m2/K4).
Through a simplified GIS-based model [12, 13] the Tmrt (in Kelvin) can also be calculated with Eq. (2) like the procedure in the tool CityComfort+ [14]. By the use of GIS, input data can be organized to simplify and accelerate the simulations on thermal comfort conditions by utilizing some limited urban parameters such as urban canyon height/width ratio (H/W) and sky view factor (SVF) to describe the geometric characteristics of radiant heat flows:
$T_{m r t}=\sqrt[4]{\frac{\left(a_{p} \cdot E_{s u n} \cdot F_{s u n \rightarrow p} \quad +\varepsilon_{s k y} \cdot E_{s k y} \cdot F_{s k y \rightarrow p} \quad +\varepsilon_{u r b} \cdot E_{u r b} \cdot F_{u r b \rightarrow p}\right)}{\sigma}}$ (2)
where, $a_{p}$ is the short-wave absorption coefficient of clothing (default value $0.7$ ); $\varepsilon_{s k y}$ is the sky emissivity (0-1) knowing the dewpoint temperature; $\varepsilon_{u r b}$ is the emissivity of urban materials (0-1) $[15] ; E_{\text {sun }}$ is the direct and diffused component of solar irradiance $\left(\mathrm{Wm}^{-2}\right)$, the directed one was estimated by the shadows quantity on the vertical walls of buildings; $E_{s k y}$ and $E_{u r b}$ are the long wave solar irradiance from the sky and the urban context (Wm-2) $[15] ; F_{\text {sun } \rightarrow p}, F_{s k y \rightarrow p}$ and $F_{u r b \rightarrow p}$ are the view factor between the sun, sky and urban context and a person (these view factors are elaborated through GIS and vary from 0 to 1 ); $\sigma$ is the Stefan-Boltzmann constant (5.67∙10–8 W/m2/K4).
2.2.1 The Predicted Mean Vote (PMV)
The Predicted Mean Vote PMV is a commonly used thermal index in indoor environments, derived from body heat balance and empirical data. PMV is affected by the air characteristics (temperature, relative humidity, velocity), the human activity (metabolic rate and work) and by the type of clothing (thermal resistance). The international standard that describes how to evaluate the thermal sensation is the ISO 7730:2005 with a 7-point scale of PMV represented with “-3=very cold” to “+3=very hot”. In this work, the PMV was calculated using ENVI-met in outdoor environments according to the Standard VDI 3787-2:2008 mainly considering longwave radiation from the sun and higher wind speeds in typical days during the year, with Eq. (3):
$P M V=\left[0.028+0.303\left(-0.036 \cdot \frac{M}{A_{D u}}\right)\right] \cdot\left(\frac{H}{A_{D u}}-E_{d}-E_{s w}-E_{r e}-L-R-C\right)$ (3)
where, the energy production by human body per unit of skin area is expressed by $M / A_{D u}$ and $H / A_{D u} ; A_{D u}$ is the skin surface area; $M$ is the mechanical energy produced that depends on the human activity, $H$ is the internal remaining energy not used for mechanical work.
The skin water and vapour energy flow is expressed by: $E_{d}$ and $E_{s w} \cdot E_{d}$ is the amount of vapour diffusion through the skin; $E_{s w}$ is the cooling effect of evaporation through the skin.
The heat exchange through breathing is expressed by: $E_{r e}$ and $L$. The latent heat lost by the breathing system to humidify the air is $E_{r e}$; while $L$ is the sensible heat lost/gained via the inhaled air.
The surface heat exchanges at clothing level are expressed by: R and C. R and C are respectively the radiative and convective heat losses/gains by human body towards the environment surfaces and surrounding air (influenced mainly by thermal resistance of clothing, clothing-surfaces-air temperatures, heat transfer coefficients, wind-body relative velocity).
2.2.2 The Physiological Equivalent Temperature (PET)
The physiological equivalent temperature PET represents the air temperature of the environment calculated by an energy balance with the human body in an equilibrium condition with the real values of core and skin body temperatures, excluding wind speed and solar radiation [16]. PET can be calculated with Eq. (4) considering the temperatures of the skin, body, and clothing, the rate of sweating; those parameters are estimated by considering the energy balance equations between the human body and its surrounding environment:
$M+W+C+R+E_{d}+E_{r e}+E_{s w}+S=0$ (4)
where, $M$ is the metabolic heat production; $W$ is the mechanical work; $C$ and $\mathrm{R}$ are the convective and radiative sensible heat exchanges; $E_{d}, E_{r e}$ and $E_{s w}$ are the latent energy loss by vapour diffusion, by humidifying the air in the breathing system, and by sweat evaporating; $S$ is the heat storage capacity of the human body (equal to zero in steady-state conditions).
Using the actual values of skin and core body temperatures, the energy balance of Eq. (4) can be solved to estimate the air temperature Ta (or PET) in equilibrium conditions with: v=0.1 m/s, vp=12 hPa and Tmrt=Ta. In this work, PET was calculated with ENVI-met introducing some new improvements for outdoor environments [17].
2.2.3 The Universal Thermal Climate Index (UTCI)
The Universal Thermal Climate Index UTCI is the air temperature of a reference environment that cause the same thermal sensation of the real environment. ENVI-met was used to calculate UTCI with Eq. (5) by an iterative calculation of a polynomial regression mainly depending on wind speed, air temperature, mean radiant temperature and air vapour pressure (i.e., climate conditions):
$U T C I=f\left(T_{a} ; T_{m r t} ; v_{a} ; v_{p}\right)=T_{a}+O f f \operatorname{set}\left(T_{a} ; T_{m r t} ; v_{a} ; v_{p}\right)$ (5)
where, Offset is the difference between $U T C I$ and $T_{a}, T_{a}$ and $T_{m r t}$ are the air and mean radiant temperatures, $v_{a}$ is the wind velocity, $v_{p}$ is the water vapour pressure.
Because of a more complex calculation of UTCI with ENVI-met, some constraints were utilized; as an example, the wind speed can only vary between 0.5 and 17 m/s (i.e., for wind speed lower than 0.5 m/s, UTCI is equal to 0).
In this study, ENVI-met tool was used to assess the outdoor thermal comfort in six neighborhoods in the city of Turin characterized by different urban forms, contexts and green areas. ENVI-met is a tool based on CFD models and, according to the literature review, is one of the most widely applied tools for investigating thermal comfort in urban environments. By taking into account the effects of solar radiation on vegetation and soil, ENVI-met calculates a number of parameters to define the local climate conditions, such as air temperature, mean radiant temperature, relative humidity, wind speed and vapor pressure. The analysis was conducted on neighborhoods with dimensions of around 400 by 400 meters, with different urban characteristics, grid cells using a resolution of 10 x 10 meters. The choice of these settings was made to describe enough in detail of the six zones keeping simulation time short. In fact, ENVI-met needs a lot of time for simulations of outdoor thermal comfort conditions, which in this work were between 9 and 11 hours. Simulations were carried out for the hottest day (summer), the coldest day (winter) and an average reference day for spring and autumn.
This work is focused on three main evaluation points: the analysis of the different urban forms, comparing the 6 neighborhoods in the city of Turin, the analysis of mitigation strategies such as the inclusion of green areas and trees, and the analysis of the different external surfaces (asphalt, concrete, permeable surfaces). The first simulation aimed to describe the business-as-usual (SBAU) scenario; then, after mitigation measures, such as green roofs and green areas, the green scenario (SGREEN), useful to quantifying the variation of thermal comfort with Tmrt, PMV, PET and UTCI.
3.1 Case study
The study examines six districts, located within Turin, which have been selected as uniform areas with distinctive urban built characteristics and contexts [18]. From these analyses, urban characteristics that guarantee better thermal comfort conditions in winter and in summer could be identified. The analyzed neighborhoods are Crocetta, Arquata, Sacchi, Villaggio Olimpico, Mediterraneo and Raffaello. Figure 1 shows where the districts are located within the city of Turin.
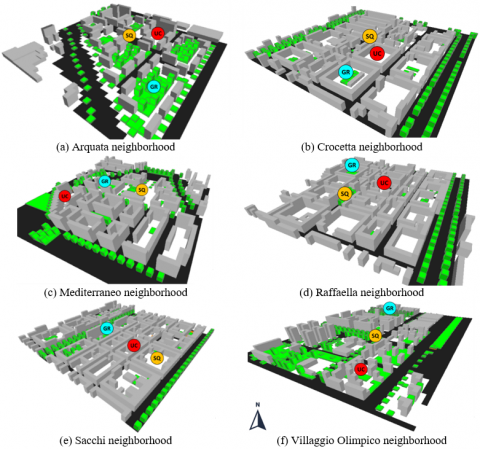
Figure 2 presents the analyzed neighborhoods with ENVI-met showing the different urban contexts. In particular, the blocks in grey define the buildings, of which the type of wall and roof materials have been set as constants: default - moderate insulation. The soil type was represented in the following way: asphalt in black (with albedo=0.13), grass in green (with albedo=0.25) and concrete surfaces in white (with albedo=0.35). The buildings were represented with blocks in grey and the trees with blocks in green; in particular, deciduous trees with a height of 15 meters are along the main roads, while a height of 5 meters was defined for the secondary roads).
In addition, comfort conditions throughout the typical days of the year were investigated in three sites with different urban characteristics: courtyards, green areas and urban squares. Table 1 compares the main key characteristics of the six districts case-studies, such as the amount of soil per type and the presence of grass and trees.
Arquata, Mediterraneo and Villaggio Olimpico districts are the more recently built neighborhoods, showing a higher coverage of grass and a lower urbanization. On the contrary, Crocetta, Raffaello and Sacchi districts, are historical neighborhoods characterized by a traditional structure with a higher density of urbanization and a reduced presence of green areas. Analyzing all districts in general, it is possible to observe very high percentage of road pavement areas with asphalt (from 35 to 51%), even in the historical districts of Raffaello, Sacchi and Crocetta.
Figure 1. Case study framework in Turin (IT)
Figure 2. ENVI-met models of the analyzed neighborhoods with the indication of specific points for the analysis on thermal comfort conditions: SQ=square, GR=green area, UC=urban courtyard
Table 1. Neighborhood’s properties (* not applicable)
|
Neighborhoods |
Arquata |
Mediterraneo |
Villaggio Olimpico |
Raffaello |
Sacchi |
Crocetta |
|
Extension of the area [m2]Table size |
108,925 |
182,461 |
294,409edited |
182,418 |
204,717can be |
199,250 |
|
Height/width ratio (H/W) [m/m] |
0.27 |
0.62 |
0.34 |
0.57 |
0.60 |
0.52 |
|
Main orientation (MO) |
N-S |
E-W and N-S |
n/a* |
N-S |
N-S |
E-W and N-S |
|
Building density (BD) [m3/m2] |
3.56 |
6.96 |
4.13 |
8.10 |
7.72 |
5.86 |
|
Asphalt [%] |
43.50 |
49.72 |
45.47 |
36.44 |
35.92 |
51.24 |
|
Concrete grey pavement [%] |
20.63 |
13.24 |
14.37 |
28.60 |
27.76 |
24.28 |
|
Concrete light pavement [%] |
6.13 |
11.64 |
4.27 |
0.00 |
0.00 |
0.00 |
|
Buildings Coverage Ratio [%] |
19.44 |
17.32 |
17.49 |
32.60 |
34.60 |
23.20 |
|
Grass [%] |
10.31 |
8.08 |
18.40 |
2.36 |
1.72 |
1.28 |
|
Trees 15 m high * [%] |
1.9 |
3.9 |
3.4 |
2.0 |
2.9 |
4.6 |
|
Trees 5 m high * [%] |
6.0 |
0.8 |
1.2 |
1.7 |
2.4 |
1.4 |
|
Inhabitants |
1,756 |
4,718 |
2,803 |
4,827 |
4,223 |
3,703 |
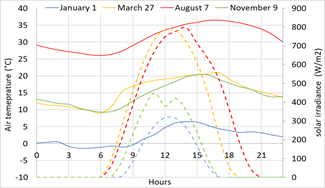
Hourly meteorological data from the weather station of the Politecnico di Torino and the Regional Agency for Environmental Protection of Piedmont Region (i.e., ARPA) were used to describe the local weather conditions on typical seasonal days. In Turin, the capital of the Piedmont Region, the climate is temperate, sub-continental type with humid cold winters and hot summers. Urban environments were simulated under extreme climatic conditions considering the reference year 2015: the hottest summer day (7th August) and the coldest winter day (1st January). In addition, the assessment was made on a typical day for autumn and spring (9th November and 27th March) with lower and higher solar irradiation conditions (Figure 3).
Figure 3. Hourly climate characteristics of selected days (year 2015). The air temperature is represented on the main vertical axis (solid line) and solar radiation on the secondary vertical axis (dashed line)
From Figure 3 it is possible to observe how the different intensities of solar radiation can influence the air temperature values. The input data of wind speed and direction have been assumed constant with daily mean values, whereas the air temperature and the relative humidity have been set with the hourly values. It should be noted that on selected days the wind speed, which fluctuates between 0.9 and 1.9 m/s, has low values typical of the city of Turin due to its location in the Po Valley surrounded by the Alps.
The variables useful to describe the climatic conditions and the urban forms of the selected case studies were obtained and represented from the available online existing GIS databases and they were also used as input parameters for the ENVI-met simulations. Thermal comfort simulations in the six neighborhoods were performed on four typical seasonal days. With the use of Bio-met, ENVI-met has allowed to determine some thermal comfort indexes (i.e., PET, PMV and UTCI) and the mean radiant temperature at 1 meter above the floor considering a reference person of 35 years, male, with 75 kg of weight, 1.75 meters of height. Moreover, these clothing insulation inputs were used: 1.5 clo or 0.23 m2K/W (for winter clothing), 1 clo or 0.015 m2K/W (for mid-season clothing), 0.5 clo or 0.08 m2K/W (for summer clothing); with a metabolic rate of 1.9 met or 110 W/m2 (for walking activity at 2 km/h - 0.56 m/s) [19].
The following paragraph is divided into three main parts that have been addressed: thermal comfort analysis at district scale, mitigation strategies scenarios, and the influence of urban design on comfort.
The analyses presented in the “results and discussions” paragraph compared the two districts of Arquata and Mediterraneo because they have similar characteristics in terms of asphalt coverage, greenery and buildings; at the same time, they present different forms and orientations of the urbanization, as can be seen from the different values about urban canyon and building density (in Table 1). In fact, Arquata presents neighborhoods with a more open shape while Mediterraneo is more closed. Finally, a focus on the different neighborhoods is presented, allowing to investigate the impact of green strategies that can be used as compensatory actions in the different urban contexts to improve thermal comfort conditions.
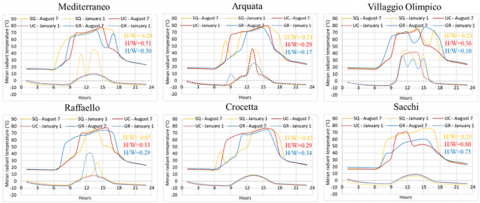
Figure 4. Comparison of hourly values of the Tmrt in the six neighborhoods in summer (solid lines) and winter (dashed lines) days in specific locations: UC: urban courtyard (red), GR: green area (blue), SQ: square (yellow)
4.1 Analysis of thermal comfort on a neighborhood scale
The analysis of thermal comfort at neighborhood scale is aimed at investigating, under different climatic conditions, the comfort conditions in selected urban contexts [20]. ENVI-met enables spatial analyses about thermal comfort in built environments. Figure 4 compares the six case studies through an analysis made on three selected points within the neighborhood (see Figure 2): a green area surrounded by buildings, an open space and a concrete paved area surrounded by buildings. Thermal comfort is investigated by analyzing the Tmrt on the hottest and coldest days.
In Figure 4, by comparing the six neighborhoods, it can be observed how the selected points behave differently depending on the analyzed context and its specific characteristics.
The graphs shown how the more traditional neighborhoods, such as Crocetta and Sacchi (with higher built density), are influenced in wintertime by perceiving less solar irradiation. While more open urban forms, typical of more recent conformations, such as Villaggio Olimpico and Arquata, are less influenced by these factors and therefore more thermally comfortable during winter (i.e., higher mean radiant temperature). While, during summertime, more traditional and dense forms are more comfortable than more recent open morphology due to increased shading. Moreover, the Tmrt varies according to the position in the neighborhood considered. In general, the GR and UC points have lower temperatures during the morning and afternoon because of the shading caused by the surrounding buildings. It can be seen that the variations of Tmrt during the day depend on the presence of shading, that is influenced by the height of the sun, causing significant variations of up to 20℃.
4.2 Mitigation strategies
(a) Arquata neighborhood
(b) Mediterraneo neighborhood
Figure 5. SBAU and SGREEN green mitigation measures
One of the strategies to make urban environments more liveable and mitigate the warming effects of the urban heat island is the use of greening. Greenery in built environments provides a series of benefits: improvements in external thermal comfort conditions, air quality and livability of urban spaces; reductions of air temperature, energy savings for space cooling and lower greenhouse gas emissions; reductions in rainwater runoff and, usually, esthetic and social improvements [21].
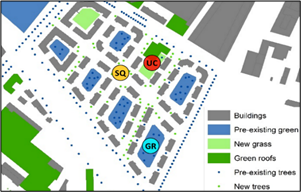
In order to analyze how thermal comfort is influenced by the urban context and assess the effect of mitigation strategies, a focus on Mediterraneo and Arquata neighborhoods is presented. Figure 5 shows the suggested mitigation measures taking into account the urban context and constraints.
Figure 5 shows the SBAU scenario (in blue), the green areas and trees currently present, and the SGREEN scenario (in green) which shows the planned mitigation actions such as: new green areas inside the courtyards, the insertion of green roofs and the increase of trees. The proposed measures take into account the urban context in which they are to be inserted, for example, green roofs have only been inserted on flat roofs.
Table 2. Assessment of comfort conditions with green mitigating actions and variation of comfort indexes
|
Neighborhood |
Green areas (%) |
Green roofs (%) |
Trees (%) |
ΔPET (℃) |
ΔPMV (-) |
ΔUTCI (℃) |
Simulation time |
|
Mediterraneo |
+7.8edited |
+29.3 |
+2.0 |
−1.47 (−2.20) |
−0.12 (−0.17) |
−0.36 (−0.68) |
11 hours |
|
Arquata |
+1.1 |
+22.2 |
+2.6 |
−0.57 (−1.05) |
−0.09 (−0.15) |
−0.35 (−0.59) |
9 hours |
*The maximum difference between SBAU and SGREEN in brackets
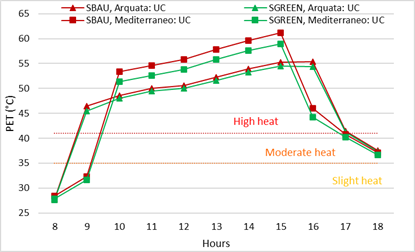
Table 2 shows the SBAU and SGREEN scenarios with a comparison of the increased green areas and trees (in %) and the resulting enhancements of outdoor comfort by assessing UTCI, PET and PMV. In particular, the graph shows the daily average PET, PMV and UTCI variation on 7th August 2015 (from 8 am to 6 pm) in two districts (in Arquata and in the Mediterraneo UC points, see Figure 5). Greater improvement of thermal comfort indexes (e.g., ΔPET) in the Mediterraneo district is visible because of the more relevant results with mitigation actions. Figure 6 shows how PET changes during the hottest day by the comparison of the SBAU and SGREEN scenarios in different locations (see Figure 5). As noticed from the Table 2, the improvement in outdoor thermal comfort is particularly consistent in Mediterraneo, thanks to the higher presence of green areas and roofs: respectively 6.7% and 7.1% higher compared to Arquata.
Figure 6. SBAU and SGREEN scenarios on August 7th, 2015. On the horizontal axes the hour, on the vertical axes the correspondent PET (℃) at specific locations (UC)
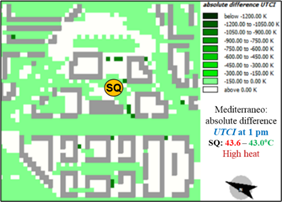
With ENVI-met it is possible to map the urban thermal comfort indexes to observe where the main changes occur. Figure 7 shows the UTCI and PET absolute difference of the two scenarios at 1 pm in Mediterraneo (considering a person that walks at 2 km/h) on August 7th, 2015. The maps show a general thermal comfort improvement, with most noticeable results near the new green areas. In this case, PET is more effective because UTCI as used in the software is limited to the low wind speed and this does not allow us to see the improvements within the courtyards.
(a) Mediterraneo: absolute difference UTCI at 1 pm
(b) Mediterraneo: absolute difference PET at 1 pm
Figure 7. Absolute difference PET between SBAU and SGREEN on August 7th, 2015 in Mediterraneo
4.3 The impact of urban design on thermal comfort
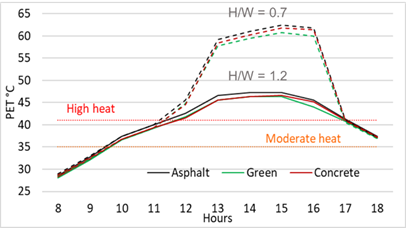
Figure 8. PET values (August 7th, 2015), for two different H/W canyon values: 1.2 (continuous line) and 0.7 (dotted line)
Among the urban morphology and thermal comfort conditions there is a correlation, which can by studied by investigating orientation, building density (BD), ratio of the total volume of buildings to the area of the building block, and the height/width ratio (H/W) of urban canyons, the ratio of the height of buildings to the distance between buildings.
In the first part of this analysis, PET is evaluated on August 7th, 2015 in two courtyards with different dimensions of urban canyon (with H/W equal to 1.2 and 0.7), typical values for the city of Turin. Figure 8 shows that higher is the value of canyon effect H/W, greater is the shading: from H/W of 0.7 to 1.2, there is a difference of about 15℃ of PET. From the graph in is also possible to see how the surface material can impact on outdoor thermal comfort conditions; as expected, lower PET values were achieved when using green areas, while asphalt produces the higher values of PET.
In the second part of this analysis, the effect of different types of outdoor surfaces on thermal comfort conditions was investigated on August 7th, 2015. Figure 9a represent the Tmrt in two courtyards with H/W of 0.6 m/m (orange line) and 0.4 m/m (blue line). The summer comfort conditions are better with East-West orientation and H/W of 0.6 m/m, this is due to the fact that for 3 hours the courtyard is sunny (from 10 am to 1 pm). With North-South orientation and H/W of 0.4 m/m the hours of sunshine are 4 (from 11 am to 3 pm), hours in which the solar irradiation has a maximum intensity.
Similar trends can be observed in Figure 9b, representing the Tmrt in an urban canyon with H/W of 0.7 m/m. Considering the urban canyon without tress (red line), the summer comfort conditions are better with the East-West orientation, with sunshine from 9 am to 1 pm; with North-South orientation the hours of sunshine move towards mid-day from 12 am to 4 pm with longer period of solar radiation and higher Tmrt values. Using trees (green line) it is possible to reduce the Tmrt with also a significant reduction of hours of sunshine.
(a) courtyards with H/W=0.6 and H/W=0.4 m/m
(Mediterraneo N-S and Crocetta E-W)
(b) urban canyon with H/W=0.7 m/m
(In Sacchi neighborhood)
Figure 9. The mean radiant temperature (Tmrt) from 7 am to 6 pm for August 7th, 2015
In the third and final part of this analysis, the average values of building density and height/width ratio were evaluated for each neighborhood. In Figure 10 the relationships between BD, H/W and the average Tmrt on August 7th and January 1st for the six neighborhoods are reported. It can be observed that:
From these findings it has emerged that neighborhoods that have a better East-West orientation, lower BD and lower H/W can achieve higher mean radiant temperature, but this result can be mitigated with the presence of greenery and above all trees along the roads to improve thermal comfort conditions.
Finally, Arquata and Villaggio Olimpico neighborhoods, that have low values of H/W and BD, are less dense with higher summer temperatures. Therefore, in these neighborhoods it is necessary to intervene with compensatory measures, such as green areas, green roofs and trees in order to improve the summer comfort.
(a) summer day: August 7th, 2015
(b) winter day: January 1st, 2015
Figure 10. Correlations between urban parameters (BD and H/W) and the mean radiant temperature (Tmrt)
This work evaluates the outdoor thermal comfort at pedestrian level, in six typical neighborhoods located in Turin, in order to provide guidance in the design of urban built environments.
This paper examines the indexes and tools used to calculate outdoor thermal comfort and presents an examination of the influence of urban form and green mitigation measures. The findings reveal that outdoor thermal comfort is significantly affected by urban morphology but a more use of green areas and trees can mitigate the local climate conditions; this result must be carefully evaluated for each climate. The information on urban design and the use of vegetation supports urban planners in improve the quality of outdoor spaces whose use is strongly influenced by winter and summer thermal comfort conditions. The use of thermal comfort indexes and tools as ENVI-met with a spatial representation is fundamental. However, this type of software requires a lot of information (not always available) and, at district scale, is high time-consuming.
In future works, simplified correlations will be analyzed for thermal comfort conditions by using simpler and more user-friendly GIS-based models [15, 22] that involve fewer input data and thus, reducing simulation times. Evaluations will be made in cities with different urban morphologies and climates, comparing thermal comfort indexes in different conditions, especially as regard to urban canyon dimensions, buildings’ orientations and ventilation conditions.
[1] Genco, A., Viggiano, A., Rospi, G., Cardinale, N., Magi, V. (2015). Dynamic modeling and simulation of buildings energy performance based on different climatic conditions. International Journal of Heat and Technology, 33(4): 107-116. http://dx.doi.org/10.18280/ijht.330414
[2] Mutani, G., De Nicolò, E., Blaso, L., Fumagalli, S., Tundo, A. (2021). The role of the internal heat gains for artificial lighting on the energy performance of buildings. International Journal of Heat and Technology, 39(5): 1395-1404. https://doi.org/10.18280/ijht.390501
[3] Nikolopoulou, M., Lykoudis, S. (2006). Thermal comfort in outdoor urban spaces: Analysis across different European countries. Building and Environment, 41(11): 1455-70. https://doi.org/10.1016/j.buildenv.2005.05.031
[4] Galal, O., Sailor, D., Mahmoud, H. (2020). The impact of urban form on outdoor thermal comfort in hot arid environments during daylight hours, case study: New Aswan. Building and Environment, 184: 107222. https://doi.org/10.1016/j.buildenv.2020.107222
[5] Chen, G., Rong, L., Zhang, G. (2021). Unsteady-state CFD simulations on the impacts of urban geometry on outdoor thermal comfort within idealized building arrays. Sustainable Cities and Society, 74: 103187. https://doi.org/10.1016/j.scs.2021.103187
[6] Mutani, G., Todeschi, V., Beltramino, S. (2021). How to improve the liveability in cities: The effect of urban morphology and greening on outdoor thermal comfort. TECNICA ITALIANA-Italian Journal of Engineering Science, 65(2-4): 361-370. https://doi.org/10.18280/ti-ijes.652-433
[7] Akbari, H., Pomerantz, M., Taha, H. (2001). Cool surfaces and shade trees to reduce energy use and improve air quality in urban areas. Sol. Energy, 70(3): 295-310. http://dx.doi.org/10.1016/S0038092X(00)00089-X
[8] Shashua-Bar, L., Pearlmutter, D., Erell, E. (2011). The influence of trees and grass on outdoor thermal comfort in a hot-arid environment. International Journal of Climatology, 31: 1498-1506. https://doi.org/10.1002/joc.2177
[9] Lam, C.K.C., Lee, H., Yang, S., Park, S. (2021). A review on the significance and perspective of the numerical simulations of outdoor thermal environment. Sustainable Cities and Society, 71: 102971. https://doi.org/10.1016/j.scs.2021.102971
[10] de Dear, R., Xiong, J., Kim, J., Cao, B. (2020). A review of adaptive thermal comfort research since 1998. Energy & Buildings, 214: 109893 https://doi.org/10.1016/j.enbuild.2020.109893
[11] Fiala, D., Havenith, G., Bröde, P., Kampmann, B., Jendritzky, G. (2012). UTCI-Fiala multi-node model of human heat transfer and temperature regulation. Int J Biometeorol, 56(3): 429-41. https://doi.org/10.1007/s00484-011-0424-7
[12] Jin, L., Schubert, S., Fenner, D., Meier, F., Schneider, C. (2021). Integration of a building energy model in an urban climate model and its application. Boundary-Layer Meteorology, 178: 249–281. https://doi.org/10.1007/s10546-020-00569-y
[13] Gál, C., Kàntor, N. (2020). Modeling mean radiant temperature in outdoor spaces, A comparative numerical simulation and validation study. Urban Climate, 32: 10057. https://doi.org/10.1016/j.uclim.2019.100571
[14] Huang, J., Cede, J.G., Spengler, J.D. (2014). CityComfort+: A simulation-based method for predicting mean radiant temperature in dense urban areas. Building and Environment, 80: 84-95. https://doi.org/10.1016/j.buildenv.2014.05.019
[15] Mutani, G., Todeschi, V. (2021). Roof-integrated green technologies, energy saving and outdoor thermal comfort: Insights from a case study in urban environment. International Journal of Sustainable Development and Planning, 16(1): 13-23. https://doi.org/10.18280/ijsdp.160102
[16] Matzarakis, A., Amelung, B. (2008). Physiological equivalent temperature as indicator for impacts of climate change on thermal comfort of humans. In Seasonal Forecasts, Climatic Change and Human Health, 161-172. https://doi.org/10.1007/978-1-4020-6877-5_10
[17] Walther, E., Goestchel, Q. (2018). The PET comfort index: Questioning the model. Building and Environment, 137: 1-10. https://doi.org/10.1016/j.buildenv.2018.03.054
[18] Mutani, G., Todeschi, V., Carozza, M., Rolando, A. (2020). Urban-scale energy models: Relationship between urban form and energy performance. IEEE Cando Conference, pp. 185-190. https://doi.org/10.1109/CANDO-EPE51100.2020.9337760
[19] Lau, K.K., Shi, Y., Ng, E.Y. (2019). Dynamic response of pedestrian thermal comfort under outdoor transient conditions. International Journal of Biometeorology, 63(7): 979-989. https://doi.org/10.1007/s00484-019-01712-2
[20] Kim, Y., Seung, M., Eum, J., Woo, J. (2016). Analysis of thermal environment over a small-scale landscape in a densely built-up Asian megacity. Sustainability, 8(4): 358. https://doi.org/10.3390/su8040358
[21] Santamouris, M., Ban-Weiss, G., Osmond, P., Paolini, R., Synnefa, A., Cartalis, C., Muscio, A., Zinzi, M., Morakinyo, T., Ng, E., Tan, A., Takebayashi, H., Sailor, D., Crank, P., Taha, H., Pisello, A., Rossi, F., Zhang, J., Kolokotsa, D. (2018). Progress in urban greenery mitigation science–assessment methodologies advanced technologies and impact on cities. Journal of Civil Engineering & Management, 24: 638-671. https://doi.org/10.3846/jcem.2018.6604
[22] Ren, C., Ng, E.Y., Katzschner, L. (2010). Urban climatic map studies: A review. International. Journal of Climatology, 31(15): 2213-2233. https://doi.org/10.1002/joc.2237