Zainal Arifin* | Ilham Wahyu Kuncoro | Miftah Hijriawan
© 2021 IIETA. This article is published by IIETA and is licensed under the CC BY 4.0 license (http://creativecommons.org/licenses/by/4.0/).
OPEN ACCESS
Indoor testing with a solar simulator is recommended to acquire the steady-state performance of a PV Solar Panel. Because of the simplicity, reproducibility, and dependability of data, the solar simulator allows for more efficient test findings. This can be accomplished by modifying and manipulating the test circumstances as needed. Several conditions must be met during the testing of the solar simulator, including power density, uniformity and stability of irradiance intensity (not exceeding 10%), spectral energy distribution, and angle of sunlight incident. Besides, the light source that replaces the sunlight is an important factor in developing a solar simulator. In this study, halogen lamps were chosen because of their reliability, low cost, and easy availability in the market. This solar simulator is designed for experimental testing on the development of Solar PV panels with a capacity of 50 WP. The solar simulator test performed at a distance of 75cm between the lamp and the solar panel, with five voltage variations: 100 volts, 125 volts, 160 volts, 190 volts, and 225 volts. Based on the ASTM E927 standard, the results of the solar simulator test in class B are obtained with an effective area of 16%. This result brought the best non uniformity of 2.61% at a voltage of 190 volts and the highest irradiance intensity of 1156.313 W/m2 at 225 volts.
solar simulator, irradiance, mapping, non uniformity
Utilization of solar energy as a renewable energy source, one of which can use the photovoltaic method, which utilizes photons in solar radiation to be converted directly into electrical energy through solar photovoltaic (PV) panel technology [1-3]. In its development to date, the utilization of solar PV panel technology still encounters various obstacles, such as those caused by operational environmental conditions and external factors that affect the performance and efficiency of the generating system [4]. Several things that can be considered for future developments are solar cell materials, modeling, integration with hybrid systems, implementation complexity, maximum power point tracking, and energy conversion systems [4-7]. In this case, testing Solar PV panels is important to pay attention to because of the many influencing factors. On the other hand, testing directly in the environment will provide challenges to obtain test stability. It is due to unpredictable environmental conditions and many external factors that can affect the test.
In its development to date, it is increasingly difficult to predict how much energy will be generated due to climate change, weather, and other factors that affect the performance of a renewable energy plant, especially Solar PV [8-10]. Solar radiation constantly changes every second and cannot be controlled. Besides, the spectral distribution is not the same in every location [11, 12]. Limitations in conducting experiments outdoors or in actual environmental conditions can be overcome by conducting experiments indoors using a solar simulator [13].
In this case, it is recommended that indoor testing using a solar simulator can obtain the steady-state performance of a PV Solar Panel [14]. Indoor testing with the solar simulator can allow more variables to control the conditions defined in a test procedure [13]. The solar simulator makes it possible to obtain more efficient test results due to the simplicity, reproducibility, and reliability of measurements. However, it is necessary to develop a solar simulator to meet all the requirements in obtaining good test results [15].
A solar simulator is used to provide illumination that represents the actual sunlight. It aims to provide solar radiation that can be controlled and changed according to the test conditions [16, 17]. With a solar simulator, performance testing of a Solar PV panel can be carried out at any time and continuously for up to 24 hours a day. Besides that, various parameters can be controlled, such as airflow conditions, ambient temperature, relative humidity, and controlled pressure [12, 17, 18]. Solar simulators can manipulate indoor tests for various elements and equipment, but they are more often used for solar cell research, characterization, quality manipulation, and performance confirmation of the completed module [12, 17]. However, compared to testing in an actual environment, the thing to note about this solar simulator is the light source that replaces the sunlight [19]. In this case, several light sources have been used for the solar simulator, including xenon, mercury, halogen, LED, a combination of these light sources, and so on. The use of these various light sources is based on the application, specific needs, and other considerations [13]. Several standards measuring Solar PV include ASTM, International Electrotechnical Commission (IEC), JIS, and others that impose several solar simulator requirements. These requirements include power density, uniformity and stability of irradiance intensity (not exceeding 10%), spectral energy distribution, and angle of sunlight incidence [12, 20-22].
At this time, xenon arc lamps are the light source with the highest spectral compatibility with the sun and easily filter light to match the best AAA class standard conditions [19, 23]. However, a relatively complex and expensive optical system is required to ensure uniform illumination in the test [12, 23, 24]. On the other hand, metal halide is also often used by researchers to develop solar simulators. Its characteristics are almost identical to xenon, but a longer service life and relatively lower cost make it more preferred than xenon [12, 24]. Although the cost is relatively cheaper than xenon, metal halide is still difficult to find in the market, and the price is still quite expensive. On the other hand, light-emitting diodes (LEDs) have potential as alternative light sources in solar simulators by considering various aspects such as high optical efficiency and power, lower thermal emissions, long service life, low operating voltage, and the availability of multiple wavelengths. However, the intensity generated is a limitation in developing this LED-based solar simulator [23]. Based on these cases, the halogen lamp was chosen because it is identical to the original sunlight, consisting of UV-Vis and IR spectrum, its reliability, lower price, and is easy to obtain in the market [19].
In this research, a medium solar simulator designed for experimental testing on the development of Solar PV panels with a capacity of 50 WP was made using halogen lamps. The use of halogen lamps aims to facilitate the development of solar simulators at low costs and still have reliable capabilities. The developed solar simulator circuit is equipped with a voltage regulator device and a breaker switch to adjust the irradiance intensity needed in the test and safety when an electric short circuit occurs. In the development of this solar simulator, several tests were carried out to characterize its reliability. The tests carried out include non-uniformity to find the area of the effective test area. It includes variations in height and irradiance intensity in the tests carried out.
2.1 Development of solar simulator
In this study, the development of a solar simulator aims to simulate sunlight in testing Solar PV panels indoors. It is intended to facilitate testing of the development of Solar PV panels, where various uncertainties are encountered when testing outdoors or in an actual environment [17, 18]. In this case, halogen lamps are used because they are easy to obtain, inexpensive, can work stably on a simple power supply and are quick and easy to develop with simple equipment [13]. Natural sunlight has a color temperature of ~5600 K. At the same time, halogen lamps emit radiation at a blackbody temperature of ~3200 K. Halogen lamps have wavelengths between 360 and 2500 nm, which are almost the same as sunlight, especially in thermal radiation [19, 24, 25]. However, compared to sunlight, the spectral distribution of halogen lamps is more in the infrared than in the ultraviolet [25]. In this developed solar simulator, the irradiance intensity can be changed by adjusting the input voltage that enters the solar simulator using a manual voltage regulator [26]. Table 1 below shows the specifications of each component used in the development of a solar simulator for 50 WP Solar PV.
Table 1. Overview of component specifications on solar simulator for 50 WP solar PV design
|
No. |
Components |
Specification |
|
1 |
Solar Simulator Framework |
Perforated iron with dimensions of 1.5 m×1.5 m×2.5 m |
|
2 |
Halogen Lamp |
Philips Halogen Lamp Plusline PLUS PRO S 500W R7s 230V 1CT/50 [27] |
|
3 |
Dimmer |
Rotary type dimmer 220 Volt 4000 Watt |
|
4 |
Circuit Breaker |
MCB 16 Ampere 3500 Watt |
|
5 |
Wiring |
Single copper cable with a diameter of 2.5 mm |
The simulated solar spectrum was determined by irradiation across a wavelength interval ranging between 300 and 1400 nm. In this case, the beam from the solar simulator must produce an acceptable spectral range, spatial uniformity, and temporal stability [28]. The solar simulator can be classified into three classes, namely class A, B, and C. Each class has its specifications, as listed in Table 2 based on ASTM standards.
Table 2. ASTM solar simulation class specification [21]
|
Class |
Spectral Match, Each Interval |
Irradiance Spatial Non-Uniformity |
Temporal Instability |
|
Class A |
0.75-1.25 |
2% |
2% |
|
Class B |
0.6-1.4 |
5% |
5% |
|
Class C |
0.4-2.0 |
10% |
10% |
In this case, the value of nonuniformity and temporal instability in the solar simulator can be known by the following equation [13]:
Temporal Instability $(\%)=\frac{\left(I_{m, \max }-I_{m, \min }\right)}{\left(I_{\max } \quad+I_{m, \min }\right)} \times 100 \%$ (1)
where, $I_{m, \max }$ and $I_{\mathrm{m}, \mathrm{min}}$ are the maximum and minimum values of the irradiance intensity (W/m2).
Non Uniformity $(\%)=\frac{\left(I_{\bar{m}, \max }-I_{\bar{m}, \min }\right)}{\left(I_{\bar{m}, \max } \quad+I_{\bar{m}, \min }\right)} \times 100 \%$ (2)
With $I_{\bar{m}, \max }$ and $I_{\bar{m}, \mathrm{~min}}$ is the average value of the maximum and minimum measured irradiance intensity (W/m2). In addition, the energy conversion efficiency of the solar simulator (η) can be found by the following equation [12]:
$\eta=\frac{\text { Total output flux }}{\left(\text { Number of lamp } \times \text { Lamp } \frac{\text { Power }}{\text { Target area }}\right)}$ (3)
2.2 Solar simulator experimental design
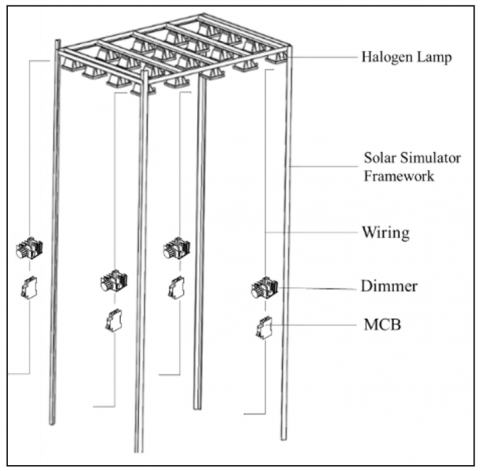
The development of this solar simulator serves as a test for Solar PV panels with a capacity of 50 WP. This solar simulator consists of the mainframe using perforated iron arranged to form a beam frame with dimensions of 1.5 m×1.5 m×2.5 m. This solar simulator light source uses halogen lamps with a capacity of 500 Watts with the Phillips Essential brand, arranged in a row with a 4×5 configuration of 20 lamp units, as shown in Figure 1 below [16].
Figure 1. Solar simulator configuration for experimental design of 50 WP solar photovoltaic
Figure 2. Solar simulator configuration for experimental design of 50 WP solar photovoltaic
In operation, the radiation intensity from the lamp is controlled by a dimmer and uses a circuit breaker as a safety system from the solar simulator circuit in an electric short circuit. Each dimmer used has a specification of 220 Volt AC input voltage with a maximum power of 4000 Watts and a rotary type selector to adjust the incoming voltage to the lamp. In addition, each circuit breaker used has a current specification of 16 Ampere with a maximum power of 3500 Watts and is equipped with a breaker switch. In connecting the electrical circuit from this solar simulator using a single copper cable with a diameter of 2.5 mm. and arranged in such a way as shown in Figure 2.
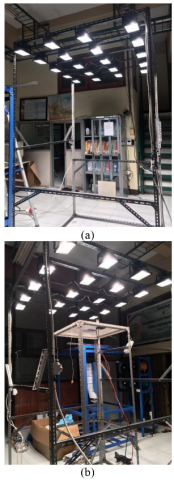
In use, the height of the solar simulator can be adjusted to the needs of the test by adjusting the legs of the solar simulator frame. After turning on the solar simulator, it takes 30 minutes to obtain a stable maximum irradiance intensity from the previous voltage setting. Furthermore, the Lutron SPM-1116SD Solar Power Meter was used to measure the irradiance intensity from the solar simulator, which was placed at each measurement point using a 1.5 m×1.5 m flat plate with a configuration of 30×30 measurement points. Solar simulator testing is carried out at one level, which is 75 cm from the lamp. Furthermore, five variations of the test voltage of 100 volts, 125 volts, 160 volts, 190 volts, and 225 volts were evaluated to perform tests on different ranges of irradiance intensity values. In each data collection on the test variation, the solar simulator is turned off and cooled before taking data on the following test variation. In this case, Figure 3a shows the experimental set-up of the solar simulator, and Figure 3b shows the experimental design of 50 WP Solar PV using the Solar Simulator.
Figure 3. (a) Solar simulator experimental set-up and (b) Experimental design of 50 WP solar photovoltaic using solar simulator
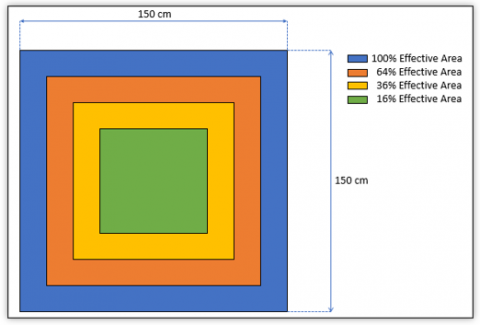
3.1 Effective area
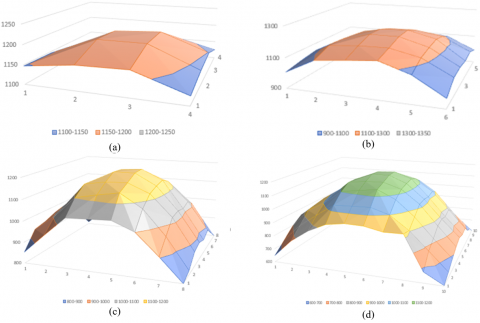
The effective area is where the solar panel area can produce the level of non uniformity and the expected average level of light intensity. In this study, there were four effective areas studied, namely 2.25 m2, 1.44 m2, 0.81 m2, and 0.36 m2 or equivalent to the ratio of the cross-sectional area of the solar simulator to the effective irradiation area, respectively, namely 100%, 64%, 36%, and 16% shown in Figure 4.
The data collection results found that the effective area of 16% has the smallest level of non uniformity among other areas, as shown in Figure 5. It was found that the effective area greatly affects non-uniformity. This is influenced by the maximum distribution of the solar simulator light where the area is 100% has a high level of non-uniformity because of the difference in the maximum intensity value in the middle and the minimum intensity value at the edge of the area is very large. The level of non uniformity will decrease as the effective area decreases until it has the smallest non uniformity of 3.06%.
Figure 4. Effective area of solar simulator
With a distance of 75 cm from the solar simulator and a maximum voltage of 225 volts, non uniformity values were obtained for each effective area. In the 16% effective area, the uniformity value is 3.06%, with an average intensity of 1156.31 W/m2, while the intensity distribution is shown in Figure 6(a). Meanwhile, in the 36% effective area, the non uniformity value is 10.70%, with an average intensity of 1096.11 watt/m2, where the distribution is shown in Figure 6(b). The 64% effective area with non uniformity of 21.27% has the highest average intensity of 1018.71 W/m2, as shown in Figure 6(c). The 100% effective area has a non uniformity of 32.92% with an average intensity of 930.64 71 W/m2, where the distribution is as shown in Figure 6(d). In the four effective areas studied, it was found that the non uniformity below 5% was only in the 16% effective area. It indicates that the 16% effective area can only be collected for solar panels because the non uniformity value follows the criteria [13].
Figure 5. Effective area vs uniformity
Figure 6. (a) Mapping intensity in the 16% effective area, (b) mapping intensity in the 36% effective area, (c) mapping intensity in the 64% effective area, and (d) mapping intensity in the 100% effective area
Table 3. Non uniformity mapping in 75 cm distance testing
|
Voltage (Volt) |
Parameter |
Percentage (Ratio) |
|||
|
100% |
64% |
36% |
16% |
||
|
225 |
Non Uniformity (%) |
0.329262 |
0.212798 |
0.107093 |
0.030643 |
|
Average Intensity (W/m2) |
930.64 |
1018.719 |
1096.111 |
1156.313 |
|
|
190 |
Non Uniformity (%) |
0.337705 |
0.216458 |
0.097955 |
0.026157 |
|
Average Intensity (W/m2) |
810.17 |
886.8281 |
952.0278 |
980.15 |
|
|
160 |
Non Uniformity (%) |
0.339954 |
0.216366 |
0.119336 |
0.044669 |
|
Average Intensity (W/m2) |
662.94 |
728.4531 |
783.4722 |
825.4375 |
|
|
125 |
Non Uniformity (%) |
0.344262 |
0.217822 |
0.110108 |
0.034483 |
|
Average Intensity (W/m2) |
479.39 |
525.0625 |
563.8611 |
592.625 |
|
|
100 |
Non Uniformity (%) |
0.375201 |
0.241279 |
0.11634 |
0.032648 |
|
Average Intensity (W/m2) |
327.42 |
361.3594 |
390.8889 |
412.875 |
|
3.2 Voltage vs irradiation intensity test and non uniformity
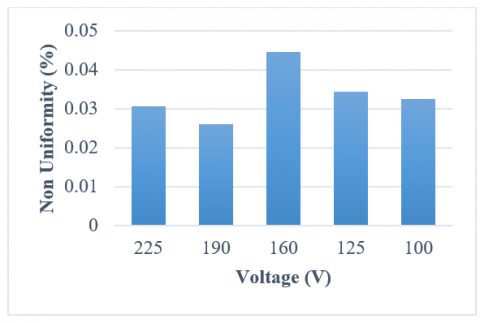
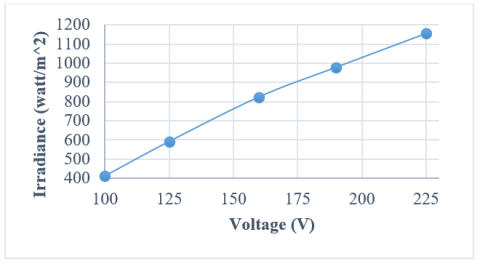
In testing the voltage variation on radiation intensity and non-uniformity, the data obtained are as shown in Table 3. By using five voltage variations, namely 100 volts, 125 volts, 160 volts, 190 volts, and 225 volts, it is found that the value of radiation intensity increases when the voltage is raised on the solar simulator. Non uniformity is closely related to the dispersion of the light and its intensity. Changes in lamp voltage do not have a significant effect on the non uniformity where the overall lamp voltage produces a non uniformity value below 5%. This can be seen in Figure 7, which shows a picture of the relationship between voltage and radiation intensity. As for non uniformity in the 16% effective area, it has a value below 5%, with a range of 4.46% to 2.61%. Small changes in the value of non uniformity can also be seen in the effective area of 36%, 64%, and 100%. The distance between the lamp and the test bed has an effect on the observed radiation intensity, where the longer the distance between the lamp and the test bed, the lower the radiation intensity value [29]. However, some research have discovered that the distance between the lamp and the test bed affects the non uniformity value, with the non uniformity value decreasing as the distance between the lamp and the test bed comes closer [13]. This provides the basis that the non uniformity value does not significantly affect the lamp voltage value.
In this case, where the lowest non-uniformity value is obtained at 16%, the relationship between voltage changes and irradiance intensity in the solar simulator can be shown in Figure 8. Based on the displayed graph, it can be seen that the increase in voltage that occurs also increases the value of the irradiance intensity generated by the solar simulator. In the 225 volts voltage variation, the highest irradiance intensity value is 1156,313 W/m2, and the lowest irradiance intensity is 412.875 W/m2.
Figure 7. Overview of non- uniformity vs voltage in solar simulator testing at a distance of 75 cm
Figure 8. Overview of irradiance intensity vs voltage in solar simulator testing at a distance of 75 cm
This study indicate that Halogen lamps have the reliability to be used as a low-cost solar simulator on a lab scale. However, Halogen lamps tend to emit infrared spectrum rather than ultraviolet. This will generate more heat and produce less electricity due to the difference in its working spectrum. Non-uniformity tests were carried out to characterize the reliability of this solar simulator, to find the effective test area through variations in voltage, and irradiance intensity. Four effective areas can be justified based on the results of tests performed on 50 WP solar panels, namely 100%, 64%, 36%, and 16%. In this research, non uniformity can be achieved well with the ASTM E927 standard with class B in an effective area of 16%. This has been able to achieve the expected target of this research, which aims to create an experimental design tool on Solar PV panels with a capacity of 50 WP. In this case, the best non uniformity obtained is 2.61% at a voltage of 190 volts, and the highest irradiance intensity is 1156,313 W/m2 at a voltage of 225 volts.
This research is charged to the Budget Implementation List (DIPA) of the Deputy for Research and Development Strengthening, Ministry of Research and Technology/National Research and Innovation Agency for Fiscal Year 2021 with the title "Development of Passive Cooling Systems with Integration of Heat Sinks and Wind Concentrators to Improve Photovoltaic Performance-ground System" and Contract Number: 221.1/UN27.22/HK.07.00/2021.
[1] Arifin, Z., Tjahjana, D.D.D.P., Hadi, S., Rachmanto, R.A., Setyohandoko, G., Sutanto, B. (2020). Numerical and experimental investigation of air cooling for photovoltaic panels using aluminum heat sinks. International Journal of Photoenergy, 9 pages. https://doi.org/10.1155/2020/1574274
[2] Wu, X., Chen, G.Y., Owens, G., Chu, D., Xu, H. (2019). Photothermal materials: A key platform enabling highly efficient water evaporation driven by solar energy. Materials Today Energy, 12: 277-296. https://doi.org/10.1016/j.mtener.2019.02.001
[3] Kumar, A.L., Alexander, S.A., Rajendran, M. (2020). Power Electronic Converters for Solar Photovoltaic Systems. Academic Press.
[4] Al-Shahri, O.A., Ismail, F.B., Hannan, M.A., Lipu, M.H., Al-Shetwi, A.Q., Begum, R.A., Soujeri, E. (2021). Solar photovoltaic energy optimization methods, challenges and issues: A comprehensive review. Journal of Cleaner Production, 284: 125465. https://doi.org/10.1016/j.jclepro.2020.125465
[5] Wilberforce, T., Baroutaji, A., El Hassan, Z., Thompson, J., Soudan, B., Olabi, A.G. (2019). Prospects and challenges of concentrated solar photovoltaics and enhanced geothermal energy technologies. Science of The Total Environment, 659: 851-861. https://doi.org/10.1016/j.scitotenv.2018.12.257
[6] Liu, F., Zeng, Q., Li, J., Hao, X., Ho-Baillie, A., Tang, J., Green, M.A. (2020). Emerging inorganic compound thin film photovoltaic materials: Progress, challenges and strategies. Materials Today, 41: 120-142. https://doi.org/10.1016/j.mattod.2020.09.002
[7] Khodayar, M.E., Feizi, M.R., Vafamehr, A. (2019). Solar photovoltaic generation: Benefits and operation challenges in distribution networks. The Electricity Journal, 32(4): 50-57. https://doi.org/10.1016/j.tej.2019.03.004
[8] Bhattacharjee, S., Acharya, S. (2016). Performative analysis of an eccentric solar–wind combined system for steady power yield. Energy Conversion and Management, 108: 219-232. http://dx.doi.org/10.1016/j.enconman.2015.11.023
[9] Yin, P.Y., Cheng, C.Y., Chen, H.M., Wu, T.H. (2020). Risk-aware optimal planning for a hybrid wind-solar farm. Renewable Energy, 157: 290-302. https://doi.org/10.1016/j.renene.2020.05.003
[10] Barakat, S., Ibrahim, H., Elbaset, A.A. (2020). Multi-objective optimization of grid-connected PV-wind hybrid system considering reliability, cost, and environmental aspects. Sustainable Cities and Society, 60: 102178. https://doi.org/10.1016/j.scs.2020.102178
[11] Yoon, H.I., Kim, J.H., Park, K.S., Namgoong, J.W., Hwang, T.G., Kim, J.P., Son, J.E. (2020). Quantitative methods for evaluating the conversion performance of spectrum conversion films and testing plant responses under simulated solar conditions. Horticulture, Environment, and Biotechnology, 61(6): 999-1009. https://doi.org/10.1007/s13580-020-00286-y
[12] Tawfik, M., Tonnellier, X., Sansom, C. (2018). Light source selection for a solar simulator for thermal applications: A review. Renewable and Sustainable Energy Reviews, 90: 802-813. https://doi.org/10.1016/j.rser.2018.03.059
[13] Yandri, E. (2018). Uniformity characteristic and calibration of simple low cost compact halogen solar simulator for indoor experiments. International Journal of Low-Carbon Technologies, 13(3): 218-230. https://doi.org/10.1093/ijlct/cty018
[14] Standard, A.S.H.R.A.E. (1977). Methods of testing to determine the thermal performance of solar collectors. American Society of Heating, 93-77.
[15] Frolova, T.I., Churyumov, G.I., Vlasyuk, V.M., Kostylyov, V.P. (2019). Combined solar simulator for testing photovoltaic devices. In 2019 1st Global Power, Energy and Communication Conference (GPECOM), pp. 276-280. https://doi.org/10.1109/GPECOM.2019.8778607
[16] Hasan, H.A., Sopian, K., Jaaz, A.H., Al-Shamani, A.N. (2017). Experimental investigation of jet array nanofluids impingement in photovoltaic/thermal collector. Solar Energy, 144: 321-334. http://dx.doi.org/10.1016/j.solener.2017.01.036
[17] Irwan, Y.M., Leow, W.Z., Irwanto, M., Amelia, A.R., Gomesh, N., Safwati, I. (2015). Indoor test performance of PV panel through water cooling method. Energy Procedia, 79: 604-611. http://dx.doi.org/10.1016/j.egypro.2015.11.540
[18] Hussain, F., Othman, M.Y.H., Yatim, B., Ruslan, H., Sopian, K., Anuar, Z., Khairuddin, S. (2011). Fabrication and irradiance mapping of a low cost solar simulator for indoor testing of solar collector. Journal of Solar Energy Engineering, 133(4). https://doi.org/10.1115/1.4004548
[19] Enaganti, P.K., Dwivedi, P.K., Srivastava, A.K., Goel, S. (2020). Analysis of submerged amorphous, mono-and poly-crystalline silicon solar cells using halogen lamp and comparison with xenon solar simulator. Solar Energy, 211: 744-752. https://doi.org/10.1016/j.solener.2020.10.025
[20] IEC. (2007). IEC 60904-9 2007 Photovoltaic Devices-Part 9: Solar Simulator Performance Requirements.
[21] ASTM International. (2015). “Standard Specification for Solar Simulation for Photovoltaic Testing” ASTM E927-10 (2015). Pennsylvania: ASTM International.
[22] Japanese Standards Association. (2011). JIS C 8912:1998/AMENDMENT 2:2011 Solar simulators for crystalline solar cells and modules (Amendment 2).
[23] Baguckis, A., Novičkovas, A., Mekys, A., Tamošiūnas, V. (2016). Compact hybrid solar simulator with the spectral match beyond class A. Journal of Photonics for Energy, 6(3): 035501. https://doi.org/10.1117/1.JPE.6.035501
[24] Sabahi, H., Tofigh, A.A., Kakhki, I.M., Bungypoor-Fard, H. (2016). Design, construction and performance test of an efficient large-scale solar simulator for investigation of solar thermal collectors. Sustainable Energy Technologies and Assessments, 15: 35-41. http://dx.doi.org/10.1016/j.seta.2016.03.004
[25] Chadel, M., Bouzaki, M.M., Chadel, A., Petit, P., Sawicki, J.P., Aillerie, M., Benyoucef, B. (2017). Influence of the spectral distribution of light on the characteristics of photovoltaic panel. Comparison between simulation and experimental. In AIP Conference Proceedings, 1814(1): 020054. http://dx.doi.org/10.1063/1.4976273
[26] Yandri, E. (2019). Development and experiment on the performance of polymeric hybrid Photovoltaic Thermal (PVT) collector with halogen solar simulator. Solar Energy Materials and Solar Cells, 201: 110066. https://doi.org/10.1016/j.solmat.2019.110066
[27] Philips. (2020). PLUS PRO S 500W R7s 230V 1CT/50 [Internet]. Available from: https://www.lighting.philips.co.id/id/prof/conventional-lamps-and-tubes/lampu-halogen/halogen-mv-tanpa-reflektor/plusline-small/925632544211_EU/product, accessed on Dec. 25 2020.
[28] Moria, H. (2017). Radiation distribution uniformization by optimized halogen lamps arrangement for a solar simulator. Proc Int Conf Ind Eng Oper Manag, 1499-1500.
[29] Tanesab, J., Ali, M., Parera, G., Mauta, J., Sinaga, R. (2019). A modified halogen solar simulator. In ICESC 2019: Proceedings of the 1st International Conference on Engineering, Science, and Commerce, ICESC 2019, 18-19 October 2019, Labuan Bajo, Nusa Tenggara Timur, Indonesia, 9. European Alliance for Innovation.