Yixin Shi | Ping Jiang* | Fujie Wang | Shuxian Zhou
© 2021 IIETA. This article is published by IIETA and is licensed under the CC BY 4.0 license (http://creativecommons.org/licenses/by/4.0/).
OPEN ACCESS
In order to promote pesticide application reduction and efficiency enhancement, to avoid the direct mixing of pesticides caused by secondary pollution and life safety risksand, further improve the mixing uniformity of on-line mixing system of crop protection equipment. The numerical simulation on structural parameters and fluid parameters of the mixer was performed by the CFD method to determine the best structural parameters of the mixer. And an injection online mixing system experiment platform was built. The experiments were carried out by high speed photography and spectrophotometry respectively. The experimental results show as following: The variable mixing ratio experiment was carried out in the case of pure reagents mixing test in the mixer. When the water flow is 140 L/min and the pesticide pressure is 1 MPa, the ratio of pesticide solution is controlled in the range of 1:300 ~ 1:3000, and the images of pesticide entering the mixer are collected respectively. The results of image analysis and processing show that the online mixing system has good mixing performance in qualitative analysis. When the mixing ratio is 1:300 to 1:300 and the normal pressure of pesticide is 0.1 MPa, the maximum mixing uniformity variation coefficient of the pesticide solution is 6.87%. When the mixing ratio is 1:300, the minimum mixing uniformity coefficient is 3.33%. It is proved that the overall trend of mixing uniformity variation coefficient increases with the increase of mixing ratio when the pesticide is mixed at normal pressure. When mixing under pressure, the mixing uniformity coefficient of variation is less than 5% and the maximum is 3.903%, which indicates that the mixing uniformity of the mixer is well when mixing under pressure. The results can improve pesticide utilization, safety of plant protection, reduce secondary pollution and reduce pesticide residues. Through the qualitative analysis of high-speed photography, it is found that the drug mixer has good time and space distribution uniformity in the process of drug mixing. The quantitative detection of spectrophotometry shows that the drug liquid has good time and space distribution uniformity after passing through the mixer. The conclusion of this paper has certain guiding function and reference value for plant protection technology and liquid on-line mixing in chemical and pharmaceutical fields.
injection online mixer, numerical simulation, mixing uniformity, variation coefficient, image analysis
At present, the traditional pre-mixing is usually used in the plant protection operation in agricultural production, and a few large plant protection machinery uses a simple premixed box to complete the pre-mixing. This kind of mixing method is wasteful for the use of pesticides, and the concentration of liquid can not be controlled accurately. With the rise of precision agriculture, it has become a development tendency of the crop protection equipment to realize online mixing technology of pesticide solution separation by separating the pesticide tank and water tank. And it is inevitable to develop an online mixing system with high level automation and better mixing effect [1-3].
The research content involved in the online mixing technology mainly includes three major directions, namely the design and optimization of the mixing device, namely mixer, the detection and evaluation of the mixing effect, and the research on fluid mixing theory and related control algorithm. Dai et al. [4] And the online mixing devices are mainly divided into two types: jet-type and injection-type. Zhou et al. [5] Many scholars have carried out a lot of research on the mixing device. In 1991, Ghate and Phatak [6] proposed compressed-air mixing device, which adjusts the injection dose of pesticides according to the speed of the machine. Mickaily-Huber et al. [7] proposed that placing enough obstacles inside the static mixer can induce disordered flow to promote mixing, but the pressure drop increases as the mixing unit increases. Sarvanan et al. [8] analyzed the structural parameters of the jet-type mixer based on the fluid dynamics method and found that the mixing effect of the jet-type mixer was greatly influenced by the nozzle diameter. Chen and Xu [9] used highspeed camera to capture the distribution of tracer particles in the mixture of pesticides and processed these images to analyze the mixing effect. Zangina et al. [10] Optimized the operation path of plant protection robot in greenhouse, achieving target spray and variable spray to reduce pesticide application. Gillis et al. [11] combines machine vision system with DIS to develop a variable sprayer for controlling roadside weeds. The experimental results show that the system can meet the flow demand of different numbers of nozzle opening and ensure pressure fluctuation within 10% range, but because the injection point is far away from the sprinkler, the concentration response delay is longer. Downey et al. [12] changed the above-mentioned system from hydraulic power to pneumatic power, and used it as injection power source and current carrying power source respectively. The results show that: the delay time from the response of drug supply to the appearance of the solution in the nozzle is in the range of 20 ~ 30 ms, and the time to reach the target concentration is more than 100 ms. Zhu et al. [13] studied the delay influencing factors of DNIS, and found that diaphragm pump is more suitable for drug delivery than aerodynamic and gear pump; for the mixing characteristics and delay relationship under the condition of continuous current carrying, pneumatic on-off valve was used. Zhu [14] obtained the relationship between the length diameter ratio of static mixers with different structures and the coefficient of variation (CV) of mixing uniformity based on experiments. Vondricka and Lammers [15]; Vondricka and Lammers [16] tried to add a mixing section in front of the nozzle to promote the uniform mixing of liquid medicine, and achieved good results. Luck et al. [17] evaluated the application of red rhodamine pigment as tracer in the experiment of measuring uniformity based on absorbance. The image processing method is another feasible method for uniformity evaluation, the above studies are relatively single test methods. Realpe and Velázquez [18] distinguished the concentration of suspension agent by comparing the gray value, and compared with the detection results obtained by spectrophotometer, it was found that the error was very small; Berthiaux et al. [19] studied the mixing uniformity of two different color powders by principal component analysis (PCA); Muerza et al. [20] used autocorrelation function to dynamically study the static mixing effect of two different color powder particles. Satjaritanun et al. [21] Used Taguchi method to optimize the internal structure of various mixers, such as blades, impellers, and wrong baffle slots. Through the mixing test of solid particles, the rotary impeller mixer was optimized. Adusei-Bonsu et al. [22] Carried out parameter optimization and mixing uniformity analysis of mechanical feed mixer for feed, in which the coefficient of variation was mainly used to judge the mixing uniformity. Alnakeeb et al. [23] Optimized and simulated the heat transfer performance of fin and tube heat exchanger by CFD method. The first factor considered was the pressure drop loss in the heat transfer process, which was the main factor in the fluid exchange process. Fatalla et al. [24] Studied the mass transfer and heat transfer rate of the inner wall of a simulated stirrer with a turbulence promoter, mainly considering the influence of the collective shape of the turbulence promoter on the heat transfer and diffusion. At present, most researchers use a single test method to study the mixing process. This paper proposes that the structure of the mixer should be optimized by simulation, and the image method should be combined with spectrophotometry. The qualitative and quantitative analysis of the mixing process is carried out.
In order to further improve the mixing accuracy and mixing performance of the online mixing system, this paper designs an injection mixer through the preliminary numerical simulation based on the high clearance crop protection equipment spray operation platform. The numerical simulation on structural parameters and fluid parameters of the mixer is performed by the CFD method to determine the best structural parameters of the mixer. And then the experiment is carried out to analyze the mixing performance of these mixers. Then qualitative and quantitative experiments were carried out to analyze the mixing performance of these mixers by high-speed photography and spectrophotometry. Through the closed loop control technology of precision mixing, the zero residual liquid after each operation is reduced, the mixing uniformity of the liquid is improved, the spraying effect is guaranteed, and the maximum efficiency of pesticide utilization is realized. At the same time, the technology reduces the pollution to the environment, effectively improves the working environment of the workers, and reduces the harm of pesticide volatilization to human health. it can effectively reduce the use of pesticides and reduce pesticide residues and secondary pollution.
2.1 Injection online mixing system
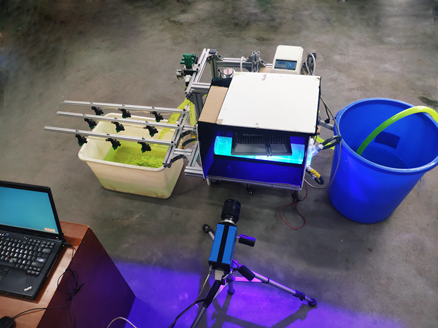
The injection online mixing system mainly includes water intake system, pesticide intake system, injection mixer, control system, spray system and relevant detection system, etc. As shown in Figure 1, a diaphragm pump, with a flow rate of 0-160 L/min, was selected in the water intake system. A pressure gauge was installed at the outlet of the diaphragm pump to read the real-time water pressure and ensure that the pipe pressure is kept basically stable through skimmer circuit. The pesticide intake system could realize the high-pressure injection of the pesticide solution through the combination of double pumps. Firstly, the pesticide solution passed through the peristaltic pump (Huiyu peristaltic pump BT100J-1A, the flow range is 0.07 to 380 ml/min, 18# hose is selected, and the peristaltic pump speed-flow equation is Q=0.00459r) to finish the precise supply of the pesticide solution, and then through the booster pump to complete the pressure of the pesticide solution. At the same time, a one-way valve was installed at the output end of the booster pump to prevent the pesticide solution reflux. And precise flow meter (Nanjing Ruiji, range 0.95-9.6L/h) was used to monitor the pesticide solution flow and provide real-time feedback to adjust the working state of the peristaltic pump. The control system was based on the STM32 development board. The water flow sensor was directly powered by the STM32 development board, with a range of 5-150 L/min. Peristaltic pump speed was controlled by STM32 development board through 485 bus in real time to accurately adjust the dosage. Pressure sensors were installed at the inlet and outlet of the mixer to read the circuit pressure in real time. Through the real-time data acquisition (pressure, flow rate) of water supply and drug supply unit, the accurate closed-loop feedback control of water supply and drug supply system is realized, so as to ensure the accurate ratio of mixing concentration and provide hardware platform support for the further realization of accurate and uniform mixing performance.
2.2 Injection mixer
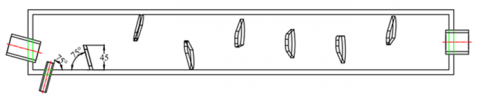
In order to realize the precision control of the mixing performance, it is necessary to study the mixing uniformity of the mixer, so as to provide technical support for the precision spray of the plant protection machine. The optimal design of the mixer is mainly studied by numerical simulation and test method. Design requirements JB / t7660-2016 industry standards. The injection mixer suitable for the injection online drug mixing system was designed based on the SK mixer optimization [21], as shown in Figure 2. The mixer possessed good mixing uniformity in the early simulation. Considering the design diameter-length ratio of the mixer and the actual installed size limit, the overall size was designed to be 700 mm in length and 100 mm in diameter. At the same time, according to the actual water flow and drug flow parameters, the diameter of the filling pipe end was selected to be 32 mm, the diameter of the injection port was selected to be 10 mm, and the diameter of the mixer outlet was 32 mm, and according to the simulation optimization results, the filling pipe end and the injection port were arranged vertically, and the first spoiler was 0.05 m away from the inlet. According to the author's previous research results, the filling pipe end and the injection port were arranged vertically, to ensure the turbulence effect after pesticide solution injection, the medicine injection port was set at an angle of 75 degrees with the axial direction of the mixer, and the first spoiler was 50 mm away from the filling pipe end. It was at an angle of 75 degrees opposite to the axis of the mixer, and 7 spoilers with a height of 45 mm and an angle of 75°, distributed along the spiral line of the inner wall of the mixer.
1 water tank; 2 filter; 3 check valve; 4 diaphragm pump; 5 proportional solenoid valve;
6, 13, 17 pressure gauge; 7 water flow meter; 8 medicine box; 9 peristaltic pump;
10 booster pump; 11 check valve; 12 medicine flow meter; 14 injection type medicine mixer;
15 medicine water total flow meter; 16 medicine water main valve; 18 nozzle;
19 purple light lamp; 20 high speed camera; 21 computer; A-1 water injection port;
B-1 injection port; C-1 pressure maintaining water overflow circuit
Figure 1. Schematic diagram of online mixing system
Figure 2. Structure diagram of mixer
2.3 Main test equipment
The image acquisition system for image method experiments mainly includes a highspeed camera (pco.1200 s) for image shooting, an image acquisition card from GRiS Company for image acquisition, and a LenovoR61 mobile workstation for data transmission analysis. As the system takes pictures for highspeed dynamic images, domestic LED black light lamps of 50W power are selected. Its wavelength is 395 nm in the range of 8-50 cm, and the wavelength matches the selected water-soluble fluorescence particles, so the motion of the mixture in the mixer can be accurately displayed.
The image acquisition software chooses the camera's own interface software, Camware3 of Pco company, which can control the camera shooting according to the demands, and it also equipped with functions such as adjusting the number of shooting frames, outputting images in multiple formats, and recording and replaying the captured pictures at the same time.
The equipment for quantitative analysis of mixed drug uniformity mainly uses the UVmini-1240 UV-Vis Spectrophotometer and has a set absorption wavelength of 507 nm.
3.1 CFD Model building of injection mixer
According to the design principle of the mixer and the installation position of the crop protection equipment, a built-in spoiler static mixer model was determined to be built with a main pipe with a diameter of 100 mm and a length of 700 mm, a 10 mm diameter injection port and a 32 mm filling pipe end, and 7 spoilers with a height of 45 mm and an angle of 75°, besides, the spoiler was staggered in the pipe in helical equidistance and the first spoiler faced the injection port with an angle of 75°. Firstly, the injection mixer was constructed with SolidWorks software in a 1:1 3D entity model. According to the requirements of actual operation parameters, it is known that the spray quantity is 140 L/min and the ratio of pesticide solution is 1:300 ~ 1:3000, the agronomic requirements of pesticide mixing ratio, The pesticide mix ratio is usually set to an integer multiple of 1:300. According to the Reynolds Number Formula (1) and turbulence intensity Formula (2), the Reynolds Number of the flow field in the mixer is 29533, which is in the complete turbulence interval. Therefore, a standard k-ɛ turbulence model can be applied in the flow field.
$\text{Re}=\frac{\text{D}\rho }{\mu }\times \frac{{{\text{V}}_{1}}+{{\text{V}}_{2}}}{{}^{1}/{}_{4}\pi {{\text{D}}^{2}}\times 3600}$ (1)
$\mathrm{I}=0.16(\mathrm{Re})^{-1 / 8}$ (2)
3.2 Pre-simulation processing and calculation
According to the potion ratio required by the experiment, the mixer was set with the following boundary conditions: The filling pipe end and injection port were set as the speed inlet to achieve rapid convergence, and the outlet was set as the pressure outlet. The interface was where the injection port and the injection port intersect with the inside of the mixer. The tube wall of the mixer was set as solid surface, etc. The detailed parameters are shown in Table 1.
According to the ICEM module in ANSYS 16.0, the mixer model was divided into blocks, and the mesh of the mixer injection port, filling pipe end and outlet were refined. And the whole grid area was partitioned by combining structure and unstructured grid. The mixer meshing generates 7,872,079 Total elements, 1,404,712 Nodes, Faces, 162,568 individual Cells. The meshing quality is excellent.
Table 1. Basic parameters and boundary condition settings
|
Item |
Filling pipe end |
|
Hydraulic diameter of filling pipe end/mm |
32 |
|
Hydraulic diameter of injection port/mm |
10 |
|
Water flow rate/m•s-1 |
2.9 |
|
Pesticide flow rate/m•s-1 |
0.01to0.1 |
|
mixing ratio |
1:300, 1:600, 1:900, 1:1000, 1:1500, 1:2000, 1:2500, 1:3000 |
|
Water density/kg•m-³ |
1000 |
|
Pesticide density/kg•m-³ |
1003 |
|
Filling pipe end pressure |
0.1 |
|
Injection port pressure/Mpa |
1, 0.1 |
|
Turbulence intensity/% |
5 |
Since the mixing of the crop protection equipment can be approximated as a relatively stable liquid mixing process, in this simulation, the steady-state model was selected for simulation, the simple algorithm was adopted as the solution equation, and the Second Order Upwind equation was set as the energy equation for discretization. Also, the residual and the liquid volume fraction at the exit were set as monitors, and the accuracy of convergence was set to 10-5, and convergence was calculated within 8,000 steps.
3.3 Analysis of simulation results
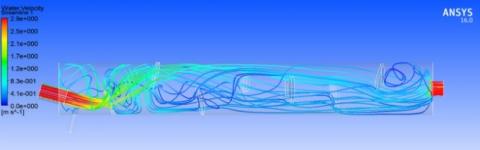
The software Fluent was used to simulate the mixer. Take the simulated data when the pesticide and water pressure are both 0.1 MPa and the potion ratio is 1:300 as an example, CFD-Post was used to process the data to obtain the velocity streamline distribution, as shown in Figure 3(a). And the cloud chart of solution volume fraction is shown in Figure 3(b).
It can be seen from Figure 3(a) that after the water solution is injected from the injection port, the water velocity in the mixer decreases gradually due to the obstruction of the spoiler, while the speed of pesticides injected into the mixer gradually increases with the flow of water. As the rate of the water flow is much faster than that of the pesticide flow, the pesticide and water were merged after the pesticide and water were injected into the mixer, then the mixture was cut by the spoiler to produce turbulence, which makes the mixture continuously divide and recombine, so that the pesticide and water can be gradually mixed. Moreover, when the two fluids enter the mixer, due to the large differences between the speed and density, so in the fluid mixing process, the mixer structure (spoiler) and the interaction between their own fluid. The two types of cutting can significantly accelerate the formation of turbulence and accelerate the fluid mixing.
(a) Water velocity flow diagram
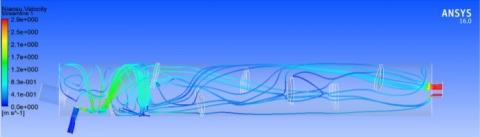
(b) Pesticide velocity flow diagram
Figure 3. Speed streamline diagram
Figure 4. Pesticide volume fraction cloud
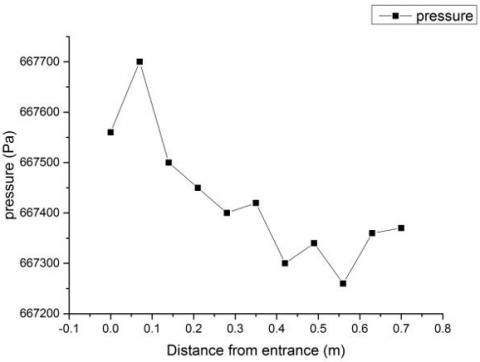
Figure 5. Internal pressure along the mixer
It can be seen from Figure 4(a) that after the pesticide and water are injected into the mixer, there is nearly no mixing between pesticide and water before flowing through the spoiler, and the stratification between the two is obvious. After the pesticide and water passing through the spoiler, the fluid before and after the spoiler generates turbulence, resulting in continuous dividing and recombination of the fluid, and the two can be seen gradually mixing in the cloud chart. The maximum volume fraction of pesticide at the injection port in the mixer is 1. As the pesticide is injected into the mixer, turbulence is generated by the spoiler and mixed with water, the volume fraction of pesticide drops sharply and the mixture uniformity of solution also improves continuously. Figure 4 (b~h) are all the cloud charts of the pesticide volume fraction at the cross section taken from the mixer to each spoiler. According to the figure, with the increase of the number of spoilers, the variation coefficient of the volume fraction of pesticides on the cross section decreases continuously, and the mixing uniformity improves continuously. After the mixed solution passed through the fourth spoiler, the solution was basically mixed evenly, and the subsequent concentration and volume fraction tended to be stable.
It is known that the first spoiler of the mixer is at 120 mm, and the last spoiler is at 680 mm. The point on the center line in the mixer is selected for pressure drop analysis, and the pressure drop is plotted as shown in Figure 5. It can be seen from Figure 5 that the pressure in the mixer decreases gradually as the distance between the spoiler and the inlet increases. In the mixer, before the solution flows through the spoiler, the pressure increases briefly due to the obstruction of the spoiler, but the pressure of the solution drops sharply behind the spoiler. The overall pressure loss in the mixer is less than 400 PA, and the pressure drop is mainly concentrated in the first half of the mixer. Because the solution at the back end has been basically mixed evenly, the smaller the pressure drop is, the greater the pressure drop is, the better the mixing uniformity is, which is consistent with the cloud image of pesticide volume fraction. With the increase of pressure drop, the faster the mixing process, the better the mixing uniformity.
In order to accurately judge the mixing performance of the mixer, a quantitative analysis was carried out on the numerical simulation results of the mixer. Taking into account the experimental subjects of this study, the feasibility of the software simulation and experimental verification, the variation coefficient CV was used as an indicator to evaluate the mixing effect. The coefficient of variation is the most important parameter to consider the mixing uniformity when the material and fluid are mixed. Many references cited in this paper use the coefficient of variation as the main parameter to evaluate the mixing uniformity. The value range of the variation coefficient CV was 0 to 1; when CV=1, it is considered that there is no mixing at all, and when CV≤5%, it can be regarded as uniformly mixed. $C V=\sigma / \bar{c}$. Where, σ: the standard deviation of the pesticide volume fraction; $\bar{C}$: the average volume fraction of the pesticide solution in the entire cross section [25]. The variation coefficient solution formula is shown in formula 3:
$\text{cv}=\frac{\sigma }{{\bar{c}}}=\frac{\sqrt{\frac{1}{N}\sum {{\left( ci-\bar{c} \right)}^{2}}}}{\frac{1}{N}\sum ci}$ (3)
where,
ci ——— the pesticide volume fraction in the i area;
σ ——— the standard deviation of the pesticide volume fraction;
$\bar{C}$ ——— the average volume fraction of the pesticide solution in the entire cross section.
For the optimized mixer model, when the drug pressure and water pressure were all 0.1 MPa, and the mixing ratios were 1:300, 1:600, 1:900, 1:1,000, 1:1,500, 1:2,000, 1:2,500, 1:3,000 respectively, taking the cross section at 120 mm, 220 mm, 320 mm, 400 mm, 4,800 mm, 560 mm, 680 mm away from the spoiler in the mixer. FLUENT (a commercial CFD software package) software was used to derive the volume fraction of pesticides in each cross section, and these volume fractions were calculated using formulas to obtain the variation coefficient of mixing uniformity at each cross section. See Table 2.
Table 2. Simulated values of variation coefficient of mixed uniformity at different distances at 0.1 MPa
|
mixing ratio |
120mm |
220mm |
320mm |
400mm |
480mm |
560mm |
680mm |
|
1:300 |
0.3058 |
0.1106 |
0.0675 |
0.0485 |
0.0432 |
0.0312 |
0.0237 |
|
1:600 |
0.2682 |
0.1139 |
0.0533 |
0.0381 |
0.0305 |
0.0358 |
0.0265 |
|
1:900 |
0.3183 |
0.1265 |
0.0773 |
0. 0427 |
0. 0331 |
0.0318 |
0.0279 |
|
1:1000 |
0.3185 |
0.1283 |
0.0782 |
0. 0435 |
0. 0361 |
0.0313 |
0.0283 |
|
1:1500 |
0.2756 |
0.1168 |
0.0529 |
0.0369 |
0.0307 |
0.0376 |
0.0278 |
|
1:2000 |
0.2756 |
0.1153 |
0.0513 |
0.0359 |
0.0308 |
0.0387 |
0.0276 |
|
1:2500 |
0.2580 |
0.1076 |
0.0541 |
0.0404 |
0.0341 |
0.0328 |
0.0262 |
|
1:3000 |
0.2566 |
0.1096 |
0.0555 |
0.0420 |
0.0346 |
0.0308 |
0.0263 |
Table 3. Simulated values of variation coefficient of mixed uniformity at different distances at 1 MPa
|
mixing ratio |
120mm |
220mm |
320mm |
400mm |
480mm |
560mm |
680mm |
|
1:300 |
0.2703 |
0.1172 |
0.0573 |
0.0414 |
0.0344 |
0.0346 |
0.0235 |
|
1:600 |
0.2684 |
0.1139 |
0.0533 |
0.0379 |
0.0304 |
0.0344 |
0.0263 |
|
1:900 |
0.2708 |
0.1150 |
0.0521 |
0.0361 |
0.0307 |
0.0364 |
0.0266 |
|
1:1000 |
0.2716 |
0.1153 |
0.0521 |
0.0360 |
0.0307 |
0.0366 |
0.0267 |
|
1:1500 |
0.2760 |
0.1153 |
0.0516 |
0.0357 |
0.0307 |
0.0365 |
0.0275 |
|
1:2000 |
0.2754 |
0.1167 |
0.0528 |
0.0368 |
0.0307 |
0.0367 |
0.0274 |
|
1:2500 |
0.2573 |
0.1095 |
0.0548 |
0.0411 |
0.0339 |
0.0328 |
0.0261 |
|
1:3000 |
0.2566 |
0.1096 |
0.0557 |
0.0422 |
0.0350 |
0.0308 |
0.0262 |
It can be seen from Table 2 that as the number of spoilers increases, the variation coefficient of mixing uniformity decreases gradually, which reveals that adding spoiler inside the mixer can contribute to solution mixing. When the mixing ratio of the pesticide solution was 1:300, the mixing uniformity coefficient of the solution was less than 0.05 after the fourth spoiler, that is, at 400 mm inside the mixer, which means that the pesticide solution has been mixed evenly at 400 mm. When the mixing ratio of pesticide solution is in the range of 1:300 to 1:3000, and the variation coefficient of mixing uniformity at the outlet of the mixer is less than 0.05, which indicates that the optimized mixer has an excellent mixing effect.
In order to verify the effect of pesticide pressure on the mixing uniformity of the mixer, the mixer was numerically simulated as follows. The ratio of the pesticide solution is 1:300 to 1:3000, the inlet pressure of pesticide was set at 1 MPa and the water injection outlet pressure was set at 0.1 MPa. The variation coefficient of the mixing uniformity of the mixer under the pesticide pressure is obtained by calculation processing, as shown in Table 3.
It can be seen from Table 3 that the mixing uniformity of the mixer under pressuring is slightly better than that in normal pressure. When the mixing ratio was 1:300, the variation coefficient of the mixing uniformity of the mixer reached the minimum value 0.0235, and the mixing worked the best. At a distance of 400 mm from the water inlet, that is, after the 4th spoiler, after mixing the potions evenly, the variation coefficient could be obtained as 0.0414 and 0.0235 at the outlet of the mixer. Then, the mixing ratio was increased and the mixer model was simulated and analyzed. When the ratio of pesticide to water was 1 to 3,000, the variation coefficient of mixing uniformity at the outlet of the mixer was 0.0262, which met the requirement of less than 5%. Therefore, it is concluded that all the mixing effect is better during the proportion change of mixing 1:300-1:3000, and the mixer can meet the mixing demand.
4.1 Experimental conditions
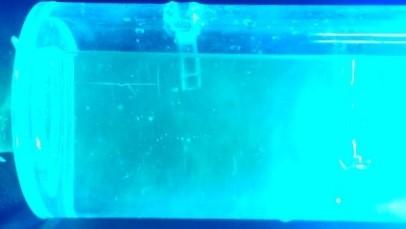
Due to the precipitation and suspension of pesticides during mixing process, simple quantitative analysis cannot be used as the only evaluation criterion for evaluating the mixing performance of pesticide in online mixing system. Therefore, the image analysis method based on highspeed photography was used to conduct qualitative analysis on the mixing performance of the injection online mixing system. High speed photography is mainly used to detect the spatial uniformity of mixing device in laboratory environment, and to detect the time uniformity in mixing process by collecting images at intervals. Based on the working principle of the pesticide pressurized online mixing system, an experimental platform for the qualitative analysis of the mixing performance of the system was set up, as shown in Figure 6.
Figure 6. Qualitative analysis test bench of online medicine mixing system
4.2 Experiment method
In the experiment, based on the image processing method of highspeed photography, qualitative analysis was performed on the mixing uniformity of the injection online mixer. Because this paper mainly focuses on the analysis of the mixing performance of pesticide online mixing system, it is necessary to filter and process the images collected by the highspeed camera. And the image processing software chooses MATLAB (a commercial mathematics software). The working process is as follows Figure 7.
Figure 7. Image processing flow
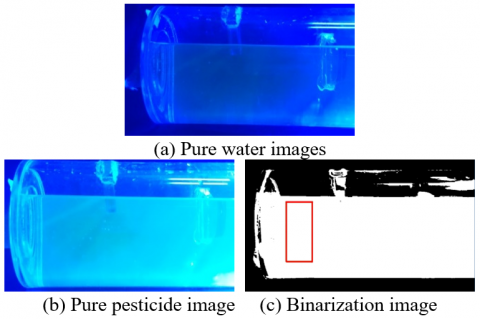
Before the experiment, the pixels of the aqueous solution and pesticide solution are calibrated as follows, instead of water-soluble pesticide, water-soluble phosphor solution was used to prepare pure pesticide (fluorescent powder) solution; the drug pump was turned off and the water pump was controlled to fetch water to capture the aqueous solution image (A); the water pump was turned off and the drug pump was controlled to extract the pure chemical (fluorescent powder) pure pesticide solution image (B). The MATLAB was used to subtract the image (imsubtract (A, B)) for background removal and denoising. The region of interest was selected for binarization processing, and the mixer exit position was set as the region of interest as shown in the figure. and the size of the region of interest was 250 pixels*600 pixels; The region of interest was binarized, and the normalized threshold value was 0.2, and the pixels greater than 0.2 were counted in the area of interest as 1, which means the aqueous solution containing fluorescent particles; programming was carried out in MATLAB, and the picture with the largest area of the aqueous solution containing fluorescent particles was selected under different mixing ratios to conduct analysis; the region of interest uniformly was divided in the axial and radial directions, its gray values were read separately, and drawn into figures to determine the distribution of axial and radial gray values in the region of interest when the pesticide solution was evenly mixed; mixer pictures of potions were collected in different proportions, and pre-processing was conducted on these pictures, and the region of interest was divided according to the above steps, their gray values were read respectively. A figure was drawn to analyze their mixing uniformity. Determine the distribution of the mixture of the area of interest.
4.3 Experiment of mixed drug performance
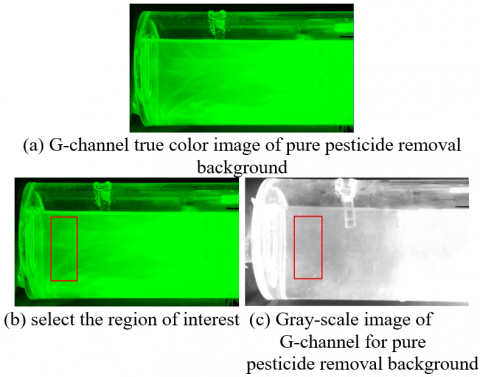
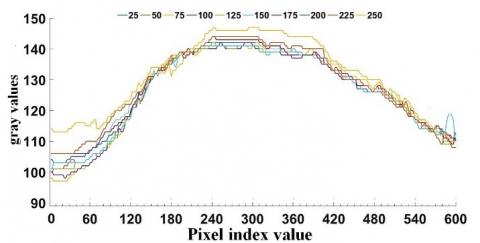
Before the experiment, the collected images of pure pesticides were analyzed to find out the distribution of pixels when the images were evenly mixed. After literature review and experiments in the early stage, it is proved that the image G channel for analysis is fairly straightforward. Therefore, the G channel of image acquisition was selected for analysis. As shown in Figures 8(a-c), firstly, after the denoising and background removal of the pure pesticide image, the pure water image was subtracted from the pure pesticide image, and a background-removed image could be obtained, finally, channel separation was carried out for the image with background removed to obtain the true color image of G channel, as shown in Figures 9 (a-c). The region of interest was selected on the image, and the axial and radial pixels were analyzed in the region of interest. The region of interest was evenly divided into ten regions in the axial and radial directions, and by using the MATLAB programming algorithm, the distribution of pixels in the region was graphically displayed as shown in Figure 10.
Figure 8. Image preprocessing
Figure 9. Image acquisition and preprocessing
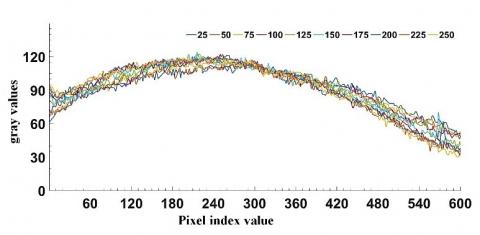
(a) The radial pixel gray value of the region of interest
(b) The axial pixel gray value of the region of interest
Figure 10. Pure pesticide axial and radial pixel distribution
It can be seen from Figure 10 that pixel values are normally distributed in myopia in the radial direction of the region of interest and they are low on both sides and high in the middle, this is because the mixer itself is cylindrical, and the area of the pesticide solution in the middle area is larger than that on both sides, resulting in the light of the middle is a slightly brighter than that on both sides. In the axial direction, the pixels remain stable as a whole, and the degree of fluctuation is small. This is because the concentration of pesticides in the front and back ends of the mixer is balanced within the region of interest. It also indicates that the solution mixed inside the mixture is more evenly mixed.
The variable mixing ratio experiment was performed after the pure agent mixing experiment of mixer. When the water flow was 140 L/min and the pesticide pressure was 1 MPa, the pesticide solution ratio was controlled in the range of 1:300 to 1:3000. After that the images of the pesticide entering the mixer were collected respectively. The results of image analysis and processing indicate that the designed online mixing system shows excellent medicine mixing performance in qualitative analysis.
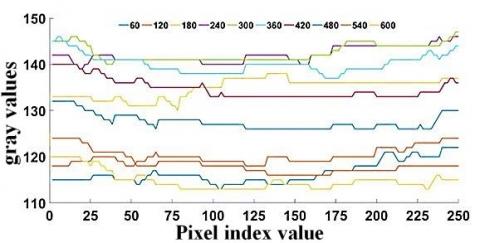
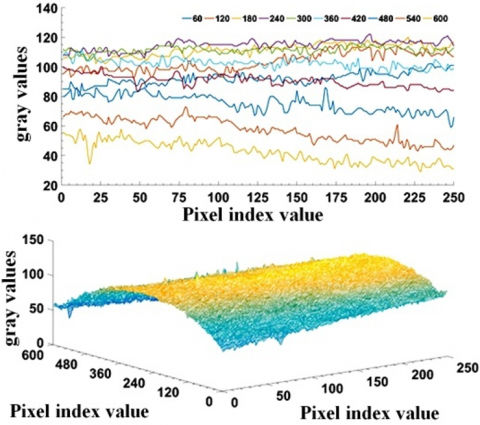
The Figure 11(a) with the largest proportion of pesticide solution was obtained through algorithm analysis. The figure was at frame 15, that is, the figure was obtained when it took 0.015s for the pesticide to enter the mixer until it was evenly mixed. According to the preliminary experiment, the G channel of the collected image was selected for analysis. After the denoising and background removal of images, the region of interest was divided into pixels, and according to the experimental method, the pixels in the axial and radial directions were divided into ten equal parts, and the gray value of each area is drawn as Figure 11(c).
It can be seen from Figure 10 that the pixel has small fluctuations in the axial direction, and the pixel gray value interval is small as well, indicating that there is well mixing uniformity in the axial direction. The middle pixel is slightly larger than the middle pixel in the radial direction, and the difference is not significant. The whole is approximately a normal distribution. And the overall trend of axial and radial pixels is consistent with that of the pure pesticide image. The qualitative analysis of the 3D pixels in the region of interest shows that the system has better pesticide solution mixing performance when performing qualitative analysis.
(a) The radial pixel gray value of the region of interest
(b) The axial pixel gray value of the region of interest
(c) The area of interest is axial and radial pixel distribution when the potion ratio is 1: 300
Figure 11. The area of interest isl pixel distribution when the potion ratio is 1: 300
5.1 Experiment method
Before the experiment, a carmine standard solution curve was established. And 5 copies of carmine solution with a mass concentration of 3 g/L were prepared to replace water-soluble pesticides, the sample solution was diluted to 1.0, 1.5, 2.0, 2.5, 3.0 mg/L standard samples, and pure water was taken as a blank control. The experiment equipment used Shimadzu Corporation UVmini-1240 ultraviolet-visible spectrophotometer to set the absorption wavelength to 507 nm, and the absorbance of the mixture was measured. MATLAB software and the least square method were used to process the absorbance data of the sample solution. According to the requirement of the ratio of the pesticides, the ratio coefficient was input and the flow data collected by the water flow sensor was read by the control unit. According to the actual ratio requirements, the speed of the peristaltic pump was controlled through the RS-485 bus, and the actual pesticide flow rate was adjusted according to the required ratio. In order to meet the requirements of this experiment, measuring cups were placed under the nozzle and samplings were performed to detect the mixing stability and uniformity of the online mixing system under different injection pressures and solution ratios. The quantitative detection of spectrophotometry shows that the drug liquid has good time and space distribution uniformity after passing through the mixer.
5.2 Experimental study on mixing uniformity of mixing system under different mixing ratios
Mixing uniformity is one of the important indicators to evaluate the mixing effect of mixer. In this paper, the actual concentration under different ratios is obtained according to the absorbance of the carmine mixed solution under different proportions of the solution. The mixture uniformity of the pesticide solution in the injection mixer was tested on the experimental platform of pressurization and normal pressure. The water flow rate was set to 140 L/min, the mixing ratios of the potion and water were changed within the range of 1:300 to 1:3000. The samplings were carried out under the same nozzle for 2 min in each group. Samples were taken for 2 min in each group and randomly sample 10 times in each sampling period, and the single sampling time was 2s. Spectrophotometry was used to detect the samples, and the system mixing uniformity experiment was carried out on the pharmaceutical normal pressure and pressure experiment platform, that is, when the pesticide pressure was 0.1 MPa and 1 MPa respectively. After collating and calculating the medicine taking data, the variation coefficient of mixing uniformity was obtained under different injection pressures and mixing ratios, as shown in Table 4.
It can be seen from Table 4 that when the mixing ratio is 1:300-1:3000 and the pesticide is under normal pressure 0.1MPa, the maximum variation coefficient of pesticide mixing uniformity is 6.87%, at this time, the mixing ratio is 1:3000. And when the mixing ratio is 1:300, the minimum mixing uniformity coefficient becomes 3.33%. Thus, it can be proved that when pesticides are mixed under normal pressure, the overall trend of the variation coefficient of mixing uniformity increases with the increase of the mixing ratio. The reason may be that the ratio of pesticide solution increases, the flow of pesticide is too small, and the internal pressure of the mixer is greater than the pressure of the drug taking pipe, so the pesticide cannot be injected into the mixer as needed. However, when mixed under pressure and within the range of the experimental syrup ratio, the variation coefficient of mixing uniformity is less than 5%, and the maximum is 3.903%, which shows that the mixer has well mixing uniformity during pressure mixing.
Table 4. Coefficient of mixing at mixer outlet with different pressure and mixing ratio
|
Mixing ratio |
Mean mass concentration/(mg·L-1) |
Standard deviation/(mg·L-1) |
Variation coefficient/% |
|||
|
0.1MPa |
1MPa |
0.1 MPa |
1 MPa |
0.1 MPa |
1 MPa |
|
|
1:300 |
10.415 |
10.126 |
0.335 |
0.239 |
3.330 |
2.358 |
|
1:600 |
4.977 |
5.044 |
0.191 |
0.112 |
3.836 |
2.220 |
|
1:900 |
3.263 |
3.447 |
0.157 |
0.088 |
4.819 |
2.558 |
|
1:1000 |
2.884 |
3.122 |
0.129 |
0.105 |
4.487 |
3.449 |
|
1:1500 |
1.963 |
2.081 |
0.066 |
0.070 |
3.353 |
3.355 |
|
1:2000 |
1.512 |
1.477 |
0.090 |
0.058 |
5.974 |
3.903 |
|
1:2500 |
1.078 |
1.237 |
0.071 |
0.047 |
6.565 |
3.805 |
|
1:3000 |
0.960 |
1.001 |
0.070 |
0.023 |
6.87 |
2.304 |
5.3 Experimental study on mixer uniformity under different water flow
It is known that changes in water flow will affect the mixing effect of the online mixing system. To ensure that the designed mixing system has a well mixing effect, change the water amount of diaphragm pump at each mixing ratio, and conduct the experiment on the mixing performance of the system. When the mixing ratio was 1:300, 1:500, 1:1,000, 1:1,500, 1:2,000, 1:2,500, 1:3,000, the opening of variable ratio solenoid valve was changed by control unit to adjust the water intake. Under different mixing ratios and water flow rates, samples with measuring cups were taken in the same nozzle, the time was set for each sampling as 2 min, and randomly sample 10 times in each sampling period. The single sampling time was 2 s, and the absorbance of each sample solution was recorded, the variation coefficient of uniformity was calculated by formula (3). As shown in Figure 12:
Figure 12. Online mixing system variable working condition test curve
It can be seen from the Figure 12 that the mixing uniformity coefficient of the online mixer decreases with the increase of the water flow rate, which is consistent with the fact that the turbulent kinetic energy increases and the liquid mixing effect improves with the increase of the water flow rate. In the range of 300:1-3000:1 of pesticide solution ratio, when the water flow changes between 35-140 L/min, the mixing uniformity coefficient of the online mixing system is less than 5%, which proves that the designed injection mixer has a well mixing uniformity.
An injection mixer has been designed through simulation analysis and optimization design. The simulation results show that the designed injection online mixer has lower variation coefficient in different mixing ratio under normal pressure and pressure injection conditions, indicating a well mixing uniformity. When the ratio of pesticide to water was 1 to 3,000, the variation coefficient of mixing uniformity at the outlet of the mixer was 0.0262, which met the requirement of less than 5%.
A qualitative experiment on the uniformity of the mixer mixture was carried out on the experiment platform. The experimental results shows that the mixing uniformity of the injection online mixer is well in the qualitative analysis, which is consistent with the numerical simulation results. At the same time, a quantitative experiment of the homogeneity of the mixer was carried out on the experiment platform by changing the pesticide pressure and the ratio of pesticide solution, and the experiment results were compared with the numerical simulation one to further verify the uniformity of the mixing. Through the qualitative analysis of high-speed photography, it is found that the drug mixer has good time and space distribution uniformity in the process of drug mixing. The quantitative detection of spectrophotometry shows that the drug liquid has good time and space distribution uniformity after passing through the mixer.
The uniformity quantitative experiment was carried out within the range of 1:300 to 1:3000 of the mixing ratio of pesticide solution, and the ultraviolet spectrophotometry was adopted to measure the mixture sprayed on the system. The results show that the injection online mixer has good mixing uniformity under different pressure, mixing ratio and variable working conditions, and the variation coefficient of mixing uniformity is less than 5%.
We acknowledge support from the National Key Research and Development Program of China (Grant No.: 2017YFD0700903-2), the Hunan Key Research and Development Program (Grant No.: 2019NK2141, 2020GK2075).
[1] Yuan, Q.B., Hu, L., Luo, X.W. (2016). Design and experiment of online mixing spraying system. Transactions of the Chinese Society for Agricultural Machinery, 47(Sl): 176-181.
[2] Li, Z., Song, S.R., Hong, T., Sun, D., Xue, X., Dai, Q. (2018). Online drug mixing technology and prospect in pesticide spraying. Journal of Agricultural Mechanization Research, 40(1): 1-6.
[3] Singla, S.K., Garg, R.D., Dubey, O.P. (2020). Ensemble machine learning methods to estimate the sugarcane yield based on remote sensing information. Revue d'Intelligence Artificielle, 34(6): 731-743. https://doi.org/10.18280/ria.340607
[4] Dai, X., Xu, Y., Song, H., Chen, J., Kuang, L., Ma, L. (2018). Mixing uniformity analysis methods and in-line mixing experiments of mixer under variable working conditions. Transactions of the Chinese Society for Agricultural Machinery, 49(10): 172-179.
[5] Zhou, L.F., Fu, X.M., Xue, X.Y. (2013). Design and experiment of jet mixing apparatus based on CFD. Transactions of the Chinese Society for Agricultural Machinery, 44(S1): 107–112.
[6] Ghate, S.R., Phatak, S.C. (1991). A compressed air direct injection pesticide sprayer. Applied Engineering in Agriculture, 7(2): 158-162. https://doi.org/10.13031/2013.26225
[7] Mickaily-Huber, E.S., Bertrand, F., Tanguy, P., Meyer, T., Renken, A., Rys, F.S., Wehrli, M. (1996). Numerical simulations of mixing in an SMRX static mixer. The Chemical Engineering Journal and the Biochemical Engineering Journal, 63(2): 117-126. https://doi.org/10.1016/0923-0467(96)03093-X
[8] Saravanan, K., Sundaramoorthy, N., Mohankumar, G., Subramanian, N. (2010). Studies on some aspects of jet mixers I: Hydrodynamics. Modern Applied Science, 4(3): 51-59. https://doi.org/10.5539/mas.v4n3p51
[9] Chen, J.Y., Xu, Y.L. (2019). Analysis method of pesticide on-line-mixing uniformity based on principal component analysis. Journal of Forestry Engineering, 4(1): 121-127.
[10] Zangina, U., Buyamin, S., Abidin, M.S.Z., Mahmud, M.S.A. (2021). Agricultural rout planning with variable rate pesticide application in a greenhouse environment. Alexandria Engineering Journal, 60(3): 3007-3020. https://doi.org/10.3390/met11020309
[11] Gillis, K.P., Giles, D.K., Slaughter, D.C., Downey, D. (2003). Injection mixing system for boomless, target–activated herbicide spraying. Transactions of the ASAE, 46(4): 997-1008. https://doi.org/10.13031/2013.13954
[12] Downey, D., Crowe, T.G., Giles, D.K., Slaughter, D.C. (2006). Direct nozzle injection of pesticide concentrates into continuous flow for intermittent spray applications. Transactions of the ASABE, 49(4): 865-873. https://doi.org/10.13031/2013.21726
[13] Zhu, H., Ozkan, H.E., Fox, R.D., Brazee, R.D., Derksen, R.C. (1998). Mixture uniformity in supply lines and spray patterns of a laboratory injection sprayer. Applied Engineering in Agriculture, 14(3): 223-230. https://doi.org/10.13031/2013.19380
[14] Zhu, H. (1997). Reducing metering lag and nonuniformity for injection sprayers applying highly viscous fluids.
[15] Vondricka, J., Lammers, P.S. (2009). Real-time controlled direct injection system for precision farming. Precision Agriculture, 10(5): 421-430. https://doi.org/10.1007/s11119-008-9093-x
[16] Vondricka, J., Lammers, P.S. (2009). Evaluation of a carrier control valve for a direct nozzle injection system. Biosystems Engineering, 103(1): 43-48. https://doi.org/10.1016/j.biosystemseng.2009.02.008
[17] Luck, J.D., Shearer, S.A., Luck, B.D., Payne, F.A. (2012). Evaluation of a rhodamine-WT dye/glycerin mixture as a tracer for testing direct injection systems for agricultural sprayers. Applied Engineering in Agriculture, 28(5): 643-646. https://doi.org/10.13031/2013.42424
[18] Realpe, A., Velázquez, C. (2003). Image processing and analysis for determination of concentrations of powder mixtures. Powder Technology, 134(3): 193-200. https://doi.org/10.1016/S0032-5910(03)00138-4
[19] Berthiaux, H., Mosorov, V., Tomczak, L., Gatumel, C., Demeyre, J.F. (2006). Principal component analysis for characterising homogeneity in powder mixing using image processing techniques. Chemical Engineering and Processing: Process Intensification, 45(5): 397-403. https://doi.org/10.1016/j.cep.2005.10.005
[20] Muerza, S., Berthiaux, H., Massol-Chaudeur, S., Thomas, G. (2002). A dynamic study of static mixing using online image analysis. Powder Technology, 128(2-3): 195-204. https://doi.org/10.1016/S0032-5910(02)00197-3
[21] Satjaritanun, P., Regalbuto, J.R., Regalbuto, J.A., Tippayawong, N., Shimpalee, S. (2021). Mixing optimization with inward flow configuration contra-rotating impeller, baffle-free tank. Alexandria Engineering Journal, 60(4): 3759-3779. https://doi.org/10.1016/j.aej.2021.02.045
[22] Adusei-Bonsu, M., Amanor, I. N., Obeng, G.Y., Mensah, E. (2021). Performance evaluation of mechanical feed mixers using machine parameters, operational parameters and feed characteristics in Ashanti and Brong-Ahafo regions, Ghana. Alexandria Engineering Journal, 60(5): 4905-4918.
[23] Alnakeeb, M.A., Saad, M.A., Hassab, M.A. (2021). Numerical investigation of thermal and hydraulic performance of fin and flat tube heat exchanger with various aspect ratios. Alexandria Engineering Journal, 60(5): 4255-4265. https://doi.org/10.1016/j.aej.2021.03.036
[24] Fathalla, A.S., Amin, N.K., El-Ashtoukhy, E.S.Z., Sedahmed, G.H. (2021). Mass and heat transfer intensification at the wall of a square agitated vessel by chemically active semicylindrical turbulence promoters. Alexandria Engineering Journal, 60(5): 4775-4786. https://doi.org/10.1016/j.aej.2021.03.066
[25] Shi, Y., Jiang, P., Wang, F., Zhou, S. (2020). Optimization design of online mixing apparatus and mixing performance experiment for crop protection equipment. Instrumentation, Mesures, Métrologies, 19(6): 405-412. https://doi.org/10.18280/i2m.190601