Influence of H2O on Oxygen Enriched Diffusion Combustion of Natural Gas

Xiang He* | Xin Ren | Fanjin Zeng | Yindi Zhang | Yue Xin | Qinghai Chen
© 2021 IIETA. This article is published by IIETA and is licensed under the CC BY 4.0 license (http://creativecommons.org/licenses/by/4.0/).
OPEN ACCESS
O2/H2O combustion technology, as the next generation of oxy-fuel combustion technology with great potential, can greatly increase the utilization rate of clean energy CH4. In this paper, the natural gas combustion process under 6 operating conditions of O2/H2O atmosphere and O2/FH2O atmosphere is numerically simulated. The horizontal analysis is carried out on the characteristics of H2O fraction, CO2 volume fraction and the amount of pollutants (NOx, carbon black), and in-depth exploration of the content of additive H2O and the influence of chemical action on the above characteristics. The research results show that the chemical effects of H2O have a negative effect on combustion temperature, and the physical effects are dominant. The chemical effects of H2O have a great impact on CO production and little effect on the production of CO when the proportion of H2O is 65-79%. The chemical effects of H2O inhibit the formation of NOx and carbon black when the proportion of H2O is within the range of 55-70%. The chemical effect has the greatest impact on the formation of dyes (NOx, carbon black) when the proportion of H2O is within the range of 65-70%.
O2/H2O combustion, numerical simulation, oxygen enrichment, temperature, pollutants
As one of the most widely used technologies in modern industrial combustion, oxy-fuel combustion technology has low risk and high feasibility and high efficiency. The new O2/H2O oxy-fuel combustion technology can greatly increase the utilization rate of clean energy CH4 [1-3], and its combination with the production process of natural gas hydrate can effectively promote the development of natural gas industry, and alleviate global warming and environmental pollution from the source.
As the next generation of oxy-fuel combustion technology with great potential, O2/H2O combustion technology does not need to recycle the flue gas, and the combustion temperature adjustment is achieved by using water vapor to participate in the combustion process. This new type of oxy-fuel combustion technology can make the entire combustion system more concise and compact, and the start-stop process is easier. It not only reduces the system cost [4-6], but also makes full use of the waste heat of the flue gas, thus reducing the loss of waste heat, and avoiding the problem of impurity gas enrichment in O2/CO2 flue gas cycle more effectively [7-10]. Scholars at home and abroad have conducted extensive theoretical and experimental research on oxy-fuel combustion technology, most of which are related to the combustion characteristics, pollutants (NOX, carbon black) of oxy-fuel combustion in O2/N2, O2/CO2 atmospheres and the basic research work on the physicochemical effects of additives, but lack of application research of O2/H2O combustion technology. O2/H2O combustion technology has its unique advantages in terms of combustion characteristics and pollutant emissions. Therefore, a full understanding of the effect of additive H2O on oxygen-enriched diffusion combustion is of great significance to the development of O2/H2O oxy-fuel combustion technology [11].
Therefore, it is necessary to analyze the different working conditions under O2/H2O atmosphere to have a clearer understanding of O2/H2O combustion technology and the influence of H2O on oxygen enriched diffusion combustion of natural gas, and to provide more sufficient basic theoretical support for the industrial application of O2/H2O combustion technology in the future. Thus, this paper analyzes the distribution of combustion temperature and pollutant (NOx, carbon black) generation under the same O2 concentration and different H2O concentration conditions, and explores the influence characteristics of H2O content on combustion temperature, CO volume fraction, CO2 volume fraction and pollutant (NOx, carbon black) concentration. By analyzing the differences of combustion temperature, CO volume fraction, CO2 volume fraction and pollutant (NOx, carbon black) generation under different conditions of O2/H2O atmosphere and O2/FH2O atmosphere with the same concentration proportion, the influence of chemical action of H2O additive on oxygen enriched diffusion combustion was studied. Furthermore, the optimal concentration range of O2 and H2O in oxidant was determined by overall comparative analysis.
2.1 Mathematical model
In the process of numerical simulation, the standard model and the general finite rate model are selected as the turbulent flow model and the combustion model respectively; each radiation heat transfer model needs to be comprehensively considered in the applicable occasions, calculation amount, calculation accuracy, and hardware CPU performance requirements. Thus, the p-1 model is defined as the radiation heat transfer model; the probability density function (pdf) model is used as a mathematical model of the nitrogen oxide pollutant reaction mechanism and information transmission process, and the NO concentration transport equation provided by Fluent is used to predict the emission of NOx and pollutants.
$\frac{\partial }{\partial t}\left( \rho {{Y}_{NO}} \right)+\nabla \cdot \left( \rho \bar{v}{{Y}_{NO}} \right)=\nabla \cdot \left( \rho D\nabla {{Y}_{NO}} \right)+{{S}_{NO}}{{Y}_{NO}}$ (1)
In the above formula, r is the density, YNO is the volume fraction of NO, D is the diffusion coefficient, SNO is the generation rate of NO, t is the time, $\bar{v}$ is the average rate;
The single-step Khan and Greeves model is selected for the carbon black generation model. In terms of the gas phase chemical reaction mechanism, it adopts the same four-step simplified reaction mechanism as the combustion form of CH4.Separation solver, implicit format, finite volume method, and SIMPLE algorithm are used to solve the calculation.
2.2 Geometric model
2.2.1 Model simplification
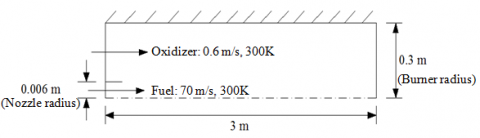
In this paper, the cylindrical burner is used in the simulation, and the geometric model is established by using fluent preprocessing software gambit. The simplified geometric shape and size are shown in Figure 1. It can be clearly seen from the figure that the whole length of the burner is 3 m, the radius is 0.3m, and there is a nozzle with a radius of 0.006m in the middle. The fuel methane enters the burner along the nozzle, and the oxidant enters the annular area of the combustion chamber inlet (excluding the nozzle), mixes with methane and burns, diffuses into the combustion chamber at the same time, and finally produces turbulent diffusion flame. In order to obtain a clearer diffusion flame, an outer wall is installed to separate the flammable methane and oxidizer, and the length of the outer wall is specified as 0.05m.
Figure 1. Schematic diagram of burner structure
2.2.2 Grid division
After the model is built, perform numerical calculation and mesh division. The detailed steps are to divide the spatially continuous solution area into multiple small sub-areas, and confirm each node separately. There are many factors that need to be considered in the division of the grid, so the workload will be relatively large. The grid format (such as structured and unstructured grid) of the division can directly affect the accuracy and complexity of the calculation results. Generally, the accuracy of the calculation result can be judged by the number of grids: the more grids, the higher the accuracy of calculation, but the calculation efficiency is low; the number of grids is small, the calculation accuracy is low and even the convergence cannot be achieved. Thus, the correct and reasonable grid division is the prerequisite for ensuring high-quality grids.
Gambit software is used to divide the overall grid of the solution area, and the grid division diagram is shown in Figure 2. Considering that solving the regional data structure is relatively simple, a quadrilateral structured grid is adopted to ensure the formation of high-quality grids in a short time. The overall presentation is graded grid, that is, along the axial gas flow, the grid is increasingly sparse, while considering a number of important areas have great impacts on the calculation results, such as gas inlet, exterior in the vicinity and inside the burner, the divided grids need to be encrypted. A total of 20300 nodes and 20075 grid cells are divided.
Figure 2. Grid division diagram
2.3 The mechanism of gas phase chemical reaction and solving method
(1) To simplify the calculation complexity and improve the efficiency, the four-step simplified chemical reaction mechanism of methane combustion is adopted:
$\begin{align} & C{{H}_{4}}+2H+{{H}_{2}}O=CO+4{{H}_{2}} \\ & CO+{{H}_{2}}O=C{{O}_{2}}+{{H}_{2}} \\ & H+H+M={{H}_{2}}+M \\ & {{O}_{2}}+3{{H}_{2}}=2H+2{{H}_{2}}O \\ \end{align}$ (2)
(2) The solver used in the simulation is a separate pressure-based separation solver, which solves the control equations in sequence. In the process of discretizing nonlinear partial differential equations, to directly transform the nonlinear partial differential equations into linear algebraic equations on a grid element, the finite volume method can be considered. We can choose the standard format as the pressure interpolation format. The momentum equation, the turbulence kinetic energy equation, the turbulence dissipation rate equation, the component mass conservation equation and the energy equation can all be selected as the first-order upwind scheme, because it has the remarkable characteristics and advantages of the second-order upwind scheme such as high stability and fast calculation speed. SIMPLE algorithm is widely used in the actual research and calculation of fluid mechanics and computational heat transfer, and its sub-relaxation factor is a numerical calculation method that can be widely used to calculate the flow of objects at any velocity, and the range of sub-relaxation factor can be expanded in an appropriate amount. Accordingly, this paper will use the SIMPLE algorithm to solve the pressure-velocity coupling scheme. In the setting of the residual value, the residual value of the energy equation and the P-1 radiation heat transfer equation is set to 10-6, and the other governing equations are all set to 10-4. In setting the sub- relaxation factor, the sub-relaxation factors of pressure, momentum, $k$ and $\varepsilon $ are set to 0.3, 0.7, 0.8 and 0.8 respectively.
2.4 Governing equation
Establishing the governing equation is the first step of numerical simulation. A general form of the governing equation is established to facilitate the analysis of each governing equation [12-16]:
$\begin{align} & \frac{\partial }{\partial x}\left( \rho u\phi \right)+\frac{\partial }{r\partial r}\left( r\rho v\phi \right)+\frac{\partial }{r\partial \theta }\left( \rho w\theta \right)= \\ & \frac{\partial }{\partial x}\left| {{\Gamma }_{\phi }}\frac{\partial \phi }{\partial x} \right|+\frac{\partial }{r\partial r}\left| r{{\Gamma }_{\phi }}\frac{\partial \phi }{\partial r} \right|+\frac{\partial }{{{r}^{2}}\partial \theta }\left| {{\Gamma }_{\phi }}\frac{\partial \phi }{\partial \theta } \right|+{{s}_{\phi }} \\ \end{align}$ (3)
In the above equation, j is the universal dependent variable, Gj is the transport coefficient, Sj is the source term, r is the density, x, r, q respectively represent the axial coordinates, radial coordinates, circumferential coordinates, u, v, w respectively represent the component of the velocity vector in the x, r, q direction. (1) When j=1, Gj=0, it represents the continuity equation; (2) When j=u, v, w, it represents the momentum equation corresponding to the direction; (3) When j=k, it represents the turbulent energy equation; (4) When j=e, it represents the turbulent energy dissipation rate equation; (5) When j=f, it represents the equation of conservation of component mass; (6) When j=h, it represents the energy equation. Where k is the turbulent kinetic energy, eis the turbulent energy dissipation rate, f is the mass fraction, and h is the enthalpy.
3.1 Boundary conditions
The fuel methane nozzle was set as the velocity inlet boundary, and the velocity was 70m/s. In this case, the turbulence intensity and hydraulic diameter were set at 10% and 0.006m respectively, and the temperature was set at 300K. The velocity inlet boundary was set at the oxidant inlet. When H2O was added to the oxidant, it was necessary to ensure that the content of O2 added each time remained unchanged, while the content of the additive H2O gradually increased (or decreased). Taking the working condition CH4/21%O2/79%H2O and the flow rate of the oxidant 0.6m/s as the benchmark. The flow rates of the oxidant in the set conditions were successively calculated as 0.42m/s, 0.36m/s, 0.315m/s, 0.28m/s and 0.252m/s. The turbulence intensity and hydraulic diameter were set at 10% and 0.294m, respectively, and the temperature was set at 300K.The outlet of the burner was set as the pressure outlet boundary, the gauge pressure was set as 0, and the turbulence intensity and hydraulic diameter were set as 10% and 0.3m respectively. At the same time, the backflow at the pressure outlet should also be considered. The other boundaries were set as wall boundaries, and since burner walls usually have cooling devices, the wall temperature was specified as 300K.
3.2 Calculation conditions
In view of the particularity of the chemically active substance H2O, it is necessary to consider its chemical action as the key point. Thus, a fictional substance FH2O is set up, which has the same thermal properties, transport properties and radiation properties as H2O, but does not participate in chemical reactions.
Six working conditions (21%O2, 30%O2, 35%O2, 40%O2, 45%O2, 50%O2) were selected for the numerical simulation of natural gas oxygen-enriched diffusion combustion in the O2/H2O atmosphere. FH2O was added to the oxidant instead of H2O, and the same boundary conditions and working conditions were set. The specific calculation working conditions are shown in Table 1.
Table 1. Calculation conditions
|
Calculation conditions |
Gas species |
Velocity, m/s |
||
|
fuel |
CH4 |
70 |
||
|
oxidizer |
O2/H2O atmosphere |
case1 |
21%O2/79%H2O |
0.6 |
|
case2 |
30%O2/70%H2O |
0.42 |
||
|
case3 |
35%O2/65%H2O |
0.36 |
||
|
case4 |
40%O2/60%H2O |
0.315 |
||
|
case5 |
45%O2/55%H2O |
0.28 |
||
|
case6 |
50%O2/50%H2O |
0.252 |
||
|
O2/FH2 Oatmosphere |
case7 |
21%O2/79%FH2O |
0.6 |
|
|
case8 |
30%O2/70%FH2O |
0.42 |
||
|
case9 |
35%O2/65%FH2O |
0.36 |
||
|
case10 |
40%O2/60%FH2O |
0.315 |
||
|
case11 |
45%O2/55%FH2O |
0.28 |
||
|
case12 |
50%O2/50%FH2O |
0.252 |
||
4.1 Effect of additive H2O content on oxy-fuel diffusion combustion
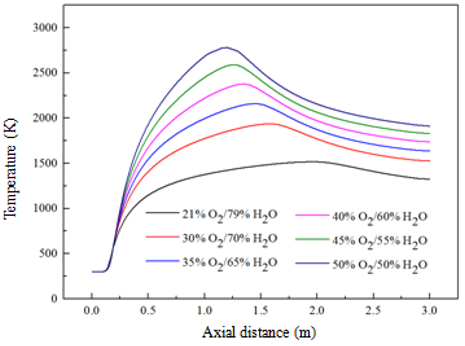
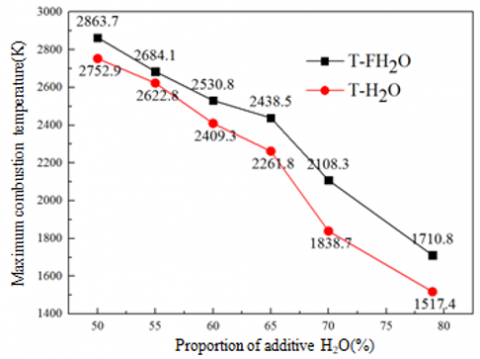
Figure 3 shows the distribution curve of combustion temperature on the central axis under 6 working conditions.
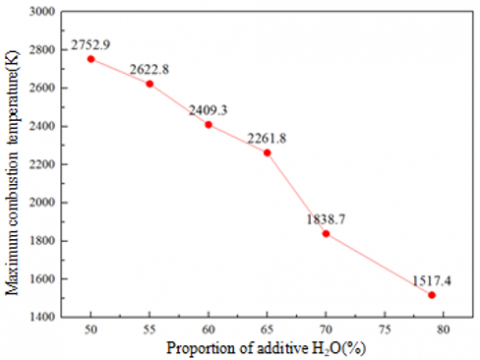
As shown in the figure, the combustion temperature gradually decreases with the increase of the content of additive H2O.In the axial direction, the effect of H2O addition on combustion temperature increases first and then decreases. According to calculation, the maximum combustion temperature under six working conditions is 1517.4K, 1838.7K, 2261.8K, 2409.3K, 2622.8K and 2752.9K respectively. As shown in Figure 4, when the proportion of additive H2O is in the range of 65%-70%, the decrease rate of the maximum combustion temperature is the fastest, which indicates that the addition of H2O in this concentration range has the greatest impact on the combustion temperature in the whole burner.
Figure 3. Distribution of combustion temperature on the central axis
Figure 4. Maximum combustion temperature in six operating conditions
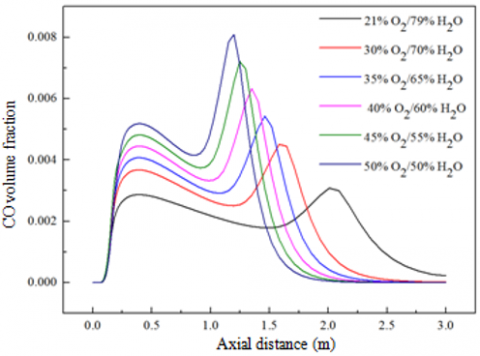
As products in the combustion process, the production of CO and CO2 will inevitably be affected by the concentration of reactants H2O. Figure 5 shows the distribution curves of CO volume fraction and CO2 volume fraction on the central axis under 6 working conditions. As shown in Figure 5(a), within the zones Z=0-0.25m and Z=2.5-3.0m, CO production remained almost unchanged with the increase of additive H2O content; within the zones Z=0.25-1.5m, CO production decreased with the increase of additive H2O content; within the zones Z=1.5-2.5m, with the increase of the content of additive H2O, the amount of CO production also increases. As shown in Figure 5(b), CO2 production decreases with the increase of the content of additive H2O, that is, the addition of H2O inhibits CO2 generation. In the axial direction, the influence degree of H2O addition on CO2 production shows a trend of first increasing, then decreasing and then increasing.
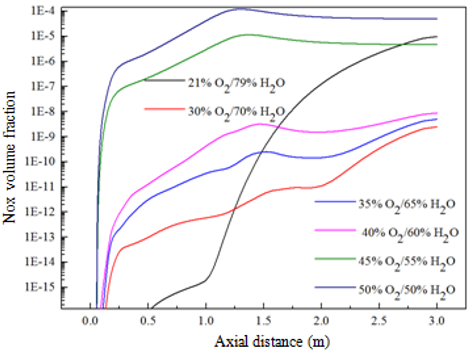
Figure 6 shows the distribution curve of NOx volume fraction on the central axis under 6 working conditions. As shown in the figure, the volume fraction of NOx in the condition of 21%O2/79%H2O spikes in the axial direction, which may be due to the combustion temperature below 1600K in the condition. The factor affecting the generation of NOx is the length of time that the reactants stay in the high temperature zone, while the high concentration of H2O in the oxidizer does not participate in the reaction at the beginning. As a result, the production of NOx will increase rapidly with the extension of retention time before the combustion reaction reaches chemical equilibrium [17-20]. The overall analysis of the other 5 working conditions shows that the NOx production decreases with the increase of the content of H2O additive. And when the proportion of additive H2O is in the range of 55%-60%, the addition of H2O has the greatest influence on NOx generation. In the axial direction, the effect of H2O addition on NOx generation increases at first and then decreases [21].
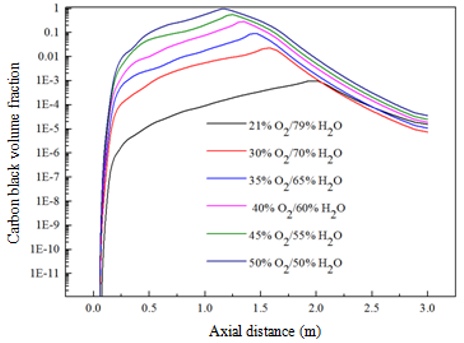
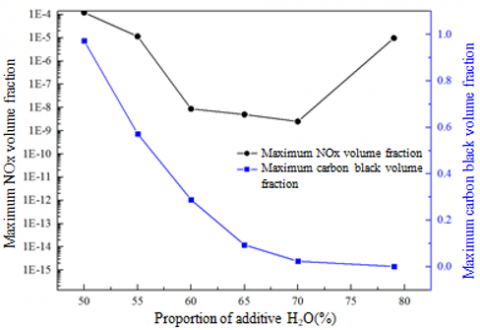
Figure 7 shows the distribution curve of carbon black volume fraction on the central axis under 6 working conditions. According to the figure, within the zone Z=0-0.25m, the amount of carbon black production almost remained unchanged with the increase of the additive H2O content; within the zone Z=0.25-1.5m, the amount of carbon black production decreased with the increase of the additive H2O content; within the zone Z=1.5-3.0m, the amount of carbon black production decreased with the increase of the additive H2O content. In the axial direction, the effect of the addition of H2O on the carbon black production increased at first and then decreased until it was almost unaffected. As shown in Figure 8, the change curve of the maximum volume fraction of pollutant NOx and carbon black with the increase of additive H2O content shows that, when the proportion of additive H2O is within the range of 55%-60%, the addition of H2O inhibits the generation of pollutants in the whole burner, and the inhibition effect is the largest.
(a) COVolume fraction
(b) CO2Volume fraction
Figure 5. Volume fraction distribution on the central axis
Figure 6. Distribution of NOx volume fraction on the central axis
Figure 7. Distribution of soot volume fraction on the central axis
Figure 8. Volume fraction of maximum pollutants (NOx, soot) in six operating conditions
4.2 Effect of chemical action of additive H2O on oxy-fuel diffusion combustion
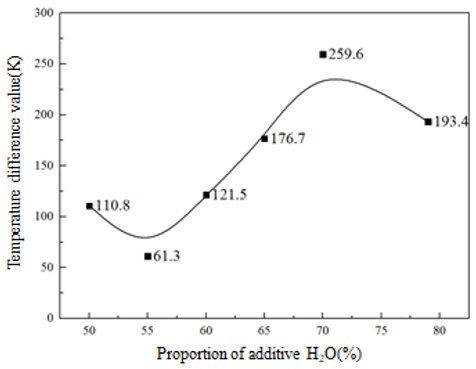
In order to distinguish the influence of chemical action on oxygen-rich diffusion combustion, the simulation results of six working conditions in O2/H2O atmosphere were compared with those in O2/FH2O atmosphere, and the difference between the two was caused by chemical action. Figures 9 and 10 are the comparison of the maximum combustion temperature under two atmospheres and the fitting curve of temperature difference respectively. The temperature differences under conditions of 50%H2O, 55%H2O, 60%H2O, 65%H2O, 70%H2O and 79%H2O were calculated as 193.4K, 259.6K, 176.7K, 121.5K, 61.3K and 110.8K, indicating that when high concentration of H2O is added to the oxidizer, in the process of CH4 oxy-fuel diffusion combustion, there will be chemical action, which has a negative impact on combustion temperature. With the increase of additive H2O content, the temperature difference decreases first, then gradually increases, and then decreases. The chemical action has the greatest impact on combustion temperature when the proportion of additive H2O is in the range of 65%-79%.
Figure 9. Comparison of the highest combustion temperatures
Figure 10. Fitting the temperature difference
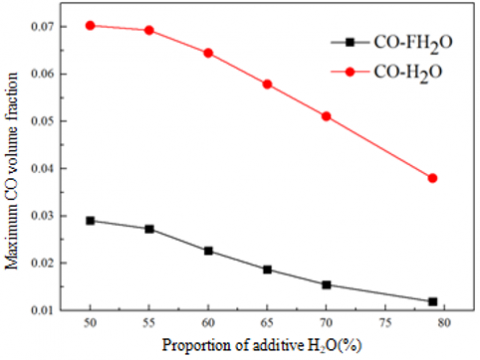
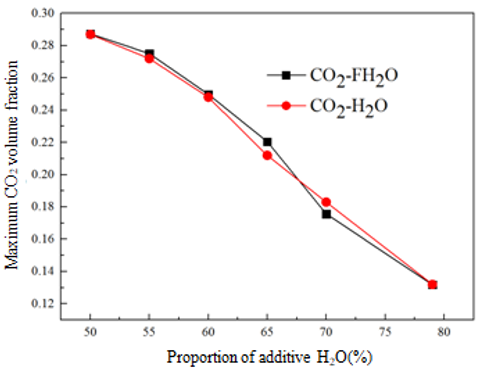
Figure 11 shows the contrast curves of the maximum CO volume fraction and the maximum CO2 volume fraction under the O2/H2O atmosphere and the O2/FH2O atmosphere respectively. The comparison shows that the chemical effect of H2O has a great influence on the generation of CO, and can promote the generation of CO to a large extent in the reaction process. On the whole, the chemical effect of H2O has little effect on the generation of CO2, and it can be considered that it is completely affected by physical effects, and the chemical effect can be ignored. More specifically, it has a slight inhibition effect on CO2 generation when the additive H2O proportion is in the range of 50%-65%, and can slightly promote CO2 generation when the additive H2O ratio is in the range of 65%-79%.
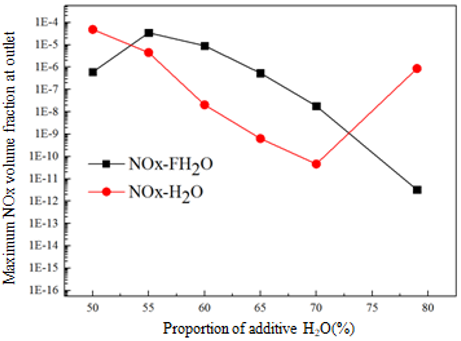
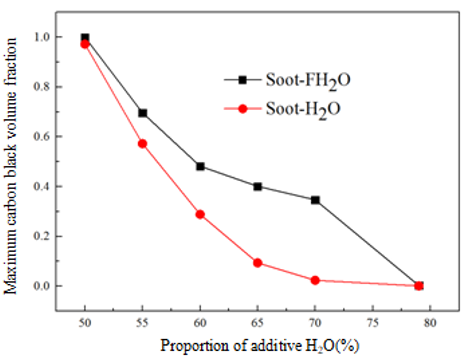
Figure 12 shows the contrast curves of the maximum NOx volume fraction and the maximum carbon black volume fraction at the outlet under six working conditions under two atmospheres. As shown in Figure 12(a), the chemical effect of H2O promotes the generation of NOx when the content of H2O is in the range of 50%-55% and 70%-79%; the chemical effect of H2O has an inhibitory effect on the generation of NOx, and the inhibitory effect is the most obvious when the content of H2O is in the range of 55%-70%. As shown in Figure 12(b), the chemical action of H2O also inhibits the generation of carbon black, and the influence is greatest when the content of H2O is in the range of 65%-70%. In general, the addition of H2O can inhibit the generation of pollutants (NOx, carbon black) in the combustion process when the content of H2O is in the range of 55%-70%, and the inhibition effect on pollutants is the best when the content of H2O is in the range of 65%-70%.
(a) CO volume fraction
(b) CO2 volume fraction
Figure 11. Highest volume fraction comparison
In order to more intuitively observe the effect of chemical action on methane oxy-fuel diffusion combustion degree, and compared with the physical action, determine its primary and secondary position in the reaction process. Table 2 shows the proportion of chemical inhibition on combustion temperature and pollutants (NOx, carbon black) when the proportion of additive H2O is 65% and 70%. In the table,jT, jNOx andjSoot represent the corresponding proportions respectively. As can be seen from the table, in the inhibition effect of H2O on combustion temperature, physical effect plays a dominant role (accounting for more than 85%), while chemical effect has a small effect (accounting for less than 10%). In the inhibition effect of H2O on the production of pollutants (NOx, carbon black), chemical action and physical action play an equal role (both are about 50%). In the process of oxy-fuel diffusion combustion, the generation of pollutants is inhibited at the same time.
(a) Maximum NOx volume fraction
(b) Maximum soot volume fraction
Figure 12. Comparison of maximum volume fraction at the outlet
Table 2. Proportion of chemical inhibition
|
|
65%H2O |
70%H2O |
|
jT |
6.76% |
11.34% |
|
jNOx |
49.97% |
49.73% |
|
jSoot |
43.37% |
48.24% |
In this paper, based on the principle of constant O2 concentration and gradient change of H2O concentration, the boundary conditions and calculation conditions required in the simulation were determined. The combustion process under six different conditions of O2/H2O atmosphere and O2/FH2O atmosphere were numerically simulated. From the characteristics of combustion temperature, CO volume fraction, CO2 volume fraction and pollutant (NOx, carbon black) production, the horizontal analysis was carried out, and the influence rules of additive H2O content and chemical action on the above characteristics were deeply explored. The conclusions were as follows:
(1) The chemical effect of H2O has a negative influence on the combustion temperature, and the physical action plays a dominant role. The chemical action has the greatest influence on the combustion temperature when the proportion of H2O is in the range of 65-79%.
(2) The chemical effect of H2O has a great influence on the generation of CO, and has a significant promotion effect on the production of CO; the chemical effect of H2O has little effect on the generation of CO2, which is almost negligible, and it is completely controlled by the physical effect.
(3) The chemical effect of H2O has a significant inhibitory effect on the formation of NOx when the proportion of H2O is in the range of 55%-70%; the chemical effect of H2O inhibits the formation of carbon black; the chemical effect has the greatest influence on the formation of dyes (NOx, carbon black) when the proportion of H2O is in the range of 65-70%.
Based on the above research and analysis, the optimal concentration range of H2O can be determined to be 65-79% based on the influence of H2O content and chemical effect on combustion temperature and pollutant generation.
The authors gratefully expressed their thanks for the financial support for this research from the National Natural Science Foundation of China (Grant No.: 51974033), from the Yangtze Youth Talents Fund (Grant No.: 2015cqt01), from College Students' Innovation and Entrepreneurship Project (Grant No.: 2019314, Yz2020272).
|
Y |
volume fraction |
|
D |
diffusion coefficient |
|
S t |
generation rate time, s |
|
$\overline{v}$ |
average rate, m. s-1 |
|
Greek symbols |
|
|
r |
density, kg. m-3 |
|
j |
universal dependent variable |
|
Gj |
transport coefficient |
|
x, r, q |
axial coordinates, radial coordinates, circumferential coordinates |
|
u, v, w |
the component of the velocity vector in the x, r, qdirection, m. s-1 |
[1] Toftegaard, M.B., Brix, J., Jensen, P.A. (2010). Oxy-fuel combustion of solid fuels. Progress in Energy and Combustion Science, 36(05): 581-625. https://doi.org/10.1016/j.pecs.2010.02.001
[2] Seepana, S., Jayanti, S. (2010). Steam-moderated oxy-fuel combustion. Energy Conversion and Management, 51(10): 1981-1988. https://doi.org/10.1016/j.enconman.2010.02.031
[3] Lyu, L.S. (2014). Experimental and numerical study of combustion characteristic of single char particle in O2/CO2and O2/H2O atmospheres. Master dissertation. Department of Thermal Engineering, Huazhong University of Science & Technology, Wuhan, Hubei, China.
[4] Mazas, A.N., Fiorina, B., Lacoste, D.A., et al. (2011). Effects of water vapor addition on the laminar burning velocity of oxygen-enriched methane flames. Combustion and Flame, 158(12): 2428-2440. https://doi.org/10.1016/j.combustflame.2011.05.014
[5] Sebastian, G., Marc, F., Gilles, B. (2013). Influence of steam dilution on the combustion of natural gas and hydrogen in premixed and rich-quench-lean combustors. Fuel Processing Technology, 107(1): 14-22. https://doi.org/10.1016/j.fuproc.2012.06.019
[6] Cai, L., Zhou, C., Jia, H.Q., He, Y.Z., Guo, F., Zheng, C.G. (2015). Experimental studies on the ignition of pulverized coal particles in O2/N2 and O2/H2O atmospheres. Journal of Engineering Thermophysics, 36(05): 1139-1142.
[7] Cong, T.L., Dagaut, P. (2009). Experimental and detailed modeling study of the effect of water vapor on the kinetics of combustion of hydrogen and natural gas, impact on NOx. Energy & Fuels, 23(2): 725-734. https://doi.org/10.1021/ef800832q
[8] Sheng, L. (2015). Simulation and comparative analysis of O2/H2O and O2/CO2oxy-combustion coal-fired power plants. Master dissertation. Department of New Energy Science and Engineering, Huazhong University of Science & Technology, Wuhan, Hubei, China.
[9] Wall, T., Gupta, R., Khare, S. (2005). Oxy-fuel technology for sequestration-ready CO2 and emission compliance. the 30th International Technical Conference on Coal Utilization and Fuel Systems 2005:523-534, Clearwater, Florida, USA.
[10] Dong, G., Huang, Y., Chen, Y.L. (2000). Study of effects of different chemical reaction mechanisms on computation results for methane jet turbulence diffusion flame. Journal of Fuel Chemistry and Technology, 28(1): 49-54. https://doi.org/10.1007/s11769-000-0027-4
[11] Dam, B.K., Love, N.D., Choudhuri, A.R. (2013). Flame stability of methane and syngas oxy-fuel steam flames. Energy & Fuels, 27(1): 523-529. https://doi.org/10.1021/ef301574d
[12] He, Z.X., Wang, Q., Yuan, J.P. (2014). Numerical Calculation Method and Application of Thermal Fluid. China Machine Press.
[13] Zhou, L.X. (1991). Numerical Simulation of Turbulent Two-Phase Flow and Combustion. Tsinghua University Press.
[14] Lugvishchuk, D.S., Kulchakovsky, P.I., Mitberg, E.B. (2018). Soot formation in the methane partial oxidation process under conditions of partial saturation with water vapor. Petroleum Chemistry, 58(5): 427-433. https://doi.org/10.1134/S0965544118050109
[15] Yang, H.L., Zhao, D.Q. (2006). The role played by CO2diluted fuel in suppressing NOx formation during an oxygen-enriched diffusion combustion process. Journal of Engineering for Thermal Energy and Power, 26(l): 43-47. https://doi.org/10.3969/j.issn.1001-2060.2006.01.011
[16] Zhao, D.Q., Yang, H.L., Lu, G.J., et al. (2006). Research of stratification characteristics of methane/oxygen-enriched diffusion flame. Journal of Engineering Thermophysics, 27(z2): 131-134. https://doi.org/10.3321/j.issn:0253-231X.2006.z2.035
[17] Fenimore, C.P. (1971). Formation of nitric oxide in premixed hydrocarbon flames. Symposium on Combustion, 13(1): 373-380. https://doi.org/10.1016/S0082-0784(71)80040-1
[18] Skjoth-Rasmussen, M.S., Glarborg, P., Ostberg, M., et al. (2004). Formation of polycyclic aromatic hydrocarbons and soot in fuel-rich oxidation of methane in a laminar flow reactor. Combustion and Flame, 136: 91-128. https://doi.org/10.1016/j.combustflame.2003.09.011
[19] Barnes, F.J., Bromly, J.H., Edwards, T.J., Madngezewsky, R. (1988). NOx emissions from radiant gas burners. Journal of the Institute of Energy, 61.
[20] Li, M.F. (2018). Simulation study on NOx emission characteristics of pulverized coal oxy-fuel combustion. Master dissertation. Department of Thermal Engineering, Dalian University of Technology, Wuhan, Hubei, China.
[21] Yang, H.L. Study on combustion characteristics and NOx emission of methane/oxygen-enriched diffusion flame. Ph.D. dissertation. Department of Thermal Science and Engineering, University of Science and Technology of China, Hefei, Anhui, China.