Wei Liu
© 2021 IIETA. This article is published by IIETA and is licensed under the CC BY 4.0 license (http://creativecommons.org/licenses/by/4.0/).
OPEN ACCESS
The energy conservation of campus buildings is the most direct and effective means to promote the sustainable development of colleges and universities. Using the heat data collected by heat supply monitoring platform to perform real-time energy consumption analysis and heating energy efficiency evaluation is a prerequisite for realizing automatic heat supply control based on energy conservation and heating demand. This paper studied the energy conservation analysis and comprehensive energy efficiency evaluation of campus central heating system based on the heat supply monitoring platform. At first, the paper elaborated on the energy consumption analysis method of the campus central heating system based on the heat supply monitoring platform; then, it gave the energy balance equation and the exergy balance equation; after that, based on a few parameters such as the EHR (electricity to heat ratio), heating index, and water makeup rate, this paper evaluated the energy efficiency of the campus central heating system, and experimental results verified the effectiveness of the analysis and evaluation methods.
monitoring platform, campus central heating system, energy consumption analysis, energy efficiency evaluation
With the progress of urbanization in China, the energy consumption of buildings is on the rise. Relevant research warned that, if no effective energy-saving measure is taken, it’s estimated that by 2030, the energy shortage of building energy consumption will exceed 30%, and the annual electricity consumption and standard coal consumption will reach 1.6 trillion kilowatt-hours and 650 million tons, respectively [1-3]. Now in China, there’re more than 3,000 higher educational schools, the number of students and faculty members on campus is more than 40 million, and the energy consumption of campus buildings accounts for about 7.5% of the total social energy consumption [4, 5]. Therefore, the energy conservation of campus buildings is the most direct and effective means to promote the sustainable development of colleges and universities [6, 7]. In recent years, the Internet of Things (IoT) is developing rapidly, building an IoT-based campus heat supply monitoring platform can effectively improve the controllability and management efficiency of heat supply on campus, thereby realizing the goal of reasonable and efficient use of energy [8-10].
The transformation of heating systems based on energy management contracts has the advantage of gaining a win-win situation for cooperative enterprises [11-17]. To facilitate the calculation of the energy-saving space of heating systems in special environment, Shen et al. [18] constructed an analysis model of system energy consumption and indicator diagnosis that comprehensively considered the differences among regions and heat supply types, and gave a detailed introduction to the analysis methods of energy consumption indicators of heating systems such as horizontal and vertical comparison analysis methods. Martin-Du Pan et al. [19] proposed a method for determining the energy consumption reference value of heating systems based on standard indoor temperature of buildings and gave a real-time analysis method of energy consumption indicators. Ichinose et al. [20] simplified the calculation process of the energy consumption reference value of regional heating systems with different meteorological parameters, their method effectively solved the data processing problems caused by incomplete heating data and complex calculations in engineering practice. Olorunmaiye and Awolola [21] reformed the water source heat pumps and gas boilers in a heating system of regional community buildings, they built a comprehensive evaluation system of central heating system from the perspectives of energy consumption, renovation cost, and environmental protection, and assigned proper weight values for the evaluation indicators. Based on the statistical data of energy and water consumption during the heating period of a normal university, Karatasou et al. [22] calculated the operating efficiency of the heat source, the delivery efficiency of the supply and return water pipe network, and the separate hydraulic balance of each building; the also gave a few countermeasures for improving the energy efficiency and adjusting the hydraulic balance. Based on the heating data of different types of buildings and heat exchange stations provided by the regional heat supply monitoring platform, Rim et al. [23] plotted the indoor temperature and heat supply curves under different heating demand conditions, and analyzed the differences in energy efficiency of regional heat supply under the intermittent heating mode.
The regulation and control of the operating conditions of the campus central heating system need to consider various factors such as the changes in the heat amount supplied by the heat source, and the water pressure of the heat supply pipe network, etc. [24-28], therefore, using the heat data collected by the heat supply monitoring platform to perform real-time energy consumption analysis and heating energy efficiency evaluation is a prerequisite for realizing automatic heat supply control based on energy conservation and heating demand. However, currently there’re few relevant studies, so in order to fill in this research gap, this paper proposed a new method for analyzing the energy consumption of campus central heating system based on a campus heat supply monitoring platform, and a new method for evaluating the comprehensive energy efficiency of the heating system. The second part of the paper elaborated on the new energy consumption analysis method of the campus heating system based on the heat supply monitoring platform, and gave the energy balance equation and the exergy balance equation; the third part of the paper evaluated the energy efficiency of the campus central heating system using a few parameters such as EHR, heating index, and water makeup rate of the system; at last, the paper used experimental results to verify the effectiveness of the proposed analysis and evaluation methods.
2.1 The energy balance method
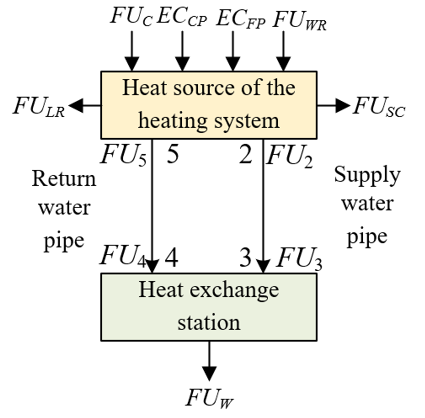
Figure 1. Energy flow model of the water supply pipe network of campus central heating system
A campus central heating system mainly consisted of three parts: the heat source, the supply water pipe network, the return water pipe network, and the heat exchange station. Figure 1 shows the energy flow model of the system. Within the time limit of this research, it’s assumed that, F, R, and D respectively represent the fuel consumption of the heat source of the campus heating system, the water consumption of the heat source of the campus heating system, and the electricity consumption of the auxiliary machine of the heat source of the campus heating system; WBLO represents the lower heating value (LHV) of the fuel; ΣWL, ΣWRD, and ΣWEC respectively represent the heating value of the fuel, the equivalent heat of the water consumption, and the equivalent heat of the electricity consumption of the auxiliary machine of the heat source, then there are ΣWL=F∙WBLO and ΣWc=ΣWL+ΣWEC+ΣWRD. Suppose ΣWR represents the actual annual heat supply of the heat source of the campus heating system, then, the comprehensive efficiency of the heat source δ1 can be described by Formula 1:
$\delta_{1}=\frac{\sum W_{R}}{\sum W_{c}}$ (1)
During the operation period of the central heating system, properties of the heating medium such as temperature and flow would change in real time, and its enthalpy value would also change accordingly. Suppose eP and eC respectively represent the enthalpy of the supply and return heating medium at a certain time moment, and H(t) represents the flow of the heating medium, then, the actual heat supply of the heat source of the campus heating system can be calculated by Formula 2:
$\sum W_{R}=\int_{t_{1}}^{t_{2}} H(t)\left(e_{P}-e_{C}\right) d t$ (2)
Within the time limit of the research, suppose WE represents the heat dissipation of the heating medium at the heat source outlet; ψP and ψC respectively represent the temperature of the supply and return heating medium at a certain time moment; t1 and t2 represent the start and end time of heating; SH represents the specific heat capacity of the heating medium; σ represents the density of the heating medium flowing through the heat meter; then, the effective heat utilization efficiency δ2 of the boiler room or the thermal power plant can be expressed as Formula 3:
$\delta_{2}=\frac{W_{E}}{\sum W_{R}+\sum W_{E C}+\sum W_{R D}}$ (3)
The value of WE can be calculated by Formula 4:
$W_{E}=\int_{t 1}^{t 2} \sigma \cdot S H \cdot H(t)\left[\psi_{P}(\tau)-\psi_{C}(\tau)\right] d t$ (4)
Suppose: ΣES*(e2-e1) represents the actual heat supply output by the heat exchange station of the campus heating system; ΣWES-e represents the total heat obtained by the heat exchange station; R* and D* respectively represent the water consumption of the heat exchange station and the electricity consumption of the auxiliary machine of the heat source; then, the heat exchange efficiency of the heat exchange station δ4 can be expressed by Formula 5:
$\delta_{4}=\frac{\sum E S^{*}\left(i_{2}^{*}-i_{1}^{*}\right)}{\sum W_{E S-e}+D^{*} w_{D S}+R^{*} w_{R}}$ (5)
The delivery efficiency of the primary pipe network from the first-stop heat source to the heat exchange station δ5 can be calculated by Formula 6:
$\delta_{5}=\frac{\sum W_{E S-e}}{W_{E}} \times 100 $0/0 (6)
2.2 The exergy balance method
This paper adopted the black box model to analyze the exergy balance of the campus central heating system. The system has two processes: the steam turns into hot water through heat source exchange, and the hot water returns to heat source through the supply and return water pipe network. This paper analyzed the exergy of the heating system according to the flow direction of heat energy and constructed the corresponding exergy analysis model, see Figure 2.
Figure 2. Exergy analysis model of campus central heating system
FUC represents the exergy value provided by the boiler room or thermal power plant to the campus central heating system, its value could be determined by the temperature and flow. FU2 represents the exergy provided by the system to the supple water pipe network, its value could be read from the heat meter; FU3 represents the exergy received by the heat exchange station from the supply water pipe network; FU4 represents the exergy received by the return water pipe network from the heat exchange station; FU5 represents the exergy received by the system from the return water pipe network; ECCP and ECFP respectively represent the electricity consumption of the hot water circulation pump and the water make-up pump; FUSC represents the exergy of the steam condensate that is determined by temperature and pressure; FUFP represents the exergy consumed for water make-up; FULR represents exergy loss caused by water leakage; FUW represents the exergy output by the heat exchange station. The exergy flow of the campus central heating system is consisted of FUC, ECCP, ECFP, FUSC, FUWR, FULR, and FUW.
In the central heating system, hot water is the main heat medium, it flows through the supply water pipe network, the heat exchange station, the return water pipe network, and finally returns to the heat source. According to the flow direction of the hot water, a series-form exergy analysis model of the central heating system was established. Suppose: W represents the heat load of the heat exchange station; W'FP and WLR represent the energy loss caused by water leakage and the total energy loss of the central heating system; WC represents the energy of the waste-heat steam of the boiler room or the thermal power plant; WFP and WSC represent the energy carried by the supply water and the energy carried by the condensate water; ECCP and ECFP represent the electrical work of the hot water circulating pump and the electrical work of the water make-up pump. Formula 7 shows the energy balance equation of the campus central heating system:
$W_{C}+E C_{C P}+E C_{F P}+W_{F P}=W+W_{F P}^{\prime}+W_{L R}+W_{S C}$ (7)
The energy utilization rate δ of the central heating system can be calculated by Formula 8:
$\delta=\frac{W}{W_{C}+E C_{C P}+E C_{F P}+W_{F P}}$ (8)
Suppose ΣDAi represents the total exergy loss inside the system, then the system exergy balance equation can be constructed based on the exergy flow during the heat supply process of the system to the classroom buildings, dormitory buildings, and the residential area for school employees, see Formula 9:
$F U_{C}+E C_{C P}+E C_{F P}+F U_{F P}=F U_{W}+F U_{L R}+F U_{S C}+\sum D A_{i}$ (9)
The first law of thermodynamics requires that the input exergy in Formula 9 is greater than or equal to the output exergy. Based on Formula 9, the exergy efficiency calculation formula of the system model could be obtained:
$\delta_{h}=\frac{F U_{W}}{F U_{C}+E C_{C P}+E C_{F P}+F U_{F P}}$
$=1-\frac{F U_{L R}}{F U_{C}+E C_{C P}+E C_{F P}+F U_{F P}}$
$-\frac{F U_{S C}}{F U_{C}+E C_{C P}+E C_{F P}+F U_{F P}}$
$-\frac{\sum D A_{i}}{F U_{C}+E C_{C P}+E C_{F P}+F U_{F P}}$ (10)
According to above formula, the value range of exergy efficiency δh is [0,1]; this value reflects the comparison of the homogeneous energy of the system and the impact of internal and external energy loss relatively truthfully, to a certain extent, it could describe the completeness of the system design.
When analyzing the exergy balance of the campus central heating system, it is necessary to explore deep into the distribution of local exergy loss and its causes. Suppose: DA1 represents the exergy loss of the heat source of the campus central heating system, because the hot water of the return water pipe network directly returns to the boiler room or thermal power plant, its exergy does not do any work, so the value of FU5 can be considered to take 0, then, for the heat source of the campus central heating system, the exergy balance equation can be established as Formula 11:
$F U_{C}+E C_{C P}+E C_{F P}+F U_{F P}+F U_{5}=F U_{2}+F U_{L R}+D A_{1}$ (11)
where, DA1 can be calculated by Formula 12:
$D A_{1}=F U_{C}+E C_{C P}+E C_{F P}+F U_{F P}+F U_{5}-F U_{2}-F U_{L R}$ (12)
Suppose: DA2 represents the exergy loss of the supply water pipe network, since the exergy values of the inlet and the outlet water pipe networks constitute the total exergy of the supply water pipe network, there is:
$F U_{2}=F U_{3}+D A_{2}$ (13)
That is, DA2 is the difference between FU2 and FU3. The loss of the supply water pipe network caused by exergy loss and the friction loss of the pipeline and the hot water together constitute the exergy loss of the supply water pipe network. Suppose DA3 represents the exergy loss of the heat exchange station, then the exergy balance equation of the heat exchange station could be described by Formula 14:
$F U_{3}=F U_{W}+F U_{4}+D A_{3}$ (14)
The exergy loss of heat transfer of temperature difference, the exergy loss of heat exchange, and the mechanical exergy loss together constitute the exergy loss of the heat exchange station. Suppose DA4 represents the exergy loss of the return water pipe network, similar to that of the supply water pipe sections, the exergy balance equation of the return water pipe network could be described by Formula 15:
$F U_{4}=F U_{5}+D A_{4}$ (15)
EHR is usually used to evaluate whether the selected type of hot water circulating pump is suitable or not, the numerical value of EHR is equal to the electricity consumption for delivering per unit heat. Suppose: M represents the shaft power of the water pump under the design working conditions; P represents the heating load on campus; φ represents the efficiency of the motor and the transmission parts; ∆h represents the design temperature difference between supply water and return water; ΣK represents the total length of the main pipe line of the outdoor supply and return water pipes; then, according to the stipulation of Design Standard for Energy Efficiency of Public Buildings (GB50189-2015), the EHR of the hot water circulating pump of the campus central heating system can be defined as follows:
$E H R=\frac{M}{P \phi}<<\frac{0.0056\left(14+\beta \sum K\right)}{\Delta h}$ (16)
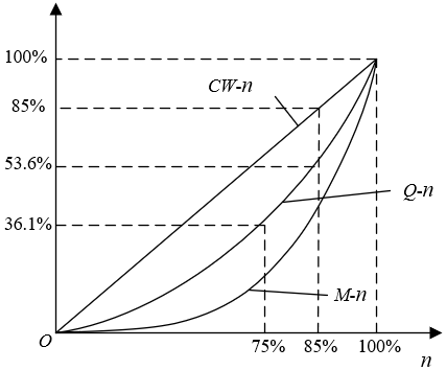
Figure 3. Rotate speed change of the hot water circulating pump
Figure 3 shows the change of rotate speed (n) of the hot water circulating pump with shaft power (M), pressure (Q), and flow (CW), there’re certain proportional relationships between M, Q, CW, and n. Suppose ΣPF represents the daily heat supply of the campus central heating system; γ and o represent the daily electricity consumption of the hot water circulating pump and its daily operating hours; p represents the heating load under the design working conditions; S represents the equivalent building area on the campus that needs heating; then, according to the stipulation of Design Standard for Energy Efficiency of Civil Buildings (JGJ26-2010), the value of EHR should satisfy the inequality shown as Formula 17:
$E H R=\frac{\gamma}{\sum P_{F}}=\frac{o \cdot M}{24 p \cdot S}<<\frac{0.0056\left(14+\beta \sum K\right)}{\Delta h}$ (17)
The water transport factor (WTF) is usually used to measure the utilization rate of the hot water circulating pump of the campus central heating system, its numerical value is equal to the heat supply for per unit power delivered by the hot water circulating pump, to a certain extent, it reflects the level of the work done by the hot water circulating pump, and its value is the reciprocal of EHR. Suppose: (WTF)PL represents the theoretical WTF under the design working conditions, then there is:
$W T F>>0.6(W T F)_{P L}$ (18)
Suppose HAH represents the heating index, then Formula 19 gives its calculation formula:
$W T F=\frac{H A H \times S}{M}$ (19)
Suppose HUH represents the total heat consumption of student users and teacher users; WPS represents the electricity consumption of the hot water circulating pump; ρ represents the product of the frictional resistance of the pipeline and hot water and the equivalent length percentage of the local resistance of the main line of the supply and return water pipes, then there is:
$W T F=\frac{H U H}{W P S}$ (20)
As for (WTF)PL, there is:
$(W T F)_{P L}=\frac{7650}{14+\rho \times \sum K}$ (21)
Suppose θ, BSi, and CW respectively represent the water make-up rate of the central heating system, the water make-up amount per unit time, and the design circulating water amount per unit time; then the degree of water loss of the system (θ) could be calculated by Formula 22:
$\theta=\frac{B S_{i}}{H} \times 100$0/0 (22)
Parameter HD is often used to evaluate the degree of hydraulic imbalance of a heating system, its numerical value is equal to the ratio of the actual flow CWP of the thermal users to the design flow CWR:
$H D=C W_{P} / C W_{R}$ (23)
Parameter QT is often used to evaluate the room temperature qualification rate of the energy efficiency of the central heating system, its numerical value is equal to the ratio of the number of houses with qualified room temperature v to the total number of houses tested V:
$Q T=\frac{v}{V} \times 100$0/0 (24)
The efficiency of outdoor supply water pipe network (δPN) is often used to evaluate the energy utilization of the heating system, its numerical value is equal to the ratio of ΣWV the actual heat obtained by campus buildings (such as classroom buildings, dormitory buildings, and library buildings) to ΣWΨ the output heat of the heat source of the system:
$\delta_{P N}=\frac{\sum W_{V}}{\sum W_{\psi}}$ (25)
Suppose gs and C represent the area heating index and the number of heat supply days of the central heating system; ω represents the room temperature qualification rate for reasonable system heat distribution, then, for a campus central heating system without a heat supply monitoring platform, there is:
$\delta_{P N}=\frac{24 \times 3.6 \times g_{S} \times S \times C}{\sum W_{\psi}} \times \omega$ (26)
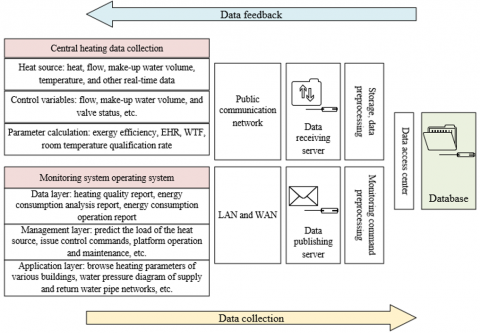
For a campus central heating system with a heat supply monitoring platform, all heating data come from the database of the platform. Figure 4 gives the structure of the campus heat supply monitoring platform, which is mainly consisted of four sub-systems: central heating data collection sub-system, monitoring platform operating sub-system, data storage sub-system, and data publishing and processing sub-system. Suppose Wi represents the heat consumption of each building on the campus, then, for a campus central heating system equipped with heat meters, there is:
$\delta_{P N}=\frac{\sum_{i=1}^{v} W_{i}}{\sum W_{\psi}}$ (27)
During the actual operation of the campus central heating system, the actual annual heat supply of the heat source of the system can be calculated based on the actual situation of whether the school has installed heat meters.
For a campus central heating system that hasn’t installed heat meters, suppose GA represents the actual annual heat supply duration on the campus; ψm and ψmM represent the target indoor temperature and the measured indoor temperature; ψO and ψOM represent the average outdoor temperature and the measured outdoor temperature; CWM represents the flow of the heat source of the heating system under actual measurement conditions; ψRM and ψCM represent the measured temperature of the supply water and the return water; then, during the heating season from mid-November to mid-February of the following year, the heat gain of per unit heating area on the campus wP could be calculated by Formula 28:
$w_{p}=\frac{\psi_{m}-\psi_{o j}}{\psi_{m M}-\psi_{O M}} \times w_{M}$ (28)
The measured heating index wM could be calculated by Formula 29:
$w_{M}=\frac{\Psi \times \sigma \times C W_{M} \times S H \times\left(\psi_{R M}-\psi_{C M}\right)}{S}$ (29)
The actual annual heat supply of the heat source of the system could be calculated by Formula 30:
$\sum W_{\psi}=87 \times w_{P} \times G_{A} \times \frac{H A}{\delta_{P N}}$ (30)
Since there’re differences in the measured indoor temperature of different types of buildings. ψmM could be calculated using the method of weighted mean, as Formula 31:
$\psi_{m M}=\frac{\sum_{i=m}^{n} H A_{i} \times \psi_{m M i}}{H A}$ (31)
Combining Formulas 29 and 31, there is:
$\sum W_{\psi}=87 \times \frac{\psi_{m}-\psi_{o j}}{\psi_{m M}-\psi_{\Omega M}} \times \Psi \cdot \sigma \cdot C W_{M} \cdot S H \cdot\left(\psi_{R M}-\psi_{C M}\right) \times \frac{1000}{\delta_{P N}} \times G_{A}$ (32)
Figure 4. Structure of the campus heat supply monitoring platform
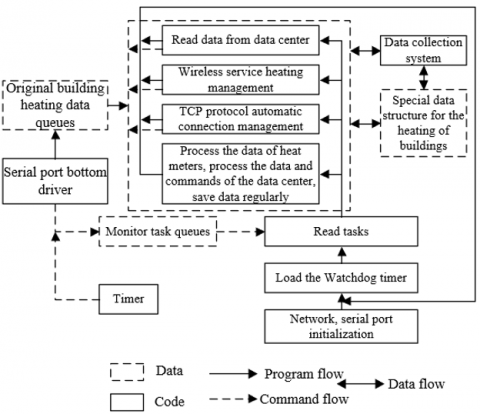
To improve the efficiency, accuracy, and timeliness of the heat meters, a wireless service module terminal was installed at the heat exchange station of the campus heating system to realize data transmission among the heat supply control cabinet, the heat meters installed in each campus building, and the server. Figure 5 shows the data transmission principle of the campus heat supply monitoring platform. For the campus central heating system that has installed a heat supply monitoring platform, the annual heat supply ΣWψ of the heat source can be obtained directly from the readings of the heat meters. Suppose: Ψ represents the comprehensive correction coefficient of relative density and specific heat, then there is:
$\sum W \psi=\int_{t_{1}}^{t_{2}} \Psi \cdot \sigma \cdot S H \cdot H(t) \cdot\left[\psi_{R}(t)-\psi_{C}(t)\right] d t$ (33)
Suppose: wBU represents the heating index of buildings on the campus; GHM represents the low calorific value of standard coal; δθ represents the average operating efficiency of the heat exchange stations; then the coal consumption index per unit heating area wHM could be calculated by Formula 34:
$w_{H M}=\frac{24 \cdot C \cdot w_{G}}{\delta_{\theta 1} \cdot \delta_{P N} \cdot G_{H M}} \times 3600$ (34)
Figure 5. Data transmission principle of the campus heat supply monitoring system
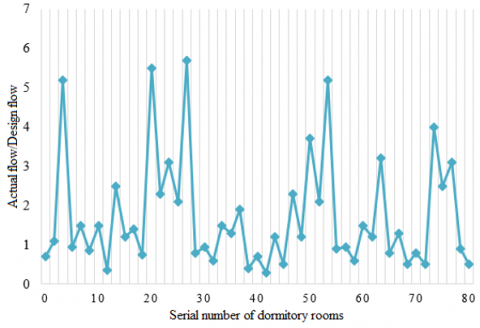
There are 24 dormitory buildings on the campus, wherein 14 buildings are located in the east line, and 10 buildings are located in the west line, and each dormitory building has 120 student dormitory rooms. Figure 6 shows the hydraulic balance of heat supply in 80 dormitory rooms in an east line dormitory building. According to the stipulation of Standard for Energy Efficiency Inspection of Heating Residential Buildings (JGJ132-2016), the value range of the hydraulic balance of the inlet of supply water pipe network is [0.9,1.2]. Among 80 dormitory rooms, the hydraulic balance of 8 rooms was less than 0.9, the hydraulic balance of 72 rooms was greater than 1.2, it can be seen that the heat supply of most dormitory rooms was hydraulically unbalanced, and the actual flow was greater than the design flow; its purpose is was to meet the requirement that the heat flow of the dormitory at the farthest end could reach the design flow. The heat supply monitoring platform increased the volume of circulating water in the supply and return water pipe networks, so that when the pipe network was under large flow operation conditions, the supply heat consumption and the energy conservation potential were both greater.
Figure 7 shows the changes of heat supply in the teaching area on the study campus during the 2020 winter heating season, as can be seen from the figure, the heat supply in the teaching area is not greatly affected by the fluctuation of outdoor temperature. Before being controlled by the heat supply monitoring platform, the teaching area adopted the secondary pipe network constant supply water temperature mode, however, due to the obvious front-end limitation of the supply water flow, the adjustment of room temperature is seriously lagging, therefore it’s necessary to implement passive control measures on the heat supply temperature.
The total heat load of the heat supply pipe loop in the teaching area on the study campus was 1478.2Kw, the circulating hot water flow was 68.24T/h, and the diameter of the supply and return water pipe network was DN200. Table 1 shows the hydraulic calculation results of the pipe loop. The total heat load of the heat supply pipe loop in the dormitory area was 1658.2Kw, the circulating hot water flow was 79.36T/h, and the diameter of the supply and return water pipe network was also DN200. Table 2 compares the flow of the heat supply pipe loop in the dormitory area before and after the heat supply control. Before heat supply control, the design flow of the student dormitory area was 88.72t/h, the actual flow of the heat supply pipe loop under full load operating conditions was 123.58t/h, and the degree of hydraulic imbalance was 1.39.
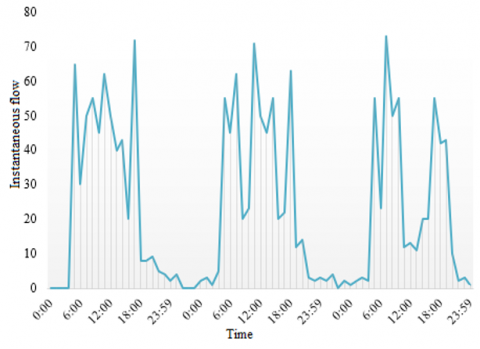
Figure 8 shows the instantaneous heat flow in the teaching area at different hours. According to the figure, buildings in the teaching area adopted an intermittent heating mode, that is, central heating was turned on from 6:00 am to 18:00 pm (the teaching hours), and was turned off from 19:00 pm to 5:00 am (the next day) (the non-teaching hours). The instantaneous heat flow during the teaching hours was much greater than that during the non-teaching hours. Through the heat supply control of the heat supply monitoring platform, the teaching area on the campus could realize energy saving through intermittent heating.
Figure 6. Hydraulic balance of heat supply in a dormitory building in the east line before heat supply control
Table 1. Hydraulic calculation of heat supply pipe loop in the teaching area
|
Pipeline No. |
Diameter |
Flow |
Flow speed |
Unit friction loss |
Resistance loss of pipe section |
Cumulative resistance loss |
|
1 |
220 |
75.32 |
0.573 |
3.25 |
0.75 |
0.76 |
|
2 |
160 |
56.03 |
0.826 |
7.35 |
0.27 |
0.98 |
|
3 |
160 |
39.71 |
0.579 |
3.62 |
0.35 |
1.35 |
|
4 |
80 |
5.07 |
0.386 |
3.54 |
0.23 |
1.62 |
|
5 |
130 |
22.92 |
0.475 |
2.71 |
0.08 |
0.03 |
|
6 |
60 |
3.75 |
0.482 |
11.35 |
0.95 |
0.85 |
|
7 |
160 |
35.69 |
0.513 |
2.75 |
0.08 |
0.03 |
|
8 |
70 |
18.63 |
0.961 |
18.69 |
0.35 |
0.25 |
Table 2. Flow of heat supply pipe loop in the dormitory area before and after heat supply control
|
Building No. |
Target flow value HO |
Flow before heat supply control HB |
Flow after heat supply control HA |
Degree of hydraulic imbalance |
|
|
HB/HO |
HA/HO |
||||
|
Heat exchange station |
88.72 |
123.58 |
110.61 |
1.35 |
1.39 |
|
1# dormitory building |
6.35 |
15.92 |
9.62 |
2.72 |
1.43 |
|
2# dormitory building |
6.43 |
16.71 |
9.35 |
2.44 |
1.46 |
|
3# dormitory building |
6.43 |
10.82 |
8.72 |
1.37 |
1.48 |
|
4# dormitory building |
6.43 |
10.56 |
7.65 |
1358 |
1.43 |
|
5# dormitory building |
6.98 |
6.72 |
7.93 |
0.93 |
1.42 |
|
6# dormitory building |
5.71 |
5.58 |
8.51 |
0.95 |
1.35 |
|
7# dormitory building |
14.35 |
17.91 |
7.62 |
1.34 |
1.36 |
|
8# dormitory building |
15.27 |
18.06 |
19.53 |
1.26 |
1.34 |
|
9# dormitory building |
6.85 |
5.84 |
8.75 |
0.83 |
1.25 |
|
10# dormitory building |
13.88 |
11.25 |
13.39 |
0.97 |
1.23 |
Figure 7. Daily heat supply and outdoor temperature changes in the teaching area
Figure 8. Instantaneous heat flow in the teaching area at different hours
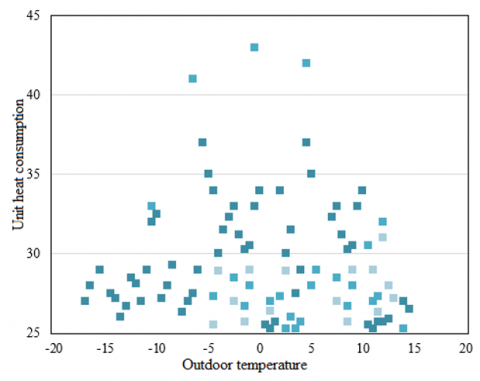
Figure 9. Heat supply changes on campus
According to the electricity consumption data of hot water circulating pumps before and after heat supply control listed in Table 3, it can be seen that, before heat supply control, the electricity consumption data of the hot water circulating pumps at each heat exchange station on the campus was 251,000 kWh; while after the heat supply control, this value was 160,900 kWh, an electricity consumption of 90,100 kWh had been saved. The significant reduction in the electricity consumption was achieved because the heat supply monitoring platform had compared the EHR of each heating area and formulated a reasonable heat distribution scheme, which had increased the operating power difference of the hot water circulating pumps, and further saved the electricity power. Table 4 shows the per unit area coal consumption of each heat exchange station of the campus central heating system. In the same way, after the heat supply monitoring platform compared and controlled per unit area coal consumption index, the operating power difference of the heat exchange stations had been increased, and the coal consumption had been saved further.
According to the heat supply data after the heat supply control measures had been taken on the study campus in 2020, a scatter diagram of the heating index under different outdoor temperature conditions was plotted as shown in Figure 9, after the heating season operating mode of the heating system was optimized based on the heat supply monitoring platform, the average heat supply amount was 30.77W/m2, which was far lower than the design value; compared with the history value 47.78W/m2 of same time period (when there’s no heat supply control), the value had decreased by 17.01%, which further verified the effectiveness of the heat supply management and control of the monitoring platform.
Table 3. Electricity consumption of hot water circulating pumps after heat supply control
|
Heat exchange station Hot water circulating pump No. |
Before heat supply control |
After heat supply control |
|
East low-1 |
3.65 |
2.37 |
|
East low-2 |
2.47 |
0.96 |
|
East high-1 |
7.38 |
5.25 |
|
West low-1 |
- |
1.59 |
|
West low-2 |
3.75 |
2.62 |
|
West high-1 |
2.62 |
0.95 |
|
West high-2 |
5.23 |
2.35 |
|
Total |
25.10 |
16.09 |
Table 4. Per unit area coal consumption of each heat exchange station
|
Heat exchange station |
Before heat supply control |
After heat supply control |
|
East low-1 |
39.72 |
22.24 |
|
East low-2 |
31.60 |
18.23 |
|
East high-1 |
32.52 |
17.30 |
|
West low-1 |
32.79 |
19.68 |
|
West low-2 |
31.21 |
17.85 |
|
West high-1 |
33.24 |
19.34 |
|
West high-2 |
32.84 |
18.46 |
This study analyzed the energy consumption of campus central heating system and evaluated its comprehensive energy efficiency based on the heat supply monitoring platform. The paper elaborated on the energy consumption analysis method of the campus heating system and constructed energy and exergy balance equations. Based on EHR, heating index, water make-up rate and other parameters, the energy efficiency of the campus central heating system was evaluated, and a diagram of the hydraulic balance of heat supply in a dormitory building in the east line before heat supply control, and a diagram of the change curves of daily heat supply and outdoor temperature in the teaching area were plotted in the paper. After analysis, it’s determined that it’s necessary to implement passive control measures on the heat supply temperature based on the monitoring platform. Moreover, the proposed algorithms were used to calculate the relevant parameters, and the experimental results gave the flow, electricity consumption, and coal consumption of the heat supply pipe loop of the dormitory area and the teaching area before and after the heat supply control, and the results had proved the effectiveness of the heat supply control measures of the monitoring platform.
[1] Liu, G., Kong, Z., Dong, J., Dong, X., Jiang, Q., Wang, K., Wan, X. (2021). Influencing factors, energy consumption, and carbon emission of central heating in China: A supply chain perspective. Frontiers in Energy Research, 9: 49. https://doi.org/10.3389/fenrg.2021.648857
[2] Al Qadi, S., Sodagar, B., Elnokaly, A. (2018). Estimating the heating energy consumption of the residential buildings in Hebron, Palestine. Journal of Cleaner Production, 196: 1292-1305. https://doi.org/10.1016/j.jclepro.2018.06.059
[3] Hong, S.K., Choi, A., Sung, M. (2018). Impact of bi-directional PV blind control method on lighting, heating and cooling energy consumption in mock-up rooms. Energy and Buildings, 176: 1-16.
[4] Saurav, K., Jain, M., Bandhyopahyay, S. (2018). Reducing energy consumption for space heating by changing zone temperature: Pilot trial in Luleå, Sweden. In Proceedings of the Ninth International Conference on Future Energy Systems, pp. 266-270. https://doi.org/10.1145/3208903.3208918
[5] Wang, H.M., Wang, J. (2021). Abnormal node detection method for time-sharing heating energy consumption in multi-storey buildings based on drosophila algorithm. International Journal of Global Energy Issues, 43(1): 1-23. https://doi.org/10.1504/IJGEI.2021.113449
[6] Muniak, D.P. (2021). The impact of the use of antifreeze substances on the heating installation thermohydraulic parameters and energy consumption. Heat Transfer Engineering, 42(3-4): 347-353. https://doi.org/10.1080/01457632.2019.1699305
[7] Luo, A., Xia, J. (2020). Policy on energy consumption of district heating in northern China: Historical evidence, stages, and measures. Journal of Cleaner Production, 256: 120265. https://doi.org/10.1016/j.jclepro.2020.120265
[8] Yoon, S., Choi, Y., Koo, J., Hong, Y., Kim, R., Kim, J. (2020). Virtual Sensors for Estimating District Heating Energy Consumption under Sensor Absences in a Residential Building. Energies, 13(22): 6013. https://doi.org/10.3390/en13226013
[9] Usikov, S. (2018). Estimation of energy efficiency of water heating systems in terms of electricity consumption. In MATEC Web of Conferences, 251: 03024. https://doi.org/10.1051/matecconf/201825103024
[10] Li, E. (2017). Analyses of influence of residential buildings' space organization on heating energy consumption in Lhasa. Journal of Southeast University (English Edition), 33(4): 457-465.
[11] Bedane, T.F., Pedrós-Garrido, S., Quinn, G., Lyng, J.G. (2021). The impact of emerging domestic and commercial electro-heating technologies on energy consumption and quality parameters of cooked beef. Meat Science, 179: 108550. https://doi.org/10.1016/j.meatsci.2021.108550
[12] Reuter, M., Narula, K., Patel, M.K., Eichhammer, W. (2021). Linking energy efficiency indicators with policy evaluation–A combined top-down and bottom-up analysis of space heating consumption in residential buildings. Energy and Buildings, 244: 110987. https://doi.org/10.1016/j.enbuild.2021.110987
[13] Kim, D.D., Suh, H.S. (2021). Heating and cooling energy consumption prediction model for high-rise apartment buildings considering design parameters. Energy for Sustainable Development, 61: 1-14. https://doi.org/10.1016/j.esd.2021.01.001
[14] Le, A.T., Wang, Y., Wang, L., Li, D. (2020). Numerical investigation on a low energy-consumption heating method for recirculating aquaponic systems. Computers and Electronics in Agriculture, 169: 105210. https://doi.org/10.1016/j.compag.2019.105210
[15] Zhang, Y., Xia, J., Fang, H., Jiang, Y., Liang, Z. (2020). Field tests on the operational energy consumption of Chinese district heating systems and evaluation of typical associated problems. Energy and Buildings, 224: 110269. https://doi.org/10.1016/j.enbuild.2020.110269
[16] Le, A.T., Wang, L., Wang, Y., Vu, N.T., Li, D. (2020). Experimental validation of a low-energy-consumption heating model for recirculating aquaponic systems. Energies, 13(8): 1958. https://doi.org/10.3390/en13081958
[17] Brandi, S., Piscitelli, M.S., Martellacci, M., Capozzoli, A. (2020). Deep reinforcement learning to optimise indoor temperature control and heating energy consumption in buildings. Energy and Buildings, 224: 110225. https://doi.org/10.1016/j.enbuild.2020.110225
[18] Shen, N., Chen, S., Wang, W., Shi, R., Chen, P., Kong, D., Cheng, C. (2019). Joule heating driven infrared switching in flexible VO2 nanoparticle films with reduced energy consumption for smart windows. Journal of Materials Chemistry A, 7(9): 4516-4524. https://doi.org/10.1039/C8TA11071A
[19] Martin-Du Pan, O., Woods, P., Hanson-Graville, R. (2019). Optimising pipe sizing and operating temperatures for district heating networks to minimise operational energy consumption. Building Services Engineering Research and Technology, 40(2): 237-255. https://doi.org/10.1177/0143624418802590
[20] Ichinose, T., Lei, L., Lin, Y. (2017). Impacts of shading effect from nearby buildings on heating and cooling energy consumption in hot summer and cold winter zone of China. Energy and Buildings, 136: 199-210. https://doi.org/10.1016/j.enbuild.2016.11.064
[21] Olorunmaiye, J.A., Awolola, O.O. (2017). Heating degree-days for estimating energy consumption in poultry houses and incubators in Nigeria. Energy Engineering, 114(5): 18-32. https://doi.org/10.1080/01998595.2017.11882307
[22] Karatasou, S., Laskari, M., Santamouris, M. (2018). Determinants of high electricity use and high energy consumption for space and water heating in European social housing: Socio-demographic and building characteristics. Energy and Buildings, 170: 107-114. https://doi.org/10.1016/j.enbuild.2018.04.019
[23] Rim, M., Sung, U.J., Kim, T. (2018). Application of thermal labyrinth system to reduce heating and cooling energy consumption. Energies, 11(10).
[24] Arabkoohsar, A., Farzaneh-Gord, M., Ghezelbash, R., Koury, R.N. (2017). Energy consumption pattern modification in greenhouses by a hybrid solar–geothermal heating system. Journal of the Brazilian Society of Mechanical Sciences and Engineering, 39(2): 631-643. https://doi.org/10.1007/s40430-016-0569-8
[25] Kaminska, A. (2019). Impact of heating control strategy and occupant behavior on the energy consumption in a building with natural ventilation in Poland. Energies, 12(22): 4304. https://doi.org/10.3390/en12224304
[26] Mostafavi, S.A., Rezaei, A. (2019). Energy consumption in greenhouses and selection of an optimized heating system with minimum energy consumption. Heat Transfer—Asian Research, 48(7): 3257-3277. https://doi.org/10.1002/htj.21540
[27] Wang, R., Lu, S., Li, Q. (2019). Multi-criteria comprehensive study on predictive algorithm of hourly heating energy consumption for residential buildings. Sustainable Cities and Society, 49: 101623. https://doi.org/10.1016/j.scs.2019.101623
[28] Jiaqiang, E., Zhao, X., Liu, G., Zhang, B., Zuo, Q., Wei, K., Gong, J. (2019). Effects analysis on optimal microwave energy consumption in the heating process of composite regeneration for the diesel particulate filter. Applied Energy, 254: 113736. https://doi.org/10.1016/j.apenergy.2019.113736