Stefano Aneli | Roberta Arena | Antonio Gagliano*
© 2021 IIETA. This article is published by IIETA and is licensed under the CC BY 4.0 license (http://creativecommons.org/licenses/by/4.0/).
OPEN ACCESS
The electrical efficiency of photovoltaic (PV) modules can be improved through the cooling of the PV. Among the passive cooling strategy, one of the most promising concerns the use of phase change materials (PCMs) to decrease the operative temperature of a PV panel. This paper investigates the performances of a conventional PV panel in which two organic PCMs are added (PV-PCM) to reduce the temperature rise of PV cells and consequently to increase the electrical performances.
With this aim, unsteady numerical simulations have been carried with Ansys Fluent software using a two-dimensional simplified geometry for the PV modules with the PCM is incorporated (PV-PCM), as well as for the benchmark PV module.
The numerical simulations have allowed evaluating the PV cell temperatures, the power production, as well the PCM thermal behavior.
As regards this latter aspect the dynamic analysis has evidenced the need to extend the time of simulation at least for two days in such way to take into account of the degree of solidification achieved during the night by the PCM materials. PCM with low melting temperature cannot complete solidifying during the night and so the heat stored during the day will be lesser than the theoretical one.
The results of this study pointed out that the PV-PCM units allow achieving higher performances in comparison with a conventional PV module, especially during the hottest months. An increase in the peak power of 10% and of 3.5% of the energy produced all year round is attained.
PCM, PV performances, cells temperature, CFD, simulation
The efficiency of PV cells is sturdily affected by the increase of their temperature, in fact, as the temperature of the cells increases, the energy yield decreases.
Theoretically, the temperature coefficient γ, which relates PV efficiency and cell temperature, ranges from -0.4 to -0.45% ℃. However, an experimental study has shown that this coefficient could rise to -0.65 % ℃ [1].
Furthermore, the PV panels heat up quickly as the layers have modes thermal inertia [2], so their efficiency decline as the solar irradiation grows.
Table 1. PV cooling techniques
|
Photovoltaic/Thermal hybrid solar system (PVT air /water cooling) |
|
PV/Phase-Change Materials (PV-PCM cooling) |
|
PV/Heat Pipes (HP-PV cooling) |
|
PV/Microchannel heat sink (PV-MCHS cooling) |
|
PV/Nano-fluids (PVT-NFs) |
|
PV/water spraying (jet impingement) |
|
PV/water immersion cooling |
|
Floating, tracking, concentrating and cooling (FTCC) |
|
PV/Spectrum filter (Beam Split PVT) |
|
PV/Transparent coating (photonic crystal) |
|
PV/Thermoelectric hybrid system (PV-TE cooling) |
Therefore, active and passive cooling techniques have been developed to cool photovoltaic panels to increase their efficiency [3, 4].
Active cooling techniques require the supply of energy, on the contrary, passive cooling does not require energy and also has lower maintenance requests.
Table 1 enumerates the different solar photovoltaic systems cooling technologies as proposed by Lupul et al. [5].
Hybrid PV/Thermal collectors allow to optimize and control the PV cell temperature [6], increase the overall energy conversion efficiency [7], as well as diminish the need for installation space [8].
The performances of PV/T nanofluid for cooling the PV cells have been evaluated in the study [9].
Among the passive cooling strategy, one of the most promising concerns the use of phase change materials (PCMs) to decrease the operative temperature of a PV panel.
PCMs act as a heat storage material where the thermal energy discharged by the cells is stored as latent heat of fusion, thus blocking the temperature increase. Hence these materials, whom temperature remains constant until the end of the melting process, allow for improved electrical conversion efficiency, creating a shift in temperature rise [10].
Therefore, the PCMs can accumulate thermal energy in the form of heat or cold with the possibility of using it later, this feature makes them extremely suitable for applications with electrical storages [11, 12].
Huang et al. [13] devised and validated a numerical PV-PCM model, they noticed that applying a tank, filled with 4.0 cm of PCM, to the rear of a photovoltaic panel, it’s possible to maintain a constant PV temperature under constant solar irradiation of 750 W m−2 for about 150 min.
The potential of PCMs can be optimized by acting on the transition temperature, Kibria et al. [14] improved the PV-PCM system efficiency by 5% in comparison to the traditional PV panel, varying the PCM melting point.
It is also necessary to consider that the convective flow that arises inside the PCM in liquid phase negatively affects the performance of the photovoltaic system [15].
Khanna et al. [16] developed a CFD simulation in which they keep constant air temperature and solar radiation value, to establish that the greatest electrical producibility is obtained choosing PCMs which melts point at ambient temperature.
Ma et al. [17] analyzed many PCMs and they noticed that the PV-PCM system yields increase with latent heat capacity.
Various phenomena can affect the performance of the PV-PCM system. As regards the melting point, it is confirmed that temperatures close to the ambient one are to be preferred as they keep the panel at lower temperature values. Furthermore, ambient temperature affects the amount of PCM to employ, in fact, the higher this temperature the larger the amount of material to be used. Stropnik and Stritih [18] showed the optimum PCM volume to install to decrease the temperature of PV cells under various solar radiation levels. Another important parameter is the wind as its velocity increases the optimum depth decreases.
Therefore, an evaluation of a PV-PCM system under real temperature and radiation conditions is certainly of noticeable interest. Nouira and Sammouda [19] developed a CFD simulation in COMSOL to monitor the temperature of a PV panel, varying the solar irradiation, the ambient temperature and the type of PCM employed, during two days of summer. The result is very interesting it emerges that in the same environmental conditions the behavior of the system can be different. This is due to the incomplete solidification of the PCM during the night because of the high temperatures compared to the melting point. Not taking this phenomenon into account can therefore lead to results that are not entirely correct, which is an aspect not yet fully covered in the literature.
Therefore, several are the ideas on which to carry out studies on PV-PCM systems for the Mediterranean area where, despite the high temperatures reached during the year, these systems have not been deeply investigated.
For this reason, in this study, an unsteady CFD model is presented for analyzing the behaviour of a photovoltaic module equipped with two different PCMs.
The cell temperature and electrical efficiency of the two PV-PCM units are compared with those of a conventional PV panel. In particular, the outcomes at the winter and summer solstice, and the autumn equinox have been highlighted. One of the novelties of this study consists in the possibility to takes into account variable weather conditions in the developed numerical model. The hourly values for solar irradiation, ambient temperature, and wind velocity are used as input data.
In comparison with other literature studies, the proposed unsteady CFD analysis allows following the growth of the process of melting and successive solidification phase of the PCM. With this aim, the time of simulations has been extended at least for two days.
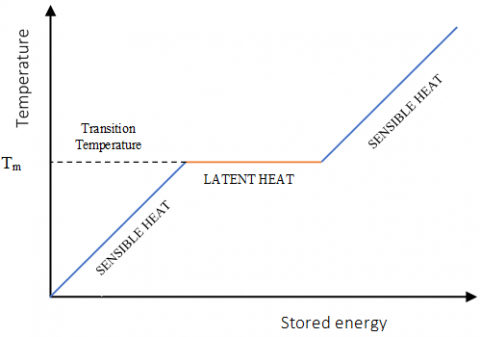
The potential of PCMs lies in their facility to store large amounts of energy while keeping the temperature at a constant value. This happens, as the name suggests, during phase changes. Scientists, therefore, in the last 20 years, have studied these materials for the possibility of exploiting not only sensible, but also the latent heat, and this gives great potential for storing energy since the latter is even 100 times greater than sensible heat. PCMs can store up to 14 times more heat per unit of volume than water and operate in a wide range of temperatures from -40 to 150℃ [20].
Currently, most PCMs are used to exploit the energy released or absorbed only during the solid/liquid passages. Solid/solid transformations are slow and involve a smaller amount of heat, liquid/vapour transformations, on the other hand, require a large amount of energy to take place and the gas obtained require large volumes and high pressures to be stored.
Figure 1 depicts the schematic of the sensible and latent heat storage effect.
Figure 1. Sensible and latent heat
Solid/liquid transition PCMs can be classified in organic, inorganic and eutectic. The first group encloses polymers formed by a long chain of Hydrogen and Carbon molecules, their main advantages are the possible use in a large temperature range, latent heat of fusion does not degrade over time, so they do not have subcooling problems, keeping an appreciably stable temperature during phase change.
Furthermore, they are chemically and physically stable, non-corrosive, safe, non-reactive and recyclable. Disadvantages of organic PCMs are flammability, low thermal conductivity, about 0.2 Wm-1K-1.
Inorganic PCMs are hydrated salts, salts, metals, and metal alloys based on bismuth, lead, tin, or indium, their most important characteristics are the high latent heat per unit of volume, the high thermal conductivity, about 0.5 Wm-1K-1, the low volume variations during the fusion, low toxicity, low cost and non-flammability. The main disadvantages concern the super-cooling effect and the high change of volume, corrosivity, and the risk to become inoperative after repeated cycling.
Eutectic PCMs, which are a mixture of two or more substances which has a melting point lower than that of each component. The elements of a eutectic material merge and solidify congruently and simultaneously without segregation. This group shows high volumetric thermal storage density, but low thermal conductivity [21].
The solid-liquid phase transitions require an encapsulation. It consists of incorporating the PCM, the core, inside protective material, a coating, called the shell. Often in the core, there may be an air pocket to avoid excessive stresses due to volume changes during the phase change.
This practice achieves several advantages, it allows to avoid contamination of the material by the environment and to enable the use of materials not easily usable, because under operating conditions they are dangerous, corrosive or water-soluble; enhances the heat transfer process, chemical, thermal and mechanical stability. As a function of the encapsulation size, it’s possible to define a macro, micro or nano encapsulation. Micro-encapsulated PCMs are preferable in several respects, in fact, they better resist to volume changes, are more chemically stable with the shell, and provide a high heat transfer rate, thanks to their high surface/volume ratio.
In macro-encapsulated PCMs, a temperature differential can be noticed between the core and the boundary. On the other hand, micro-encapsulated PCMs can be subjected to super-cooling although it can be avoided by adding nucleating agents. Nano-encapsulated PCMs performance and applications are under study, but they seem promising for energy storage applications [22].
The characteristics to be considered when choosing a PCM are a latent heat greater than 0.150 kJ/g, PCM with high latent heat requires a less amount of material to store a given quantity of energy [20], the transition temperature must fall within the operating range, high values are required also for density and thermal conductivity, the latter quantifies the tendency of a material to transmit heat, thus a higher thermal conductivity results in faster heat transfer. Another crucial requirement is the coincidence of melting and solidification temperatures to avoid thermal hysteresis which leads to energy losses.
Finally, PCMs have to be chemically stable, non-toxic and non-corrosive, safe and economical.
The PCMs thermophysical properties, thermal conductivity, latent and specific heat, can be improved through the insertion of nanoparticles [23].
PCMs applications can be several: in the building sector they can be used in passive cooling techniques based on the principle to store cool during the night and release it during the daytime, or for heat recovery, in this case, PCMs are used inside storage systems for both hot and cold side. PCMs are absorbed into building materials like concrete to decrease heat transfer rates during peak hours, but also to reduce the relatively large interior temperature fluctuations stabilizing indoor temperature [24]. In packaging and transport sector, PCMs are used to maintain the desired temperature and thus, avoid sudden changes, due to refrigerators malfunctions or the need to move products, such as food but also medical and pharmaceuticals supplies. In the electronics sector, PCMs are used as passive cooling techniques, performing the role of a thermal shock absorber, they prevent the critical temperature from being exceeded [25].
Jaworski [26] reports that heat sinks with PCM can suppress fluctuations of the microprocessor’s temperature during variation of its power, which can lead to thermal fatigue. Increasing the thermal inertia avoids damage to electronic components in case of the failure of a conventional cooling system, based on forced convection airflow the rate of temperature rise is reduced. PlusICE PCMs has been employed in aerospace applications, to maintain the samples collected at the same temperature until they arrive in the laboratory. Finally, they are used also in the textile sector, to produce ‘ice jackets’, used by firefighters and operatives in uncomfortable working environments [27].
The analyses of the thermal and electrical behaviour for both of a conventional photovoltaic module (PV) and the same PV module with the addition of PCM (PV-PCM) is presented. The PCM material is placed into a chamber realized by thin aluminium foils.
The temperature of the cell temperature of PV-PCM module is determined by the energy balance with the surrounding environment and the heat stored into the PCM during the melting process.
The PV-PCM module consists of five layers, glass cover, PV cells and the two EVA sheet (EVA-PV-EVA), Tedlar, PCM material and the two plates of PCM tank.
The following conditions are assumed:
(i) the PV layers, as well as the PCM in solid and liquid phases, were assumed isotropic and homogenous.
(iii) the effects of the temperature were taken into account as variations in the electricity efficiency of the PV module.
(iii) the variations of the thermal properties of the PV layer and the PCM within the same phase with temperature were ignored.
(iv) the heat losses from the side walls were neglected.
(v) the flow in the melted PCM was considered laminar.
The heat fluxes on the PV-PCM module are (Figure 2):
convection and thermal radiation between the glass panel’s top with the surrounding ambient;
transmission and absorption of the solar irradiation;
absorption of the transmitted solar irradiation through the glass by the PV cells:
power generation;
thermal conduction across the solid layers;
storage or discharge of heat by the PCM during the phase changes;
convection and thermal radiation between the back surface and the outdoor ambient.
Figure 2. Heat fluxes in PV-PCM unit
The fraction of the solar irradiance that hits the surface wasted into heat (Geff) is calculated by:
$G_{e f f}=G \cdot \tau_{g} \cdot \alpha_{P V} \cdot\left(1-\eta_{e l}\right)$ (1)
where, G is the total irradiance that hits the PV module, τg and αPV are the transmission coefficient of the glass cover and the absorption coefficient of the cells.
The electrical efficiency of the module, ηel is calculated by:
$\eta_{e l}=\eta_{S T C}\left[1-\gamma\left(T_{P V}-T_{S T C}\right)\right]$ (2)
where, ηSTC is the efficiency at the temperature at Standard Test Condition (STC), TPV and TSTC are the current cell temperature and the temperature at STC, and γ is the temperature coefficient of the PV module.
The heat dissipated via convection and radiation to the surroundings from the front qT (Eq. (3)) and back qB (Eq. (4)) surface of the PV-PCM system are calculated as follows:
$\dot{q}_{T}=h\left(T_{g}-T_{q a}\right)+\sigma_{0} \cdot \varepsilon \cdot F_{T, s}\left(T_{g}^{4}-T_{s k y}{ }^{4}\right)$ (3)
$\dot{q}_{B}=h\left(T_{a}-T_{b}\right)+\sigma_{0} \cdot \varepsilon \cdot F_{T b, g}\left(T_{b}^{4}-T_{s k y}^{4}\right)$ (4)
where, h is the convective heat transfer coefficient (a combination of natural and forced convection) between the top surface and the ambient, Ta is the ambient temperature, σ is the Stefan–Boltzmann constant, ε is the emissivity of the top/back surface for long-wavelength radiation,
FT,s and Fb,s are the respective view factors of the top surface to sky and ground. Tsky and Tg are the sky and ground temperatures respectively.
The temperature of the sky is calculated by Eq. (5) and FT,s and Fb,s are calculated with Eqns. (6-7) and β represent the angle of inclination (tilt ) of the PV panel.
$T_{s k y}=0.0552 \cdot T_{a m b}^{1.5}$ (5)
$\mathrm{F}_{\mathrm{T}, \mathrm{s}}=\frac{1+\cos \beta}{2}$ (6)
$\mathrm{F}_{\mathrm{Tb}, \mathrm{g}}=\frac{1+\cos \beta}{2}$ (7)
According to Skoplaki et al. [28] the convective heat transfer coefficient is calculated using a simplified formulation Eq. (8), where u is the wind velocity in m/s.
$h=5.70+3.80 \cdot u$ (8)
It is worth to nothing that Kaplani and Kaplanis [29] had presented a more exhaustive expression for calculating convective heat transfer coefficient as a function the Grashof and Reynolds numbers.
Within the solid part of the system, the heat transfer process is governed by conduction, described as in Eq. (9)
$\frac{k_{i}}{\rho_{i} C_{i}} \frac{\partial^{2} T_{i}}{\partial^{2} y}=\frac{\partial T_{i}}{\partial \tau}$ (9)
ρi, Ci, Ti and ki are the density, specific heat, temperature and thermal conductivity of the different layers.
The properties of the PCM were considered as a function of temperature for taking into account of its phase change.
The energy absorbed by phase change material from solid state at temperature Ts to complete melting at temperature Tl and beyond, (i.e. through the melting point Tm) is calculated by Eq. (10):
$Q=m\left\{\int_{T_{S}}^{T_{m}} C_{p s} d t+H+\int_{T_{m}}^{T_{l}} C_{p l} d t\right\}$ (10)
where, Cps and Cpl are the specific heat of the solid and liquid phases, Ts, Tl and Tm are the temperatures of the solid, liquid and melting/fusion of the material,
H is the phase change enthalpy or alternately, the latent heat of fusion/solidification (kJ/ kg-1).
Assuming for each phase a constant specific heat, the temperature field is defined by Eq. (11) [13]:
$T=\left\{\begin{array}{ccc} T o+\frac{Q}{c_{p s}} ; T<T_{m}\text { (solid ph.) } \\ T_{m}; \quad T>T_{m} 0<Q<H \quad \text { (melt zone) } \\ T_{m}+\frac{(Q-H)}{c_{p l}} ; T>T_{m}\quad Q \geq H \text { (liquid ph.) }\end{array}\right.$ (11)
Q = energy absorbed by phase change material (kJ kg-1).
3.1 Fluid dynamic simulation
The PV-PCM and the conventional PV module have been simulated using the ANSYS Fluent software under unsteady-state analysis [30]. The temperature of the melted PCM is calculated by solving the conservation equations for mass, momentum and energy [30, 31].
Conservation of mass (continuity) for the $i^{t h}$ direction
$\frac{\partial \rho}{\partial t}+\frac{\partial}{\partial x_{i}}\left(\rho \cdot u_{i}\right)=0$ (12)
Conservation of momentum
$\begin{aligned} \frac{\partial}{\partial t}\left(\rho \cdot u_{j}\right)+\frac{\partial}{\partial x_{i}} &\left(\rho \cdot u_{i} \cdot u_{j}\right) =-\frac{\partial p}{\partial x_{i}}+\frac{\partial \tau_{i j}}{\partial x_{i}}+\rho \cdot g_{i}+F_{i} \end{aligned}$ (13)
Conservation of energy
$\begin{aligned} \frac{\partial}{\partial t}(\rho \cdot J)+\frac{\partial}{\partial x_{i}} \cdot &\left(\rho \cdot u_{i} \cdot J\right) =\frac{\partial}{\partial x_{i}}\left(k+k_{t}\right) \cdot \frac{\partial T}{\partial x_{i}}+S_{h} \end{aligned}$ (14)
Among the available Reynolds Averaged Navier Stokes (RANS) turbulence models, a two-equation (k-ε) model has been applied. Such models are based on transport equations for the turbulence kinetic energy (k) and its dissipation rate (ε). For the standard k- ε model these equations are:
Turbulent kinetic energy (k) Eq. (15)
$\rho \frac{D k}{D t}=\frac{\partial}{\partial x_{i}}\left[\left(\mu+\frac{\mu_{t}}{\sigma_{h}}\right) \frac{\partial k}{\partial x_{i}}\right]+G_{h}+G_{b}-\rho \varepsilon$ (15)
Kinetic energy of turbulence dissipation (ε) Eq. (16)
$\rho \frac{D \varepsilon}{D t}=\frac{\partial}{\partial x_{i}}\left[\left(\mu+\frac{\mu_{t}}{\sigma_{t}}\right) \frac{\partial \varepsilon}{\partial x_{i}}\right]+C_{1 \varepsilon} \frac{\varepsilon}{k}\left(G_{k}+C_{3 \varepsilon} G_{b}\right)-C_{2 \varepsilon} \rho \frac{\varepsilon^{2}}{k}$ (16)
where, $G_{k}$ represents the generation of turbulent kinetic energy due to the mean velocity gradients, $G_{b}$ is the generation of turbulent kinetic energy due to buoyancy, $C_{1 \varepsilon}, C_{2 \varepsilon}$ and $C_{3 \varepsilon}$ are constants. $\sigma_{h}$ and $\sigma_{t}$ are the turbulent Prandtl numbers for “k” and “ε” respectively. The turbulent dynamic for momentum μt, in the conservation equations and the k-ε turbulence model equations, is related to k and ε by Eq. (17).
$\mu_{t}=\rho C_{\mu} \frac{k^{2}}{\varepsilon}$ (17)
3.2 Geometry, mesh and boundary conditions
A bi-dimensional geometry, which includes the layers of the PV module was created by making distinct bodies for Glass, EVA-Silicon-EVA, Tedlar, Aluminium and PCM layers.
The mesh is of structured type, a quadrilateral grid was generated, with the smallest size of 0.1 per 0.3∙mm while the largest size was 0.7∙per 0.8∙mm. Further reduction of the size of the cell gives rise to change in the results of about ±0.2℃.
The quality of the mesh used is confirmed by its orthogonal quality and skewness, that resulted to be 1.0 and 0.0 respectively.
Then, wall boundary conditions (WBC) are chosen, selecting them among five different options, which are heat flux, temperature, convection, radiation and mixed (combined external radiation and external convective heat transfer).
This latter WBC was selected for taking into account for both convection and radiation heat fluxes.
Unsteady weather conditions for the air temperature, solar irradiance and wind velocity are defined through customized User Defined Functions (UDFs).
Thus, four User Defined Functions have been built for the variables outdoor temperature, solar irradiation, radiative heat fluxes between the glass and the sky and the radiative heat fluxes between the back of the panel and the ground. For each variable, a polynomial time-dependent function has been derived. In the polynomial function, time is expressed in seconds. The simulations have been carried out using a time step of 500 sec.
The numerical convergence of the model was based on the scaled numerical residuals of all the computed variables. The value of 10-3 was chosen for continuity, velocity and turbulence residuals, while energy and radiation residuals were set at 10-6. The solution converges after 200 iterations.
As regard the convergence analysis, in accordance with other literature studies [16, 32] it was observed that reduction of the space grid beyond 1mm does not lead to significant improvement in the results.
3.3 Electric yield
The temperature of the PV cells, calculated through the CFD simulation, were in turn used for calculating the electrical efficiency by Eq. (4).
Thus, the power generated (Pel)is calculated by Eq. (18):
$P_{e l}=\eta_{e l} \cdot A_{P V} \cdot G$ (18)
where, APV is the surface of the PV cells.
The daily energy yield product is determined from Eq. (19):
$E_{e l}=\int P_{e l} \cdot d t$ (19)
The investigated commercial PV has a reference has efficiency (ηSTC) of 17% and a thermal coefficient (γ) of 0.004 /K. The investigated PV-PCM unit is constituted by the above-mentioned PV module, to which a PCM’s layer, bounded by a composed of two aluminium sheet, is added.
Table 2 shows the thermophysical properties of the layers that make up the PV module, as well as the features of the aluminium box which contains the PCM material.
Table 2. Thermophysical properties of the PV module
|
|
C kJ/kg∙K |
k W/mK |
density kg/m3 |
Thickness mm |
|
Glass |
0.500 |
1.8 |
3,000 |
4.0 |
|
EVA |
2.090 |
0.35 |
960 |
0.5 |
|
Silicon-cell |
0.677 |
148 |
2,330 |
0.3 |
|
Tedlar |
1.250 |
0.2 |
1,200 |
0.1 |
|
Aluminium |
0.903 |
211 |
2,675 |
4.0 |
Six centimetres of PCM’s thickness was chosen, as it is suggested for a climate with intense solar radiations, high temperatures and weak wind [17].
Two configurations are investigated, the former using the PCM Rubitherm 28 HC (PV-PCMRT28) and latter the PCM Rubitherm 35 HC (PV-PCMRT35), both PCMs accumulate a respectable amount of energy during the solidification and the melting processes and good stability.
The main features of Rubitherm 28 and 35 HC are indicated in Table 3.
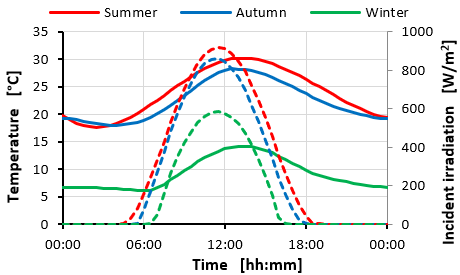
A facing south PV module with a tilt angle of 30 degrees, under the weather conditions of Catania (IT) (37° 30' 0" N - 15° 6' 0" E), derived from the PV-GIS database [33] has been used in the numerical simulations.
Figure 3 depicts the solar irradiation and the outdoor temperature at the solstices (winter and summer) and the autumn equinox.
A constant winds velocity of 1.0 m/s is assumed for the CFD simulations. To investigate if the PCM achieve the complete cycle of melting and solidification happens during the day, the simulations have been extended for a time of 48 h.
Table 3. Properties of Rubitherm 28 and 35 HC
|
|
|
Rubitherm 28 HC |
Rubitherm 35 HC |
|
Tmelting |
℃ |
27$\div$29 |
34$\div$36 |
|
Tcongeling |
℃ |
29$\div$27 |
36$\div$34 |
|
H1 |
kJ/kg |
250 |
240 |
|
CP |
kJ/kg∙K |
2.00 |
2.00 |
|
ρsolid |
kg/liter |
0.88 |
0.88 |
|
ρliquid |
kg/liter |
0.77 |
0.77 |
|
k |
W/m∙K |
0.20 |
0.20 |
Notes: 1 Combination of latent and sensible heat in a temperature range, respectively for Rubitherm 28 HC and 35 HC from 21℃ to 36℃ and from 27℃ to 42.
Figure 3. Solar radiation (dashed line) and temperature (continuous line) at solstices and autumn equinox
Such an extended period is necessary to control the state of the PCM during the night. If the PCM does not fully solidify the energy stored will be lesser than the theoretical one.
In this section, the energy performances of a conventional PV module are compared with that of the two PV-PCM units, namely PV-RT 28 and PV- RT35.
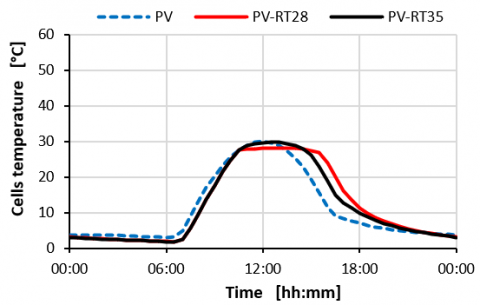
Figure 4 shows the temperatures of the photovoltaic cells for the two PV-PCM units and conventional PV module at the summer solstice. The results are referred to the second day of simulation
The two PV-PCM units allow achieving PV cell temperature lower than that of the conventional PV.
Figure 4. PV cell temperatures - summer solstice
In particular, the PV-PCMRT35 in comparison to the conventional module allows maintaining lower cell temperatures during the whole day. The maximum difference of 20℃ is verified at noon.
From 6:00 to about 10:00, PV-PCMRT28 achieve the lowest cell temperature then the temperature rises abruptly as the PCM is completely melted. However, the maximum cell temperature remains about 8.0℃ lesser than the highest temperature reached by the conventional PV module.
It has to be highlighted that the cooling of the PV cell is less efficient in the PV-PCM units. Indeed on the late afternoon, the cell temperatures of the PV-PCM units are higher than the cell temperature of the conventional PV module.
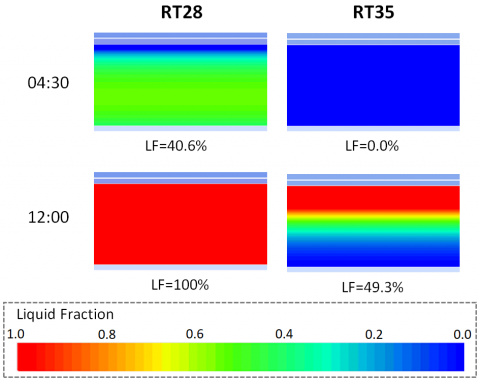
In Figure 5 the rate of liquefaction for the two PCMs at 4:30 and 12:00 are depicted.
At noon the PV-PCMRT28 is fully melted, instead of the PV-PCMRT35, due to its higher melting temperature, (34-36℃), has a liquid fraction of 49.3% yet. Thus, the RT35 may store heat along with the whole daytime, reaching a liquid fraction of 93.8% at 16:30.
Figure 5. Liquid fraction (LF) at the summer solstice
The PV-PCMRT28 does not completely solidify overnight, it achieves a liquid fraction (LF) of 40.6% at 4:30, instead, the PV-PCMRT35 achieves a total solidification during the night, LF of 0% at 4:30. So the entire the heat of fusion will be available along the day.
Figures 6 and 7 show the PV cell temperature for the three systems at the autumn equinox and winter solstice respectively.
Figure 6. PV cell temperature - autumn equinox
Figure 7. PV cell temperatures-winter solstice
At the autumn equinox, both the PV-PCM units have cell temperatures lower than those of the conventional PV unit for many parts of daytime.
Once again the cooling of the PV cell is less efficient in the PV-PCM units, especially the PV-PCM RT35.
Such critical conditions deriving by the higher melting temperature the PV-PCM RT35 that delay the transition from liquid to solid under the weather conditions during the autumn season.
Like happens at the summer solstice, on the late afternoon the cell temperatures of conventional PV module are lower than the cell temperatures of the two PV-PCM units. However, as the solar radiation on the late afternoon is weak, such drawback is of scarce significance in terms of energy yield.
At the winter solstice, any remarkable differences emerge between the three PV configurations. Indeed, the cell’s temperatures are always lower than 30℃ for the whole day, so the PV-PCMRT35 cannot melt. The cell’s temperatures of the PV-PCMRT28 are about 28℃, so close its melting state.
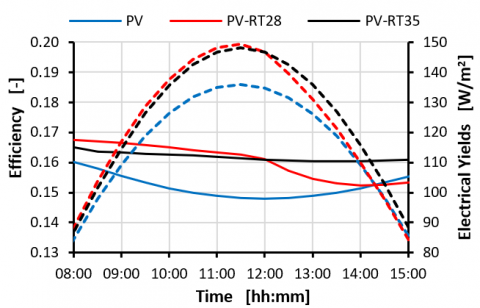
Figure 8. Electrical efficiency and yields - summer solstice
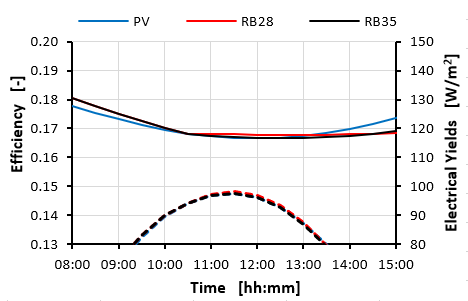
Figure 9. Electrical efficiency and yields - winter solstice
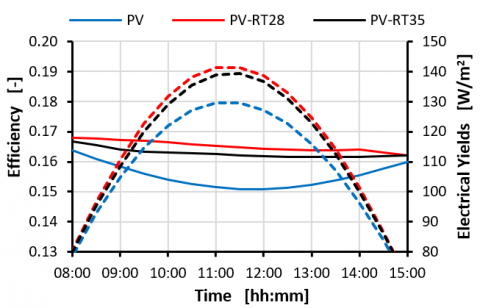
Figure 10. Electrical efficiency and yields -autumn equinox
It has again observed that the cell temperature of the two PV-PCM units is higher than the cell temperatures of the conventional PV module. This behaviour deriving by the thermal insulation of the PCM layer that reduces the cooling of the PV cells. Thus, during the winter season, the addition of the PCM does not give useful contribute to increasing the energy yield of the PV module.
Figures 8, 9 and 10 depict the electrical efficiency (continuous lines) and power (dashed lines) at the solstices and the autumn equinox.
At the summer solstice and the autumn equinox, the two PV-PCM units attain efficiency and power production higher than the power production achieved by the conventional PV module.
The electrical efficiencies of the PV-PCM units are greater than 16% throughout the day, this means that the efficiency is close to the one at STC condition.
At the autumn equinox, the two PV-PCM have very similar performances with a slight prevalence for the PV-PCM RT28 unit. Instead at the summer solstice, the PV-PCMRT28 operates at the lowest efficiency in the afternoon of the summer solstice. Such critical condition is because such PV-PCM unit is totally melted and so is not able to further store heat.
A similar trend is observed for the power production which is a direct function of the electrical efficiency.
At noon of the summer solstice, the PV-PCMRT35 allows achieving growth of power production of about 10.00 W/m2, which corresponds to 10.0% of improvement in comparison to the conventional PV module.
At noon of the autumn equinox, the PV-PCM units allow attaining a growth of the peak of power production of about 9.1% for RT28 and 7.5% for RT35 in comparison to the conventional PV module.
At the winter solstice, the three PV modules do not give rise to remarkable differences for the electrical efficiency or power.
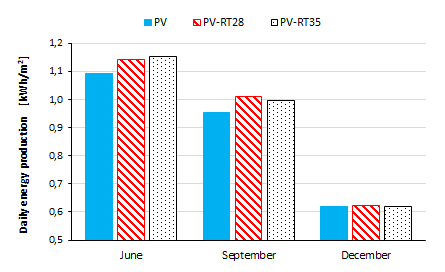
The daily electrical yields of the three PV-module configurations are depicted in Figure 11.
Figure 11. Daily electrical yields
At the winter solstice, the three PV-module configurations produce the same electrical yields.
At the autumn equinox and summer solstice, the two PV-PCM units attain an energy yield higher than the conventional PV-module.
Table 4 reports the daily energy production for the three PV units.
The PV-PCMRT28 and PV-PCMRT35 units generate 4.6% and 5.6% more power in comparison to the conventional PV module, at the summer solstice.
Table 4. Properties of Rubitherm 28 and 35 HC
|
|
PV kWh/m2day-1 |
PV-RT28 kWh/m2d-1 |
PV-RT35 kWh/m2d-1 |
|
January |
0.846 |
0.852 |
0.843 |
|
February |
1.042 |
1.042 |
1.042 |
|
March |
1.161 |
1.206 |
1.188 |
|
April |
1.224 |
1.242 |
1.224 |
|
May |
1.188 |
1.256 |
1.242 |
|
June |
1.092 |
1.142 |
1.153 |
|
July |
1.126 |
1.175 |
1.197 |
|
August |
1.147 |
1.200 |
1.224 |
|
September |
0.956 |
1.010 |
0.998 |
|
October |
1.025 |
1.077 |
1.060 |
|
November |
0.870 |
0.906 |
0.892 |
|
December |
0.621 |
0.622 |
0.621 |
|
Average daily Production |
1.025 |
1.061 |
1.057 |
At the autumn equinox, the PV-PCMRT28 give rises to an increase of energy production of about 5.7%, respect to the conventional PV-module.
As a general result the PV-PCMRT28, which has a lower melting temperature, provide better performances during the spring and autumn season, while the PV-PCMRT35 attains the better performances during the summer season.
Finally, it is possible to observe that the PV-PCM units give rises to the average growth of the daily yield production of 3.54% and 3.17% for PV-PCMRT28 and PV-PCMRT35 respectively.
In this study, the electrical performances of a PV module equipped with two different PCM have been analysed.
The CFD Fluent software has been used for evaluating the thermal and electrical behaviour of the PV-PCMRT28 and PV-PCMRT35 units.
The computational fluid dynamic simulations were carried out for several consecutive days in such a way to correctly take into account the actual degree of solidification of the PCM material developed during the night-time.
Then, the performances of these two PV-PCM units have been compared with that one of a conventional PV module under the same operative conditions.
This study has been carried out considering the weather conditions for Catania (IT) at different days of the year.
The results of simulations highlight that the PV-PCM units operate with lower cell temperature in comparison to the conventional module. Consequently, an increase in electrical performance is achieved, mainly during the summer period. The performance of the different PV units are almost similar during the winter months
The PV-PCMs allows achieving an increase in terms of peak electric power even higher than 9% compared to PV modules without PCM and an increase of the daily energy yield of about 5.5%.
During the hottest days, the PV-PCMRT35 unit achieves cooling effect greater than the PV-PCMRT28, as the former has the highest melting temperatures.
It is worth of interest to highlight that RT28 runs out of its functionality after midday.
Another significant observed outcome is the incomplete solidification of RT 28 during the night.
Therefore, for correctly evaluate the performances of a PCM extend the period of simulation at least for 48h is mandatory.
As well to observe the variation of behaviour climatic conditions of the site of interest throughout the year.
Thus, the outcomes of this study indicate that the daily electrical yields rose by 4.6% and 5.6 % for PV-PCMRT28 and PV-PCMRT35 unit respectively at the summer solstice, of about 5.7% and 4.4% for PV-PCMRT28 and PV-PCMRT35 unit at the autumn equinox, in comparison to the conventional PV module.
No significative differences emerge at the winter solstice.
Finally, it is possible to point out that the PV-PCM units give rises to an average increase of the daily yield production of 3.54% and 3.17% for PV-PCMRT28 and PV-PCMRT35 respectively.
Although this research follows a similar approach of other literature studies based on fluid dynamic simulations, a necessary further step for this research is the validation of the results presented in this study trough experimental surveys.
This research is funded by the " research project PIACERI 2020" of the Department of Electric, Electronics and Computer Engineering of the University of Catania.
|
C |
specific heat |
[kJ/kg K] |
|
E |
energy |
[kJ] |
|
F |
view factor |
[-] |
|
G |
solar irradiation |
[W/ m2] |
|
H |
latent heat |
[kJ/ kg] |
|
H |
convection coefficient |
[W/m2 K] |
|
LF |
liquid fraction |
[- ] |
|
K |
Thermal conductivity |
[W/ m K] |
|
P |
power |
[W] |
|
$\dot{\mathrm{q}}$ |
Specific heat flux |
[W m2] |
|
T |
temperature |
[°C] |
|
w |
wind velocity |
[m/ s] |
|
Greek symbols |
||
|
$\alpha$ |
absorption coefficient |
[-] |
|
$\beta$ |
tilt angle |
[rad] |
|
γ |
PV thermal coefficient |
[1/K] |
|
ε |
emissivity |
[-] |
|
η |
PV efficiency |
[] |
|
ρ |
density |
[kg/m3] |
|
σ0 |
Stefan-Boltzmann costant |
[W/ m2K4] |
|
τ |
transmission coefficient |
[W/ m2K4] |
|
Subscripts |
||
|
eff |
effective, available |
|
|
el |
electrical |
|
|
g |
glass |
|
|
l |
liquid phase |
|
|
m |
melting |
|
|
PV |
photovoltaic |
|
|
rad |
radiative flux |
|
|
s |
solid phase |
|
|
STC |
standard test conditions |
|
[1] Scavo, F.B., Tina, G.M., Gagliano, A., Nizetic, S. (2021). An assessment study of evaporation rate models on a water basin with floating photovoltaic plants. International Journal of Energy Research, 45(1): 167-188. https://doi.org/10.1002/er.5170
[2] Tina, G.M., Gagliano, A. (2016). An improved multi-layer thermal model for photovoltaic modules. Multidisciplinary Conference on Computer and Energy, (SpliTech), pp. 1-6. https://doi.org/10.1109/SpliTech.2016.7555927
[3] Zubeer, S.A., Mohammed, H.A., Ilkan, M. (2017). A review of photovoltaic cells cooling techniques. E3S Web of Conferences, 22: 00205. https://doi.org/10.1051/e3sconf/20172200205
[4] Siecker, J., Kusakana, K., Numbi, B.P. (2017). A review of solar photovoltaic systems cooling technologies. Renewable and Sustainable Energy Reviews, 79: 192-203. https://doi.org/10.1016/j.rser.2017.05.053
[5] Lupul, A.G., Homutescu, V.M., Balanescu, D.T., Popescu, A. (2018). A review of solar photovoltaic systems cooling technologies. IOP Conf. Series: Materials Science and Engineering, 444(8): 082016. https://doi.org/10.1088/1757-899X/444/8/082016
[6] El Manssouri, O., El Fouas, C., Hajji, B., Rabhi, A., Tina G.M., Gagliano, A. (2020). Modeling and performances assessments of PV/T bifluid hybrid collector: Three cooling modes operation case. 2020 International Conference on Electrical and Information Technologies (ICEIT), pp. 1-6. https://doi.org/10.1109/ICEIT48248.2020.9113233
[7] Tina, G.M., Grasso, A.D., Gagliano, A. (2015). Monitoring of solar cogenerative PVT power plants: Overview and a practical example. Sustainable Energy Technologies and Assessments, 10: 90-101. https://doi.org//10.1016/j.seta.2015.03.007
[8] Gagliano, A., Tina, G.M., Aneli, S., Nižetić, S. (2019). Comparative assessments of the performances of PV/T and conventional solar plants Journal of Cleaner Production, 219: 304-315. https://doi.org/10.1016/j.jclepro.2019.02.038
[9] Aneli, S., Gagliano, A., Tina, G.M., Hajji, B. (2020). Analysis of the energy produced and energy quality of nanofluid impact on photovoltaic-thermal systems. International Conference on Electronic Engineering and Renewable Energy, pp. 739-745. https://doi.org/10.1007/978-981-15-6259-4_77
[10] Atkin, P., Farid, M.M. (2015). Improving the efficiency of photovoltaic cells using PCM infused graphite and aluminium fins. Solar Energy, 114: 217-228. https://doi.org/10.1016/j.solener.2015.01.037
[11] Gagliano, A., Nocera, F. (2017). Analysis of the performances of electric energy storage in residential application. International Journal of Heat and Technology 35(S1): S41-S48. https://doi.org/10.18280/ijht.35Sp0106
[12] Buonomo, B., Cirillo, L., Diana, A., Di Pasqua, A., Ercole, D., Fardella, V., Manca, O., Nardini, S. (2020). Thermal energy storage systems. TECNICA ITALIANA-Italian Journal of Engineering Science, 64(1): 39-44. https://doi.org/10.18280/ti-ijes.640108
[13] Huang, M.J., Eames, P.C., Norton, B. (2006). Thermal regulation of building-integrated photovoltaics using phase change materials. Int. Journal of Heat and Mass Transfer, 47: 2715-2733. https://doi.org/10.1016/j.ijheatmasstransfer.2003.11.015
[14] Kibria, M.A., Saidur, R., Al-Sulaiman, F.A., Aziz, M.M.A. (2014). Development of a thermal model for a hybrid photovoltaic module and phase change materials storage integrated in buildings. Sol Energy, 124: 114-123. https://doi.org/10.1016/j.solener.2015.11.027
[15] Kant, K., Shukla, A., Sharma, A., Biwole, P.H. (2016). Heat transfer studies of photovoltaic panel coupled with phase change material. Solar Energy, 140: 151-161. https://doi.org/10.1016/j.solener.2016.11.006
[16] Khanna, S., Reddy, K.S., Mallick, T.K. (2017). Performance analysis of tilted photovoltaic system integrated with phase change material under varying operating conditions. Energy, 133: 887-899. https://doi.org/10.1016/j.energy.2017.05.150
[17] Ma, T., Zhao, J., Han, J. (2017). A Parametric Study about the Potential to Integrate Phase Change Material into Photovoltaic Panel. 9th International Conference on Applied Energy, ICAE2017, Cardiff, UK.
[18] Stropnik, R., Stritih, U. (2016). Increasing the efficiency of PV panel with the use of PCM. Renewable Energy, 97: 671-679. https://doi.org/10.1016/j.renene.2016.06.011
[19] Nouira, M., Sammouda, H. (2018). Numerical study of an inclined photovoltaic system coupled with phase change material under various operating conditions. Applied Thermal Engineering, 141: 985-975. https://doi.org/10.1016/j.applthermaleng.2018.06.039
[20] «PureTemp,». https://www.puretemp.com/stories/understanding-pcms, accessed on 31 March 2021.
[21] Grigolato, F. (2016). Problemi e potenzialità degli accumuli termici a cambiamento di fase Progetto di un impianto di prova. Padova. http://tesi.cab.unipd.it/50305/1/Tesi_Francesco_Grigolato.pdf.
[22] Salunkhe, P., Shembekar, P.S. (2012). A review on effect of phase change material encapsulation on the thermal performance of a system, 16(8): 5603-5616. https://doi.org/10.1016/j.rser.2012.05.037
[23] Colla, L., Fedele, L., Mancin, S., Danza, L., Manca, O. (2017). Nano-PCMs for enhanced energy storage and passive cooling applications. Applied Thermal Engineering, 110: 584-589. https://doi.org/10.1016/j.applthermaleng.2016.03.161
[24] Song, M., Niu, F., Mao, N., Hu, Y., Deng, S. (2017). Review on building energy performance improvement using phase change materials. Energy and Building, 158: 776-793. https://doi.org/10.1016/j.enbuild.2017.10.066
[25] Casano, G., Piva, S. (2015). Parametric analysis of a PCM energy storage system. International Journal of Heat and Technology, 33(4): 61-68. http://dx.doi.org/10.18280/ijht.330408
[26] Jaworski, M. (2012). Thermal performance of heat spreader for electronics cooling with incorporated phase change material. Applied Thermal Engineering, 35: 212-219. https://doi.org/10.1016/j.applthermaleng.2011.10.036
[27] «PCM PlusICE,». www.pcmproducts.net, accessed on 31 March 2021.
[28] Skoplaki, E., Boudouvis, A., Palyvos, J. (2008). A simple correlation for the operating temperature of photovoltaic modules of arbitrary mounting. Solar Energy Materials and Solar Cells, 92(11): 1393-1402. https://doi.org/10.1016/j.solmat.2008.05.016
[29] Kaplani, E., Kaplanis, S. (2014). Thermal modelling and experimental assessment of the dependence of PV module temperature on wind velocity and direction, module orientation and inclination. Sol. Energy, 107: 443-460.https://doi.org/10.1016/j.solener.2014.05.037
[30] Aneli, S., Arena, R., Gagliano, A. (2020). Transient analysis of photovoltaic module integrated with Phase Change Material (PCM). TI-IJES, 64(2-4): 186-192 https://doi.org/10.18280/ti-ijes.642-409
[31] Wilcox, D.C. (1998) Turbulence Modeling for Cfd. Dcw Industries Incorporated, Glendale, California.
[32] Khanna, S., Reddy, K.S., Mallick, T.K. (2018). Optimization of finned solar photovoltaic phase change material (finned pv pcm) system. International Journal of Thermal Sciences, 130: 313-322. https://doi.org/10.1016/j.ijthermalsci.2018.04.033
[33] https://ec.europa.eu/jrc/en/pvgis, accessed on 2 March 2020.