Rouhollah Moosavi* | Mohsen Golabi
© 2020 IIETA. This article is published by IIETA and is licensed under the CC BY 4.0 license (http://creativecommons.org/licenses/by/4.0/).
OPEN ACCESS
In this paper, the effect of the form and the shape of the exhibition on the performance of the absorption of solar energy in both cold & mountainous and hot & dry climates has been investigated. The form as the most prominent design feature in buildings has a significant impact on energy efficiency and can be expressed in different ways in a building. In order to evaluate the energy performance of various geometries as an exhibition, the absorption of solar energy in several geometries with different shapes, such as: hexagonal / pyramid / prism / incomplete prism / rectangular cube / cube / hemisphere / cylinder / cylinder combination and the rectangle cube combination, have been numerically simulated. For all geometries, the total area and other simulation conditions are assumed to be the same. The results show that in both types of climate, the most absorbed solar energy is obtained for pyramidal geometry and the least absorption is obtained by hemispherical geometry. The hemisphere form in the hot and dry climate has the best form-to-type ratio in order to provide thermal comfort and reduce energy consumption during the exhibition. In the cold and mountainous climate, pyramidal geometry has the highest energy absorption and is the best option among all investigated geometries. The absorption of solar energy in hemispherical geometry for hot & dry and cold & mountain climate is 66% and 54% compared to pyramidal, respectively.
energy optimization, exhibition, building form, cold & mountain climate, hot & dry climate, solar energy
The construction sector is one of the main energy consuming sectors and therefore it is necessary to pay particular attention to the optimization of energy consumption in buildings. New energies or solar energy can be used as one of the energy sources in buildings in order to make the best utilization of heat and power requirements and, if necessary, to supply electricity for buildings. One of the effective factors in reducing energy consumption is the design of a building form that minimizes cooling and heating requirements of buildings by applying solar designs.
Buildings all around the world need a lot of energy to cool and heat, while the cost of electrical energy is constantly rising [1, 2]. Energy used in buildings in Europe is about 40% of total energy consumption, of which about two thirds are used in private buildings [3]. Other sources claim that in industrialized countries, energy consumption in buildings accounts for about 50% of carbon dioxide emissions [4, 5]. In the past years, southern Europe countries such as Italy, Spain, etc., has experienced an increase in cooling energy consumption, which is expected to grow in the coming decades [6-8]. Population growth, energy loss and pollution caused by fossil fuels are factors that make every day human future constraints and risks. Fossil fuels are declining and global demand for energy is rising rapidly, and many countries must seek sustainable development by creating and acquiring sustainable energy [9, 10]. Indeed, global warming and climate change are vital issues that significantly affect the evolution of the environment and human attitudes [11].
Currently, humans use artificial methods and fossil fuels to provide comfort in the building, which is not only expensive but also degrades the environment. Therefore, the attention of the architects and construction industry has come to use more of natural factors for heating and cooling of the building. Given the available constraints, only using the correct methods of consumption, optimization of energy consuming devices and the use of new energies can curb the energy crisis. Renewable energy is the sustainable energy derived from the natural environment. Renewable energy is important for future environmental protection and economic development as it significantly contributes to the reduction of greenhouse gas emissions and national energy security [12, 13]. In addition, the comfort of modern living conditions is achieved at the expense of vast energy sources. Therefore, governments and engineers often struggle to exploit renewable energy sources to minimize conventional energy costs and improve living standards [14]. Among renewable energy sources, solar energy is considered as a free, clean, unlimited energy source, environmentally and economically [15]. In addition, solar energy is also very cost effective. Compared to conventional energy, investing in solar equipment will provide long-term energy for future generations [16]. Therefore, the utilization of solar energy in buildings can be used to support sustainable buildings, such as rating systems, namely, energy leadership, environmental designer and green star [14]. Solar energy technologies have been widely used due to the rapid development of these technologies and the gradual reduction of solar energy utilization costs in buildings [17, 18].
The construction sector is one of the most popular energy consuming sectors, and therefore, it is necessary to pay particular attention to the energy efficiency improvement of the building. Furthermore, the shape and geometry of the building has a very important effect on the cost of building and consuming energy [19-21]. Wang et al. [22] examined the size and direction of the building in terms of thermal load performance, and concluded that by optimizing these two parameters, it is possible to save 40% of energy economically. The development of the building form during the design process will undoubtedly have a greater impact on energy efficiency. The development of building form has a significant effect on the energy performance of the building. Four basic principles are needed for energy efficiency in a building: (1) building design based on zero energy before actual construction, (2) using low energy building materials during its construction, (3) use of energy efficient equipment because of low need for operational energy and, (4) the use of renewable energy technologies [3, 23]. On the other hand, buildings are one of the areas that have the greatest potential to improve global energy efficiency and sustainable development through relatively low cost strategies [24]. Enhancing the structure and systems of building with active and inactive energy technologies [25-28] or teaching job behavior toward flexible energy approaches can lead to improved building performance [29, 30]. The relationship between the optimal building forms with reduced cooling load was studied by Rashdi and Embi [31]. Their research studies the relationship between optimal building form and reduction of cooling load. This study was conducted using the computer simulation of the Autodesk Ecotect software analysis program, which shows the relationship between building elements and cooling load.
The result of the research showed that the compression ratio and the lower ratio of the surface to volume will have a significant effect on the choice of the type of building to reduce the cooling load. The integration of solar systems into the building has attracted more attention because it provides a new solution to reduce fossil fuel consumption and greenhouse gas emissions by using renewable energies [32]. Providing heat to buildings using the sun is available in both active and passive ways. One of the best energy efficiency strategies in buildings is the use of passive solar energy in buildings, which depends on the quality and architecture of the building to receive and store solar power in the passive state [33]. The use of solar energy in buildings means better utilization of the sunlight in order to meet the heating and cooling needs and, if necessary, to supply electricity for buildings. In the first phase, cooling and heating needs of the buildings are minimized using solar thermal design. In a solar design, two main issues are raised; one is how to design to obtain more efficiency solar energy, and another is how to design in order for minimizing the heat losses in order to make better use of the received energy, and if any of mentioned issues is not addressed, the design will not be efficient. Energy savings through energy efficiency in buildings have gained significant importance around the world [34].
The roof of the building is known as a suitable place for installing solar energy devices. These devices are also fitted with drill bits and can be converted to zero-noise energy and greenhouse gases. In addition, direct use of solar energy in buildings is mainly through solar photovoltaic technology and thermal technologies [35]. The accurate estimation of solar energy on the roof of the building plays an important role in sustainable development and the use of renewable energy in high density habitats [36]. An investigation using numerical analysis through dynamic simulation and roof building optimization of solar energy reflector for office, home and apartment building samples was carried out by Piselli et al. [37]. In their paper, the optimization of solar reflector was investigated to minimize the annual energy demand of a building for air conditioning with different climate conditions.
The design of flexible solar buildings can help to save energy, because building design is directly related to energy use. Buildings with solar building designs naturally use solar energy for heating, cooling, and daylight. It reduces the need for energy from other sources and creates a comfortable environment inside. The principles of inactive solar design are consistent with the diverse architectural styles and can be reconstructed with existing buildings for the use of pure energy [38]. It's important to note that without considering the climate design of the building, solar energy is not cost-effective and it will lead to additional costs. Therefore, in order to reduce the energy demand of a building, its design should be in accordance with the climate of that region. In all of the various climate regions, buildings with design principles of the climate minimize the need for mechanical heating and cooling [39]. Therefore, it is advised to compel designers to adhere to the minimum standards in the region by developing and adapting design rules for housing patterns in accordance with the climate of each region, and also to compile encouraging policy development in the use of solar energy in the building. The shape and form of a building is influenced by the solar energy that it receives which also affects its energy consumption [40]. Doris et al. [41] presented a methodology for achieving an integrated analysis of daylighting and energy consumption of spaces with fully-glazed building façades perforated solar screens during the design stage.
The building of an exhibition has been proposed as a case study in this research. The necessity of choosing an exhibition was due to the variety of its forms. Designers and architects use a variety of forms because buildings have an exterior effect. Compared to other applications, selecting such forms is more appropriate. The building form is the most prominent feature of a building and is very important in terms of energy efficiency. Exhibitions usually work in the hot and cold days of the year, and the energy issues are very important during the work. It may take place at a certain time in the worst period of the year. For this reason, the form and shape of the building of the exhibition can have a great impact on optimizing energy consumption. Therefore, an energy approach must be considered throughout the design and development stages of the process. Thus, the focus of specialists in architectural and design related areas should be based on the design of the building form to ensure less energy consumption in the building, which is one of the most important tools in this field of energy consumption simulation. With regard to the above, various types of research on solar energy technologies, independent photovoltaic technology and a diverse use of solar energy in buildings have been investigated. However, not many studies have taken place simultaneously on the composition of the building form and the amount of solar energy absorbed in different climates, although the building form has a great impact on energy consumption.
In this paper, the effect of the form and geometry of a cultural building (exhibition) on the amount of solar energy absorption in two hot & dry, and cold & mountainous climate regions has been investigated numerically. The purpose of this research is to evaluate the effects of the form and its geometry in a cultural building (exhibition) in order to obtain the most suitable form for the absorption of solar energy. In order to evaluate the energy performance of various geometries as an exhibition, the absorption of solar energy in several geometries with different shapes, such as hexagonal cube / pyramid / prism / incomplete prism / cube rectangle / cube / hemispheric / cylinder / cylinder-rectangular cube combination was simulated. The results of this paper can be used to design the exhibition to optimize energy consumption and use of solar energy efficiently.
The present study was carried out on the design of the exhibition and the effect of the type of form on the thermal performance of the building design and simulation in the software Energy Plus. Computer numerical simulation provided a virtual environment for studying the thermal behavior of building components. In this research, numerical simulation was used in software Energy Plus version 8 to calculate and obtain the types of design and form of the exhibition. In order to obtain the effect of form type and its geometry, a cultural building was designed in the environment of this software according to the conditions of hot and dry, and cold and mountainous climates, and each time it was simulated by applying different forms to optimize the its form and type to provide thermal comfort and reduce energy consumption. Therefore, in designing this exhibition, due to the purpose of research and research, other architectural factors compatible with the climate and effective on reducing energy consumption were also used in design. In order to obtain the best form and geometry of a mobile exhibition to reduce energy consumption, nine different geometry forms are considered for numerical simulation. Using the simulation in Energy Plus software in two hot & dry and cold & mountainous regions, the amount of solar incident (kW/h) calculated to determine the effect of sunlight on different forms of the exhibition and use obtained results to reduce consumed energy and the cost of cooling and heating for the interior of the exhibition. For this purpose, 9 geometries were studied weekly, monthly, and yearly for two hot-dry and cold-mountainous climates.
Simulations are as follows:
- Simulation for a week in the summer = 20 Jul - 26 Jul
- Simulation for a week in the winter = 27 Jan - 2 Feb
- Monthly simulation
- Annually simulation
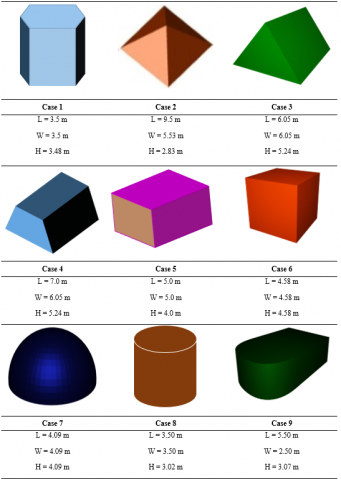
The geometries and forms studied in this study are:
Hexagonal cube / pyramid/ prism / incomplete prism / cube rectangle / cube / hemispheric/ cylinder / cylinder-rectangular cube combination.
2.1 Dimensions of geometry forms
1) Cube with hexagonal base: length of each side of the base = 3.5m and height = 3.48 m
2) Pyramid: The length of the side of the base = 9.5 m, the length of the edge = 5.53 m, and the height = 2.83 m
3) Prism: base = 6.05 m × 6.05 m and height = 5.24 m
4) Incomplete charter: base = 7 m × 6.4 m and height = 3.46 m
5) Rectangle cube: base = 5 m × 5 m and height = 4 m
6) Cube: Base = 4.58 m × 4.58 m and height = 4.58 m
7) Hemisphere: Radius = 4.09m
8) Cylinder: base radius = 3.5 m and height = 3.02 m
9) Cylinder-rectangular cube combination: base = 5 m × 5 m square, radius of circle = 2.5 m and height = 3.07 m
2.2 Walls and ceiling materials
The walls of all forms are identical and the walls and ceiling are composed of four layers.
Wall: Wall consists of 4 layers that are arranged from the outer layer as follows:
• Soil and bricks with thickness of 0.1 m
• XPS - Plaster and air gap thickness of 0.0759 m
• Intermediate concrete blocks (concrete) with thickness of 0.1 m
• Chalk plaster with thickness of 0.013 m
Ceiling: Ceiling consists of 4 layers that are arranged from the outer layer as follows:
• Cement with thickness 0.01 m
• Wool glass rolls with thickness of 0.1445 m
• Air gap with thickness of 0.2 m
• Chalkboard plaster with thickness of 0.013 m
In addition, for all forms, the total area of the walls and ceiling is equal and its value was assumed to be 105 m2.
Table 1. Different forms of exhibition geometry
This study has been conducted for two hot & dry and cold - mountainous weather conditions. Simulations were initially performed for the coldest and hottest week of the year and then for 12 months of the year.
Cold and mountainous climate: the average air temperature in the coldest month of the year is more than 10℃ and the mean of minimum air temperatures is below -3℃. In this climate, winters are long and covered with snow in months of the year. The amount of rainfall in summer is low and in winter is high. It can also be noted of extreme cold and temperate weather in the summer, a large temperature difference between day and night the air and low humidity in this climate. For this weather, the city of Tabriz was proposed with the geographical characteristics listed in Table 1 and all forms of the building were modeled in this climate.
Hot and dry climate: The characteristics of this region can be named the following cases: Low humidity - high temperature fluctuation in during day and night - very low rainfall in the years - the low vegetation coverage. Due to the angle of the sun and other climatic factors in this region, the best direction for the placement of the buildings must be checked according to the angle of the sun. For hot and dry weather conditions, the city of Yazd was proposed with the geographical characteristics listed in Table 2 and all forms of building were modeled in this climate. The characteristics of climates of four different regions mentioned in the Table 2.
Table 2. Classification of climates of four different regions
|
Site: Location |
Yazd - IRN |
Tabriz - IRN |
|
Latitude |
{N 31° 52'} |
{N 38° 2'} |
|
Longitude |
{E 54° 16'} |
{E 46° 10'} |
|
Elevation (m) above sea level |
1,237 |
1,361 |
|
Standard Pressure at Elevation |
87,321 Pa |
86,008 Pa |
|
WMO Station |
408,210 |
407,060 |
|
Maximum Dry Bulb Temperature (℃) |
42.3 |
37.0 |
|
Maximum Dry Bulb Occurs on |
Aug 16 |
Jul 14 |
|
Minimum Dry Bulb Temperature (℃) |
-7.0 |
-15.0 |
|
Minimum Dry Bulb Occurs on |
Jan 3 |
Jan 25 |
|
Maximum Dew Point Temperature (℃) |
15.0 |
18.6 |
|
Minimum Dew Point Temperature (℃) |
-17.0 |
-25.0 |
|
Köppen Classification |
BWh |
BSk |
|
ASHRAE Climate Zone |
2B |
4B |
|
ASHRAE Description |
Hot-Dry |
Mixed-Dry |
The intensity of sunlight and the resulting heat on the ground depends on the weather, the position of the sun and the height of the place. However, the amount of solar energy radiated to a surface, in addition to the above, also depends on the angle at which the sun's rays hit the surface. That is, at one point on the earth's surface and at a given time, the amount of solar energy radiated to surfaces that have different angles to the sun's rays is quite different. There are several methods for calculating the amount of solar energy radiated on surfaces. The amount of solar radiation radiated to a surface on the earth's surface is calculated based on the following equation:
I = Ih + Id + Ic (1)
where, I is the total daily radiation received by the earth's surface, which is composed of various parameters. Ih is an irradiance on surface from sky horizon, Id is an irradiance on surface from sky dome, Ic is an irradiance on surface from circumsolar region. The amount of Ih, Id and Ic are calculated by following equations:
Ih = Ih F2Sin S (2)
Id = Ih (1 – F1) (1 + cos S)/2 (3)
Ic = Ih F1 a/b (4)
where, S is surface tilt, F1 is circumsolar brightening coefficient, F2 is horizon brightening coefficient.
Also, a = max (0, cosα) and b = max (0.087, cosZ), where α is incidence angle of sun on the surface (radians) and Z is solar zenith angle (radians). The brightening coefficients are obtained the following equations:
F1 = F11 (ε) + F12 (ε) Δ + F13 (ε) Z (5)
F2 = F21 (ε) + F22 (ε) Δ + F23 (ε) Z (6)
The sky factor is: Δ = Ih m/Io
where, m is relative optical air mass and Io is extraterrestrial irradiance. Also, the sky clearness factor is:
$\varepsilon=\frac{\frac{I_{h}+I}{I_{h}}+k Z^{3}}{1+k Z^{3}}$ (7)
where, I is direct normal solar irradiance and K is a constant (K = 1.041). The factors of Fij are obtained by Perez et al. [42].
5.1 Validations
The results obtained in this paper were based on numerical and experimental solutions. Nine exhibition buildings were examined in different shapes and forms but at with same cross section. An experimental building of an exhibition was studied for validation. Experimental tests were carried out using thermometer and photometer devices, and the results of these tests indicated that the simulation results with approximately 5 to 6 percent difference in compare with experimental test results is acceptable as a suitable method for this research. In the Table 3, the comparison of temperatures and light intensity at different points from the roof of the building is shown for validation. Comparison of numerical results with experimental results showed that numerical simulation has a very good accuracy. It is worth noting that the accuracy of the measuring instruments for the thermometer, humidity meter, velocity meter and photometric measurements were 0.5℃, 3%, 0.05 m/s and 0.01 lux, respectively.
Table 3. The comparison of the experimental results and simulation model
|
Temperature (℃) |
light intensity (Lux) |
||
|
Exp. |
Num. |
Exp. |
Num. |
|
32.5 |
34.7 |
2050 |
2192 |
|
33.35 |
35.21 |
911 |
952 |
|
26.3 |
28.5 |
682 |
703 |
|
28.9 |
28.30 |
262 |
228 |
|
25.5 |
26.12 |
675 |
718 |
5.2 Simulation results
The form and the various shapes of the exhibition are shown in Table 1. Numerical simulations of different shapes and forms in hot - dry and cold - mountainous climates were initially during one week in the winter and one week in the summer, which were the coldest and hottest weeks of the year, respectively. Then, the simulations were conducted monthly in both the climates and at the end for the whole year.
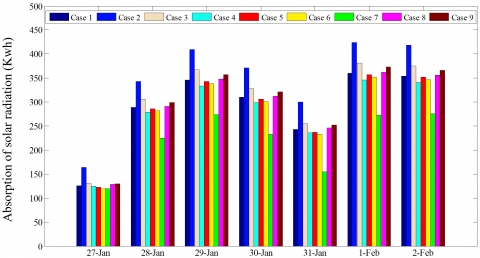
Figure 1 shows the simulation of the absorption of solar energy for one week in winter in hot and dry climate. 9 different exhibition geometries were investigated during the coldest week of the year. Boundary conditions were the same for all geometries. According to statistical data, the weekly investigation was performed during one of the coldest weeks of the winter season. Results of the coldest week in the year showed that hemispherical geometry (Case 7) has the lowest energy absorption and pyramidal geometry (Case 2) has the highest energy absorption. As we can see, the solar absorption rate in hemispherical geometry is almost twice the geometry of all the days of the week.
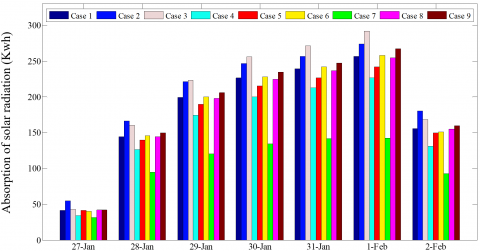
Simulation of a week in winter for absorbed solar radiation in a cold and mountainous climate has been investigated, and Figure 2 shows the amount of solar absorbed energy in kilowatt/hours individually for all forms. According to statistical data, the weekly investigation was conducted in one of the coldest weeks of the winter season. As we can see, Case 7 (hemispherical geometry) in January had the lowest solar incident absorption during this week of the year. Case 2 and Case 3 had the highest amount of solar incident absorption.
Figure 1. The absorption of solar radiation of one week in winter for different geometric forms in hot & dry climate
Figure 2. The absorption of solar radiation of one week in winter for different geometric forms in cold & mountainous climate
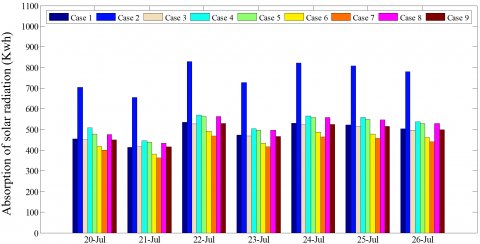
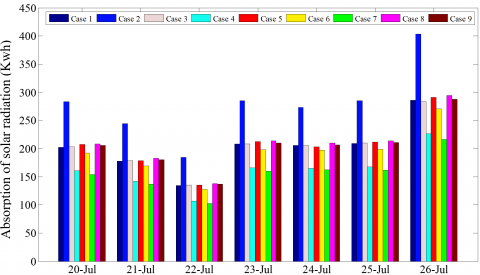
According to Figures 1 and 2, it can be concluded that in both hot & dry climate and cold & mountainous climate during the coldest week of the year, hemispherical geometry has the lowest amount of solar energy absorption compared to the other 8 geometries. It is also observed that pyramidal geometry in both climates had the highest energy absorption, although in the cold and mountainous climate, prism geometry has a high absorption during this week. Figure 3 shows simulations during a week in summer for solar incident in the warm and dry climate for different geometries. The investigated week is one of the hottest weeks of the summer season. Numerical results show that hemispherical geometry (Case 7) in July has the lowest amount of absorption of solar incident during this week of the year, and the pyramidal form (Case 2) has the highest amount of absorption of solar incident.
Figure 4 shows a simulation of a week in summer for the amount of sunlight absorption in a cold and mountainous climate in kW/h individually for all forms. According to the statistics, the surveyed week is one of the hottest weeks in summer. Case 7 (hemispherical geometry) had the lowest amount of solar incident absorption during this week of the year, and case 2 (pyramidal geometry) had the highest solar incident. It can also be said that the amount of solar energy absorbed for the geometry of the incomplete prism (Case 4) in suggested week of the summer was relatively lower for the cold - mountainous climate than for other geometries (except for hemispherical geometry).
Figure 3. The absorption of solar radiation of one week in summer for different geometric forms in hot & dry climate
Figure 4. The absorption of solar radiation during one week of summer for cold & mountainous climate for different forms
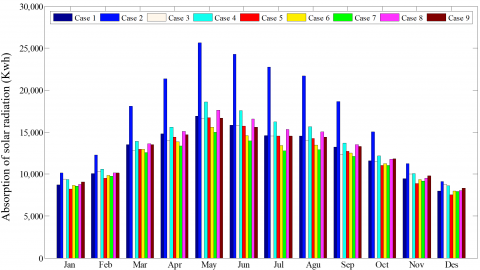
Figures 3 and 4 show the amount of solar energy absorption in the hottest week of summer season in both hot-dry and cold- mountainous climates. The results of these two forms show that in both hot-dry and cold- mountainous climates pyramidal geometry has the highest absorption of solar incident and the hemispherical geometry has the lowest absorption of solar incident absorption. Figure 5 shows the simulation of the monthly energy absorption in 9 different exhibition geometries. In the monthly simulation, absorption of solar incident for 12 months in hot - dry climate was investigated. As shown in Figure 5, Case 7 (hemisphere geometry) has the lowest average absorption of solar incident among all of the seasons. Furthermore, Case 2 (pyramidal geometry) has the highest average solar energy absorption among the different geometries. The results showed that energy absorption in pyramidal geometry (Case 2) is approximately 49% higher than energy absorption in hemispherical geometry (Case 7). It can also be said that imperfect prism geometries and rectangular cubes absorb moderate amount of energy throughout the year. As shown in Figure 5, the maximum energy absorption for pyramidal geometry is from March to September. The highest differences in the absorption of solar incident between pyramidal geometry and hemispherical geometry was in May, June, July, and August ,with 71%, 74%, 78% and 68% differences respectively, and with the lowest differences was in January, February, November and December with 18%, 25%, 22% and 15% differences, respectively.
Figure 5. The monthly simulation of solar absorption for different geometries in the hot & dry climate
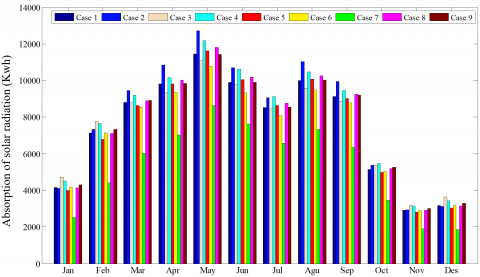
Figure 6. The monthly simulation of solar absorption for different geometries in the cold & mountain climate
Comparison of Figures 5 and 6 showed that the absorption of solar energy in a hot and dry climate is almost twice as high as the energy absorption in the cold and mountainous climate. As you can see, in both climates, pyramidal geometry and hemispherical geometry had the lowest amount of energy absorption. According to the results obtained from the numerical simulation of the energy absorption performance in various geometries related to the exhibition, the hemispherical form has the lowest and the pyramidal form had the highest energy absorption.
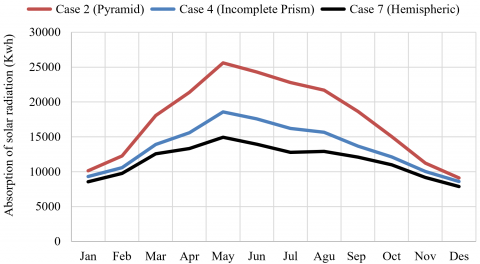
Figure 7 shows monthly simulation of solar energy absorption for three geometric forms. The Hemisphere form (Case 7), which has the lowest energy absorption among all geometries for all 12 months in the hot and dry climate, have risen in the first to fifth months and reached 15,000 kW/h which was the highest absorbed solar incident, and declined from the sixth month to the end of the year, which led to the lowest absorbed solar incident equal to 8,000 kW/h. As we can see, all cases have risen in the first to fifth month, and Case 2 (pyramidal geometry) reached more than 25,000 kW/h and had the highest solar incident absorption, and absorbed solar incident was declined in all cases from the sixth month to the end of the year. As can be seen, the absorption of solar energy in pyramidal geometry (Case 2) is more than any other geometry in all seasons which has a great disparity with the rest of the geometries.
Figure 7. The monthly simulation of solar absorption for three different geometries in the hot & dry climate
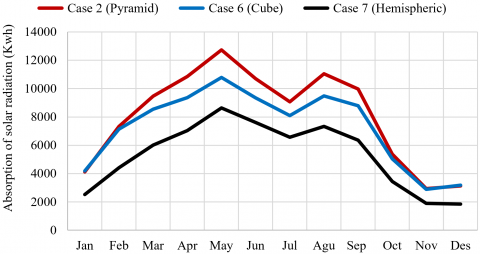
Figure 8. The monthly simulation of solar incident absorption for three different geometries in the cold & dry mountain
Figure 8 shows the monthly simulation of solar absorption for three different geometries in 12 months of the year in the cold - mountainous climate. As we can see, in hemispherical geometry, from the first month to the fifth month, the amount of absorption of solar incident has risen to over 8,800 kW/h, and has fallen from the fifth month to the seventh month of the year, and reached 6,600 kW/h, and rallied from the seventh to the eighth month of the following year, reaching 7,400 kW/h, then proceeding from the eighth month to the end of the year, continuing the downward trend, with the lowest solar incident in the eleventh month which was equal to 2,000 kW/h. in addition, for the pyramid geometry that had the highest absorption, the absorption rate of the solar incident from the first to fifth month was 10,000 to 13,000kW/h, which was the highest absorption of solar incident, and from the fifth month to the seventh it declined and reached approximately 8,500kW/h. From the seventh month to the eighth month, solar incident absorption has risen again, reaching approximately 9,000 approximately, and then preceded from the eighth month to the end of the year, with the lowest amount of solar incident absorption in the eleventh month led to 2,300-2,000 kW/h.
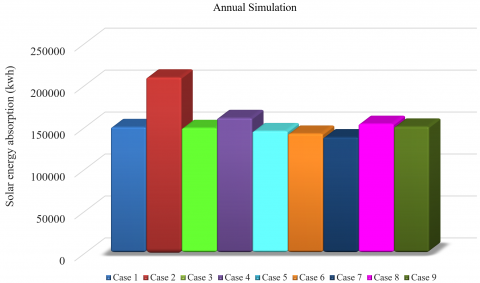
The above figures (Figures 7 and 8) show that all geometries have the highest absorption of radiant energy since March to September. According to the numerical simulations are carried out weekly in winter, summer and monthly periods for both climates, simulation of one year of sunlight in a hot and dry climate has been studied and the amount of radiation sunlight in the Figure 9 is shown in kwh separately for all forms. As you can see, pyramid geometry (Case 2) has the highest solar absorption in a hot and dry climate over a year. Also, hemispherical geometry (Case 7) has the least amount of absorption than the other geometric forms. It can be said that the absorption of solar energy in pyramidal geometry is approximately 1.5 times as much as hemispherical geometry.
Figure 9. The annual simulation of solar energy absorption in the hot & dry climate for different geometries
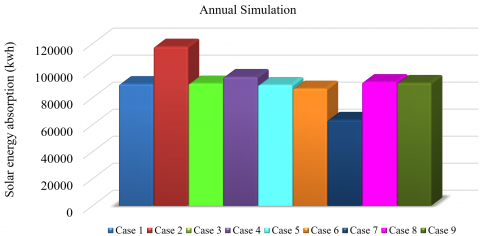
Figure 10. The annual simulation of solar energy absorption in the cold & mountain climate for different geometries
Figure 10 shows the simulation of one year of sunlight absorption in the cold and mountainous climate. As you can see, in this climate, hemispherical geometry (Case 7) and pyramidal geometry (Case 2) have the lowest and highest amount of solar incident absorption during the year, respectively. Maximum energy absorption was in pyramidal geometry, which is approximately 1.85 times higher than the minimum energy absorption in hemispherical geometry. It should be noted that the absorption rate in cold-mountainous climate is much lower and almost half of that in hot-dry climate.
The simulation data was compared for one week in summer, one week in winter, monthly and yearly for different geometries in separate charts and tables. Simulations were conducted for two hot-dry and cold-mountainous climates as well as geometries including hexagonal cube / pyramid / prism / incomplete prism / cube rectangle / cube / hemispheric / cylinder / cylinder-rectangular cube combination. The amount of solar incident (kW/h) depends only on the dimensions and color of the materials used, and for all geometries, the total area of the walls and ceiling was equal it was assumed to be 105. Other simulation conditions such as the type of materials used, the condition of ventilation, cooling, heating, etc. were also the same for all forms. The aim of this research is to obtain an appropriate geometry form for the exhibition in both hot-dry and cold-mountainous climates. According to the results of numerical simulations, the hemisphere geometry (Case 7) was the best choice for hot-dry climate, since in all of these simulations with the lowest solar incident (kW/h) for one year and hemisphere form had absorption rate equal to 66.1% of the pyramid form which had the highest rate of sunlight absorption. Also, the pyramidal shape, with the highest absorption of solar energy among all geometric forms, is the best option for cold-mountainous climate. Since the highest solar energy was absorbed by the Case 2 (pyramid), we consider the pyramid form as a reference and compare the rest of the geometries with the pyramid, so if we consider the solar energy in the pyramid to be 100%. Figure 11 and Table 4 show the percentage of energy absorption in the rest of the geometries relative to the pyramid. Assuming 100% of the maximum solar incident on a pyramidal geometric form for the amount of sunlight in the hot-dry climate, we obtained the percentage of radiation for the rest of the forms, with the smallest amount associated with the hemisphere which was 66.1% of the same value for the pyramid. Meanwhile, the hexagonal cube with 71.89% solar incident absorption has a moderate form in compare with other forms.
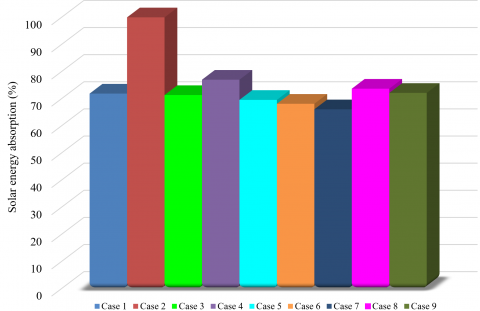
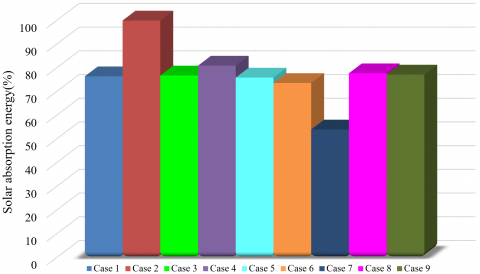
Figure 12 and Table 5 show simulation results during one year for all forms in cold and mountainous climate. Assuming 100% of the maximum solar incident on a pyramidal geometric form (due to the maximum absorption rate in compare with the rest of the geometries), the percentages of solar incident for the rest of the shapes were obtained. The lowest solar incident absorption (54%) was associated with the hemisphere and the highest solar incident absorption (100%) was associated with the pyramid. Moreover, the prism had the most average solar incident absorption (76.8%). As we can see, the solar incident absorption in both climates was roughly similar for different geometries. This means that pyramidal geometry and hemispherical geometry have the highest and lowest absorption rate, respectively.
According to the results obtained in this study, it can be concluded that among the 9 different geometries examined, the hemisphere form in a hot and dry climate, and the pyramidal form in the cold and mountainous climate, is the most optimal forms for the absorption of solar energy. The shape and geometry of the exterior surface of the building is very important to minimize heat loss. Finally, this optimization algorithm can be used to help us understand how well architects and planners can optimize their energy cost plans. Given that the lowest absorption of sunlight is considered in summer and the highest in winter, the outer surface of the geometry is very important. The more spherical the outer surface, the less light is absorbed. Also, when the outer surface is polygonal, the amount of light absorption is observed to increase. Therefore, a spherical surface is recommended for hot areas and a polygonal surface for cold areas.
Figure 11. The annual simulation based on percentage in the hot & dry climate
Figure 12. The annual simulation based on percentage in the cold & mountain climate
Table 4. The percentage of solar absorption in the different geometry in hot & dry climate
|
Case Num. |
Geometric form |
Solar absorption (%) |
|
Case 1 |
Hexagonal Cube |
71.89 |
|
Case 2 |
Pyramid |
100 |
|
Case 3 |
Prism |
71.35 |
|
Case 4 |
Incomplete Prism |
77.01 |
|
Case 5 |
Cube Rectangle |
69.57 |
|
Case 6 |
Cube |
68.14 |
|
Case 7 |
Hemispheric |
66.1 |
|
Case 8 |
Cylinder |
73.7 |
|
Case 9 |
Cylinder-Rectangular Cube Combination |
72.15 |
Table 5. The percentage of solar absorption in the different geometry in cold & mountain climate
|
Case Num. |
Geometric form |
Solar Incident (%) |
|
Case 1 |
Hexagonal Cube |
76.47 |
|
Case 2 |
Pyramid |
100 |
|
Case 3 |
Prism |
76.81 |
|
Case 4 |
Incomplete Prism |
80.97 |
|
Case 5 |
Cube Rectangle |
75.92 |
|
Case 6 |
Cube |
73.64 |
|
Case 7 |
Hemispheric |
54.03 |
|
Case 8 |
Cylinder |
77.75 |
|
Case 9 |
Cylinder-Rectangular Cube Combination |
77.21 |
In this research, the effect of the form and geometry of the temporary exhibition on the performance of solar energy absorption in both cold - mountainous and hot - dry climates was numerically investigated. Our aim was to obtain the best geometric form and shape for helping design decision according to the form of the building and considering its application in energy efficiency and absorption of radiant energy. The amount of solar energy absorbed in several geometries of the temporary exhibition with various forms such as hexagonal cube / pyramid / prism / incomplete prism / cube rectangle / cube / hemispheric / cylinder / cylinder-rectangular cube combination was numerically simulated. For all geometries, the total area of walls and ceilings was equal, and the boundary conditions of temperature and boundary conditions simulation were assumed to be the same. This study was conducted for two hot & dry and cold & mountainous climates. The results showed that hemisphere is the optimal hot and dry climate due to the lowest solar energy absorption. Also, due to the climatic and mountainous conditions and the higher energy absorption, pyramidal geometry had the highest solar energy absorption in the cold-mountainous climate. Therefore, for the exhibition, hemispherical and pyramidal forms are the best geometric shapes in hot & dry and cold & mountainous climates, respectively.
[1] Kirimtat, A., Koyunbaba, B.K., Chatzikonstantinou, I., Sariyildiz, S. (2016). Review of simulation modeling for shading devices in buildings. Renewable and Sustainable Energy Reviews, 53: 23-49. https://doi.org/10.1016/j.rser.2015.08.020
[2] Pérez-Lombard, L., Ortiz, J., Pout, C. (2008). A review on buildings energy consumption information. Energy and Buildings, 40(3): 394-398. https://doi.org/10.1016/j.enbuild.2007.03.007
[3] Chel, A., Kaushik, G. (2018). Renewable energy technologies for sustainable development of energy efficient building. Alexandria Engineering Journal, 57(2): 655-669. https://doi.org/10.1016/j.aej.2017.02.027
[4] Loveday, D.L., Parsons, K.C., Taki, A.H., Hodder, S.G. (2002). Displacement ventilation environments with chilled ceilings: Thermal comfort design within the context of the BS EN ISO7730 versus adaptive debate. Energy and Buildings, 34(6): 573-579. https://doi.org/10.1016/S0378-7788(02)00007-5
[5] Yannas, S. (1994). Solar Energy and Housing Design: Principles, Objectives, Guidelines (Vol. 1). AA Publishing.
[6] Pain, S. (2016). The rise of the urbanite. Nature, 531(7594): S50-S51. https://doi.org/10.1038/531S50a
[7] Santamouris, M. (2016). Innovating to zero the building sector in Europe: Minimising the energy consumption, eradication of the energy poverty and mitigating the local climate change. Solar Energy, 128: 61-94. https://doi.org/10.1016/j.solener.2016.01.021
[8] Negro, E., Cardinale, N., Rospi, G. (2017). Design of small cogeneration system for public buildings in the town of Matera. International Journal of Heat and Technology, 35(1): S228-S235. https://doi.org/10.18280/ijht.35Sp0132
[9] Gautam, B.R., Li, F., Ru, G. (2015). Assessment of urban roof top solar photovoltaic potential to solve power shortage problem in Nepal. Energy and Buildings, 86, 735-744. https://doi.org/10.1016/j.enbuild.2014.10.038
[10] Sandrolini, F., Franzoni, E. (2010). Embodied energy of building materials: A new parameter for sustainable architectural design. Heat Tech, 27(1): 163-167.
[11] Akbari, H., Kolokotsa, D. (2016). Three decades of urban heat islands and mitigation technologies research. Energy and Buildings, 133: 834-842. https://doi.org/10.1016/j.enbuild.2016.09.067
[12] Abdelwahab, Z. (2012). Renewable energy, sustainable development and environmental protection in Ksours (case of Algeria). Energy Procedia, 18: 666-671. https://doi.org/10.1016/j.egypro.2012.05.081
[13] Gagliano, A., Nocera, F., Detommaso, M., Evola, G. (2016). Thermal behavior of an extensive green roof: Numerical simulations and experimental investigations. International Journal of Heat and Technology, 34(2): 226-234. https://doi.org/10.18280/ijht.34S206
[14] Zhai, X.Q., Wang, R.Z., Dai, Y.J., Wu, J.Y., Xu, Y.X., Ma, Q. (2007). Solar integrated energy system for a green building. Energy and Buildings, 39(8): 985-993. https://doi.org/10.1016/j.enbuild.2006.11.010
[15] Lukač, N., Žlaus, D., Seme, S., Žalik, B., Štumberger, G. (2013). Rating of roofs’ surfaces regarding their solar potential and suitability for PV systems, based on LiDAR data. Applied Energy, 102: 803-812. https://doi.org/10.1016/j.apenergy.2012.08.042
[16] García-Cascales, M.S., Lamata, M.T., Sánchez-Lozano, J.M. (2012). Evaluation of photovoltaic cells in a multi-criteria decision making process. Annals of Operations Research, 199(1): 373-391. https://doi.org/10.1007/s10479-011-1009-x
[17] Zuo, J., Zhao, Z.Y. (2014). Green building research–current status and future agenda: A review. Renewable and Sustainable Energy Reviews, 30: 271-281. https://doi.org/10.1016/j.rser.2013.10.021
[18] Chow, T.T. (2010). A review on photovoltaic/thermal hybrid solar technology. Applied Energy, 87(2): 365-379. https://doi.org/10.1016/j.apenergy.2009.06.037
[19] Ourghi, R., Al-Anzi, A., Krarti, M. (2007). A simplified analysis method to predict the impact of shape on annual energy use for office buildings. Energy Conversion and Management, 48(1): 300-305. https://doi.org/10.1016/j.enconman.2006.04.011
[20] Mingfang, T. (2002). Solar control for buildings. Building and Environment, 37(7): 659-664. https://doi.org/10.1016/S0360-1323(01)00063-4
[21] Pacheco, R., Ordóñez, J., Martínez, G. (2012). Energy efficient design of building: A review. Renewable and Sustainable Energy Reviews, 16(6): 3559-3573. https://doi.org/10.1016/j.rser.2012.03.045
[22] Wang, W., Rivard, H., Zmeureanu, R. (2006). Floor shape optimization for green building design. Advanced Engineering Informatics, 20(4): 363-378. https://doi.org/10.1016/j.aei.2006.07.001
[23] Cao, J., Metzmacher, H., O'Donnell, J., Frisch, J., Bazjanac, V., Kobbelt, L., van Treeck, C. (2017). Facade geometry generation from low-resolution aerial photographs for building energy modeling. Building and Environment, 123: 601-624. https://doi.org/10.1016/j.buildenv.2017.07.018
[24] Ascione, F., De Masi, R.F., de Rossi, F., Ruggiero, S., Vanoli, G.P. (2016). Optimization of building envelope design for nZEBs in Mediterranean climate: Performance analysis of residential case study. Applied Energy, 183: 938-957. https://doi.org/10.1016/j.apenergy.2016.09.027
[25] Marino, C., Minichiello, F., Bahnfleth, W. (2015). The influence of surface finishes on the energy demand of HVAC systems for existing buildings. Energy and Buildings, 95: 70-79. https://doi.org/10.1016/j.enbuild.2015.02.036
[26] Fan, Y., Li, Y., Hang, J., Wang, K., Yang, X. (2016). Natural convection flows along a 16-storey high-rise building. Building and Environment, 107: 215-225. https://doi.org/10.1016/j.buildenv.2016.08.003
[27] Pisello, A.L., Castaldo, V.L., Fabiani, C., Cotana, F. (2016). Investigation on the effect of innovative cool tiles on local indoor thermal conditions: Finite element modeling and continuous monitoring. Building and Environment, 97: 55-68. https://doi.org/10.1016/j.buildenv.2015.11.038
[28] Si, P.F., Lv, Y.X., Liu, X.C., Rong, X.Y., Feng, Y. (2016). An optimization model applied to active solar energy system for buildings in cold plateau area. Energy Procedia, 88: 443-449. https://doi.org/10.1016/j.egypro.2016.06.022
[29] Pisello, A.L., Piselli, C., Cotana, F. (2015). Influence of human behavior on cool roof effect for summer cooling. Building and Environment, 88: 116-128. https://doi.org/10.1016/j.buildenv.2014.09.025
[30] Kazmi, H., D’Oca, S., Delmastro, C., Lodeweyckx, S., Corgnati, S.P. (2016). Generalizable occupant-driven optimization model for domestic hot water production in NZEB. Applied Energy, 175: 1-15. https://doi.org/10.1016/j.apenergy.2016.04.108
[31] Rashdi, W.S.S.W., Embi, M.R. (2016). Analysing optimum building form in relation to lower cooling load. Procedia-Social and Behavioral Sciences, 222: 782-790. https://doi.org/10.1016/j.sbspro.2016.05.161
[32] Collins, J.B. (1984). The development of daylighting - A British view. Lighting Research & Technology, 16(4): 155-170. https://doi.org/10.1177%2F14771535840160040501
[33] Moosavi, R., Gheybi, F. (2018). Office buildings glass facades excitation under hot and dry climates: A numerical and experimental study. Iranian Journal of Energy, 20(4): 5-25.
[34] Lai, C.M., Hokoi, S. (2015). Solar façades: A review. Building and Environment, 91: 152-165. https://doi.org/10.1016/j.buildenv.2015.01.007
[35] Fang, X., Li, D. (2013). Solar photovoltaic and thermal technology and applications in China. Renewable and Sustainable Energy Reviews, 23: 330-340. https://doi.org/10.1016/j.rser.2013.03.010
[36] Li, Y., Ding, D., Liu, C.L., Wang, C.J. (2016). A pixel-based approach to estimation of solar energy potential on building roofs. Energy and Buildings, 129: 563-573. https://doi.org/10.1016/j.enbuild.2016.08.025
[37] Piselli, C., Saffari, M., de Gracia, A., Pisello, A.L., Cotana, F., Cabeza, L.F. (2017). Optimization of roof solar reflectance under different climate conditions, occupancy, building configuration and energy systems. Energy and Buildings, 151: 81-97. https://doi.org/10.1016/j.enbuild.2017.06.045
[38] Aksamija, A. (2015). Regenerative design of existing buildings for net-zero energy use. Procedia Engineering, 118: 72-80. https://doi.org/10.1016/j.proeng.2015.08.405
[39] Zhang, H., Lei, S.L. (2012). An assessment framework for the renovation of existing residential buildings regarding environmental efficiency. Procedia-Social and Behavioral Sciences, 68: 549-563. https://doi.org/10.1016/j.sbspro.2012.12.248
[40] Markus, T.A., Clarke, J.A., Morris, E.N., Collins, T.G. (1984). The influence of climate on housing: A simple technique for the assessment of dynamic energy behaviour. Energy and Buildings, 7(3): 243-259. https://doi.org/10.1016/0378-7788(84)90029-X
[41] Chi, D.A., Moreno, D., Navarro, J. (2017). Design optimisation of perforated solar façades in order to balance daylighting with thermal performance. Building and Environment, 125: 383-400. https://doi.org/10.1016/j.buildenv.2017.09.007
[42] Perez, R., Ineichen, P., Seals, R., Michalsky, J., Stewart, R. (1990). Modeling daylight availability and irradiance components from direct and global irradiance. Solar Energy, 44(5): 271-289. https://doi.org/10.1016/0038-092X(90)90055-H