Mirmanto* | I Wayan Joniarta | Agung Tri Wijayanta | Pranowo | Muhammad Habiburrahman
© 2019 IIETA. This article is published by IIETA and is licensed under the CC BY 4.0 license (http://creativecommons.org/licenses/by/4.0/).
OPEN ACCESS
An experimental investigation on the thermoelectric cooler box with several heat dissipation units was conducted in the unconditioned environment. The cooler box cooling system in this study comprised a TEC2-25408 thermoelectric module, an inner heat sink, four bottles filled with water, and heat dissipation units. The heat dissipation unites employed were a heat sink with a fan, a heat sink without a fan, a heat pipe with a fan, and a heat pipe without a fan. The cooler box dimension was 0.397 m x 0.305 m x 0.25 m. The powers supplied to the thermoelectric ranged from 27.65 W to 36.51 W. The experiment was performed for 1800 seconds, and the data were recorded using the NI DAQ MX 9714 connected to the PC. The ambient temperatures were detected from 26.6°C to 30.82°C. The results showed that the cooler box using a heat sink with a fan demonstrated the lowest cooler box temperature (23°C), and the highest COP (0.044), while the cooler box utilizing three other dissipation units exhibited opposite.
cooler box, COP, heat dissipation unit, thermoelectric
One of the cooling systems that do not use freon is a thermoelectric cooling system (TCS). This system uses thermoelectric modules (TEM) as the core of the cooling engine. It is also recognized as an environmentally friendly cooling system. It works by converting electrical power to thermal power. One side of the TEM becomes hot and the other side of the TEM becomes cold when DC current flows to the TEM. The TCS works following a thermodynamic principle, i.e. Peltier effect as explained in Tritt [1]. The advantages of TCS are no leakage problem, compact, environmentally friendly, low power requirement, durable and easy maintenance. However, TCS also has weaknesses such as low COP and small capacity as reported in Mirmanto et al. [2].
Many studies regarding TCS have been performed so far. Ramdan [3], and Mirmanto et al. [2] ever researched on the cooler box using TEM with cooling load variations. They employed cooling loads calculated from water. The volume of the water placed inside the cooler box was ranging from 600 to 4500 ml. When their cooler box was operated without water, it produced a temperature of 14.07°C, but when it was with a water volume of 600 ml, it resulted in a temperature of 16.08°C. Increasing the water volume raised the cooler box temperatures. At the water volumes of 1500 ml, 3000 ml and 4500 ml, the cooler box temperatures obtained were 17.07°C, 18.47°C, and 20.83°C respectively. They found that their experimental COP increased with an increase in the water volumes. However, they did not examine the heat dissipation unit of their cooler box. They used a heat sink with a fan.
Putra [4] examined a thermoelectric cooler box using a water heat exchanger to cool the hot side of the TEM. Their study was to assess the influence of water mass flow rates on the COP of cooler box. The mass flow rates used were 5 g/s, 10 g/s, and 15 g/s, and also they used the power of 41.87 W. He found that the cooler box temperature decreased with the time, but the COP increased with the time. Nevertheless, the effect of the mass flow rate was not clear on the COP, and he did not investigate the effect of the dissipation unit.
Anggani [5] performed experimental studies on thermoelectric cooler boxes. The heat dissipation unites employed were a single fan heat pipe and a single fan heat sink. The lowest temperature attained using the single fan heat pipe was 19.09°C without water inside the cooler box, while with water of 350 ml, the temperature achieved was 20.36°C. Meanwhile, the lowest temperature obtained using the single fan heat sink and without water was 19.5°C. With the water of 350 ml, the lowest temperature attained was 20.8°C. Nevertheless, Anggani [5] had not investigated the fanless heat sink and fanless heat pipe. Mirmanto et al. [6] investigated the thermoelectric cooler box using a single fan heat sink and double fan heat pipe as the heat dissipation units. They found that the double fan heat pipe showed better performances, but when the double fan power was considered, the single fan heat sink was superior.
The COP of TCS is a challenge for researchers to date. The COP obtained is very small and even less than 1. The summary of the COP acquisition can be seen in Table 1. Table 1 shows some of the efforts of the researchers to raise the COP. One of the causes of this low COP is the low performance of the heat dissipation unit. The heat dissipation unit determines the performance of the cooler as reported by Zhao and Tan [7].
If the heat dissipation unit is not good, the cooler box cannot be cold. Therefore, this study aims to examine and distinguish the performance of four different heat dissipation units, i.e. heat sink without a fan (HS), heat sink with a fan (HSF), heat pipe without a fan (HP), and heat pipe with a fan (HPF). From this study, the best dissipation unit can be obtained. This study then contributes to the thermoelectric cooler box design knowledge.
Table 1. COP obtained from published papers related to the heat dissipation unit
|
Authors |
Heat dissipation unit |
COP |
|
Mirmanto et al. [6] |
Heat sink fin fan and double fan heat pipe |
0-0.02 |
|
Zhao and Tan [7] |
Water heat exchanger |
0.6-1.2 |
|
Abdul-Wahab et al. [8] |
Heat sinks with fans |
0.16 |
|
Hafis et al. [9] |
Aluminum and copper heat sinks |
The COP depended on the voltage input, but the COP was lower for an aluminum heat dissipation unit. |
|
Sujith et al. [10] |
Aluminum tank filled with water |
0.124 |
|
Kaushik et al. [11] |
Not mentioned |
Not available |
|
Ahamat et al. [12] |
Heat sink with water flow. |
0.5-3.2 |
|
Pokale et al. [13] |
Heat sink with a fan |
0.03-0.19 |
|
Maral et al. [14] |
An aluminum water block |
0.26-1.2 |
|
Aziz et al. [15] |
Heat sink with a fan |
Not available |
|
Vian and Astrain [16] |
Two-phase and natural convection thermosyphon (TSV) |
0.23-0.57 |
|
Mirmanto et al. [17] |
Heat sink with a fan |
7.2 to 9.6 (Carnot COP), 0-0.027 (experimental COP) |
2.1 Research facility
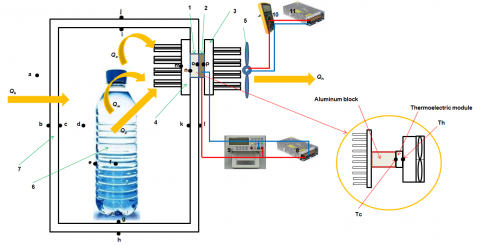
The schematic diagram used in this study is given in Figure 1. That was the facility employed for conducting experiments. It contains a cooler box, a thermoelectric module, four heat dissipation units; HS, HSF, HP, and HPF. The actual ambient temperatures ranged from 26.15°C to 30.62°C. The cooling load for this cooling system was heat coming from the air, water, four bottles and from conduction heat that flowed from the ambient through the cooler box walls. The water volume in each bottle was approximately 1500 ml. The outer dimension of the cooler box was 497 mm x 405 mm x 350 mm and the box was made of styrofoam with a thickness of 50 mm.
Figure 1. Schematic diagram of the research apparatus. a-p are thermocouple positions, 1. aluminum block, 2. thermoelectric, 3. outer heat dissipation unit, 4. inner heat sink, 5. fan, 6. plastic bottle filled with water, 7. cooler box wall, 8. thermoelectric power supply, 9. multitester, 10. digital multitester, 11. fan power supply
K-type thermocouples were used to measure the temperatures. The thermocouples were calibrated against the RTD 100 probe immersed in an oil bath. The oil bath was made of a box equipped with a 1500 W of the heater and a temperature controller. The temperature controller was functioned to maintain the oil temperature constantly. The calibration resulted in an uncertainty of ± 0.5°C. The oil bath was made from a pan with a heater of 1500 W and a PID controller. The power supplied to the TEM was measured using a multitester "Professional Vichy Vc8145 Dmm Digital Bench Top" with an accuracy of ± (0.05%+5) DCV and ± (0.1%+5) DCA. Meanwhile, the power flowed to the fan was measured using a multitester "sigma 33A TRMS" with an accuracy of ± 0.5%+4 VDC and ± 1%+10 DCA. The fan and the TEM powers used were given in Table 2, while the TEM employed was TEC2- 25408. The TEM specifications are presented in Table 3. The cooler box dimension was measured using a ruler with a resolution of 1 mm. The heat dissipation unit was attached on the wall of the cooler box as shown in Figure 1 and as suggested by Mirmanto et al. [17], and the heat dissipation units are presented in Figure 2.
Table 2. The power used and the experimental conditions
|
Parameter |
Range of measurement |
Uncertainties |
|
Temperature of cold side of the TEM (Tc) |
5.61-38.05°C |
± 0.5°C |
|
Temperature of hot side of the TEM (Th) |
26.92-116.24°C |
± 0.5°C |
|
Ambient temperature (Tam) |
26.6-30.82°C |
± 0.5°C |
|
Power for case HSF (Pin) |
36.51 W |
± 0.04 W |
|
Power for case HS (Pin) |
27.65 W |
± 0.03 W |
|
Power for case HPF (Pin) |
33.47 W |
± 0.04 W |
|
Power for case HP (Pin) |
29.88 W |
± 0.03 W |
|
The volume of the cooler box (Ѵ) |
0.397 m x 0.305 m x 0.250 m or 0.0303 m³ |
± 1.74 x 10⁻⁴ m³ |
|
Water mass (mw) |
6 kg |
± 0.001 kg |
|
Plastic bottle mass (mp) |
0.116 kg |
± 0.001 kg |
|
Air mass (ma) |
0.0285-0.0291 kg |
± 2.1 x 10⁻⁴ kg |
Figure 2. Heat dissipation units: (a) HS, (b) HSF, (c) HP, (d) HPF
Table 3. TEM specification
|
Model |
TEC2-25408 |
|
Voltage |
15.54V |
|
Vmax (V) |
15.4V |
|
Imax (A) |
8 A |
|
Qmax (W) |
65 W |
Powers used in this study, the range of measurements and the uncertainties can be seen in Table 2, while the specification of the TEM is presented in Table 3. The propagation uncertainties are estimated following the theory of Cooleman and Steele [18].
2.2 Data processing
Energy from the air, water and plastic bottle inside the cooler box can be estimated as:
${{E}_{a\left( i \right)}}={{m}_{a\left( i \right)}}{{c}_{pa}}\Delta {{T}_{a(i)}}$ (1)
${{E}_{w\left( i \right)}}={{m}_{w\left( i \right)}}{{c}_{pw}}\Delta {{T}_{w(i)}}$ (2)
${{E}_{p\left( i \right)}}={{m}_{p\left( i \right)}}{{c}_{pp}}\Delta {{T}_{p(i)}}$ (3)
The equations are taken from Incropera et al. [19], but they have been modified as necessary. ΔT(i) is the difference of the initial temperature and the final temperature at a range of time, or ΔT(i) = T(i)-T(i-1). E is the energy (J), m is the mass (kg), cp is the specific heat (J/kg°C), ∆T is the temperature difference (°C). cp is calculated using fluid a property table at the atmospheric pressure at bulk temperatures, Tb= (T(i)-T(i-1))/2. The bulk temperature equation can be obtained in [19]. Another heat load is conduction energy. The conduction energy flows from the environment through the cooler box walls can be estimated using Eq. (4). Eq. (4) is also available in previous work [19]. However, the equation should be modified as follows.
${{E}_{k\left( i \right)}}=-kA\frac{\left( {{T}_{do(i)}}-{{T}_{di(i)}} \right)}{x}\left( {{t}_{\left( i \right)}}-{{t}_{\left( i-1 \right)}} \right)$ (4)
Ek is the conduction energy (J), k is the thermal conductivity (W/m2°C), A is the heat transfer area (m2), and x is the thickness of the cooler box walls (m). To convert the energy into heat rate, Eqns. (1-4) are divided by the time (t), and it can be expressed as:
${{Q}_{a}}=\frac{\Sigma _{i}^{n}{{E}_{a(i)}}}{t}$ (5)
${{Q}_{w}}=\frac{\Sigma _{i}^{n}{{E}_{w(i)}}}{t}$ (6)
${{Q}_{p}}=\frac{\Sigma _{i}^{n}{{E}_{p(i)}}}{t}$ (7)
${{Q}_{k}}=\frac{\Sigma _{i}^{n}{{E}_{k(i)}}}{t}$ (8)
Q is the heat transfer rate (W), and t states as the total time (s). Eqns. (5-8) can be attained from the previous researchers, e.g. Mirmanto et al. [6], Mirmanto et al. [17], Ananta et al. [20].
The electrical power given to the TEM and fans can be computed using a general equation that can be found in Abdul-Wahab et al. [8], Mirmanto et al. [17], Jugsujinda et al. [21]. The equation is written as:
$P=VI$ (9)
P is the electrical power (W), V is the voltage (V), and I is the current (A). P for the TEM is noted by PTEC, while P for the fan is written as Pfan, see Eq. (11). Then the performance of the cooler box can be expressed in the term of COP. COP is the comparison of the cooling load to the total electrical power supplied to the system. The COP equation is also a general equation that can be attained in Cengel [22], Abdul-Wahab et al. [8], Mirmanto et al. [6, 17], Jugsujinda et al. [21].
$COP=\frac{{{Q}_{c}}}{{{P}_{in}}}$ (10)
${{P}_{in}}={{P}_{TEC}}+{{P}_{fan}}$ (11)
${{Q}_{c}}={{Q}_{a}}+{{Q}_{w}}+{{Q}_{p}}+{{Q}_{k}}$ (12)
Qc is the total cooling load or total heat transfer rate that is removed from the cooler box (W).
The heat transfer rate, which can be absorbed by the TE, shows the different trends and values for different heat dissipation units. A similar study had been performed by Mirmanto et al. [6], however, they only used two heat dissipation units, i.e. a heat sink with a fan and a double fan heat pipe. The total energy of case HS indicates the smallest value, and even it has negative values. This phenomenon means that the temperature of the cooler box is higher than the ambient temperature. The higher temperature is due to the energy coming from the hot side of the TEM. The temperature of the hot side of the TEM is very high because the dissipation unit cannot remove much energy. A part of energy on the hot side of the TEM then flows through the body of the TEM itself, the aluminum block, and the inner heat sink toward the cooler box room, see Figure 3. When the heat on the TEM hot side cannot be transferred to the environment, the hot side temperature of the TEM is very high (measured using a thermocouple at position p in Figure 1). This high temperature is forwarded by aluminum block (part no. 1 in Figure 1), which connects the cold side of the TE (position n) to the inner heat sink (part no. 4 in Figure 1). The cold side of the TE is then no longer cold because the heat flows from the hot side of the TE (position p) through the TE itself (part no. 2). Therefore, the high temperature on the hot side of the TE elevates the temperatures of the aluminum block, the inner heat sink, and the cooler box temperature. Hence, for the case HS, the cooler box room becomes hot. Consequently, the Qc components, e.g. Qa, Qw, and Qp are negative due to equations (1-3). Those three equations result in negative values when the ΔT(i) is negative. Therefore, Qc and COP are also negative. Temperatures obtained from the case HS are presented in Figure 4. The TE cold side temperature (Tc) is higher than the ambient temperature (Tam). In Figure 1, Tc is the TE cold side temperature noted by position o, Ta is the cooler box room temperature or air temperature inside the cooler box indicated by position d, Tam is the ambient temperature noted by position a, Tw represents the water temperature labeled by position f, Tp indicates the plastic bottle temperature renowned by position e, and Tihs is the inner heat sink temperature eminent by position m.
Figure 3. Energy flows from the hot side of the TEM to cooler box room for case HS due to the insefficient heat dissipation unit
3.1 Temperature data
In Figure 4, Ta increases with time. This phenomenon has not been reported in the published reports/ papers. The previous researchers always reported that the cooler box temperature decreased with time, e.g. Mirmanto et al. [6, 17], Jugsujinda et al. [21]. The cause of the increasing Ta is the undissipated heat from the hot side of the TEM. Ta increases so that automatically Tw and Tp also increase with time.
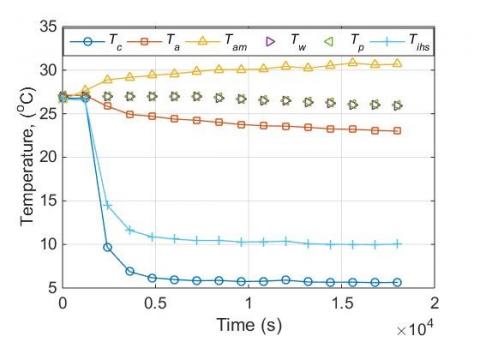
Figure 5 shows the temperatures recorded for the case HSF. For case HS, Tc goes down at the time just after the machine is on, but then it rises with the time and it is higher than the ambient temperature, while for case HSF, Tc goes down sharply at just after the cooler box is run and then it gets constant and it reaches a minimum temperature of about 5.65°C. Ta decreases with the time as seen in Figure 5. This case agrees with the previous results, e.g. Jugsujinda et al. [21], Vian dan Astrain [16], Gökçek and Sahin [23], Mirmanto et al. [6, 17].
Figure 4. Temperature measurements for case HS
Figure 5. Temperature measurements for case HSF
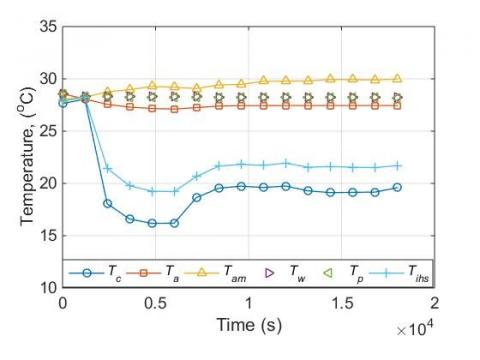
Figure 6. Temperatures for case HP
Figure 7. Temperatures for case HPF
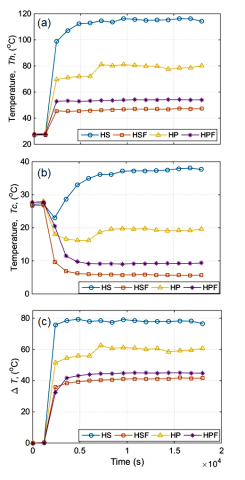
Figure 8. Th, Tc and ΔT for several cases; (a) Th, (b) Tc, and (c) ΔT = Th - Tc
For case HP, the recording temperature is shown in Figure 6. The ambient temperature rises with time. This is because the experiment starts in the morning and finishes in the afternoon, so the ambient temperature rises steadily. In the initial seconds, Tc drops dramatically as in case HS and case HSF, but after 600 seconds Tc rises and then flattens out. The increase in Tc is a sign of equilibrium, and after the equilibrium is achieved, Tc becomes constant. Nevertheless, the heat discharged from the hot side of the TEM is not much, then Tc for case HP is still higher than Tc of the case HSF. This indicates that without a fan in the case HP, the heat dissipation unit is less capable of transferring heat. In the cases HS and HP, the trend Tc is almost the same, Tc drops dramatically to a minimum value and then Tc rises and finally, the Tc is flat.
For the case HPF, the temperature recording results are shown in Figure 7. Tc also dropped dramatically in the initial seconds, then Tc is constant after 600 seconds. The lowest value for Tc is around 9.2°C. So Tc is lower than Tc of cases HS and HP, but higher than Tc of case HSF. With the additional fan, the heat taken from the hot side of the TE is larger for case HPF than for case HP, so the Tc is lower. Ta decreases with time in the initial seconds, and then Ta becomes constant after thermal equilibrium occurs. This trend was also studied by Jugsujinda et al. [21], and Gökçek and Sahin [23].
In Figure 4 to Figure 6, Th of each case has not been shown, then Figure 8 presents the intended Th, Tc, and ΔT, so that the performance differences of HS, HSF, HP, and HPF can be known. In Figure 8, the highest Th is the Th for the case HS, while the lowest Th is the Th for case HSF. This shows that the fanless heat sink in the case HS has a very low ability to transfer heat from the hot side of the TE to the environment. Nevertheless, once a fan is installed to the heat sink, the heat discharged from the hot side of the TE is very large, so that Th for the case HSF is lower than Thfor the other cases. Similarly, this phenomenon also occurs in cases HP and HPF. The Th for case HP is higher compared to Th for case HPF.
Temperature difference, ΔT, can be estimated using Eq. (13) which can be obtained at Cengel [22], Juksujinda [21], Gökçek and Sahin [23], Mirmanto et al. [6, 17]. The high ΔT shows that the cooler box performance is not good because the heat discharged from the hot side of TE is very small. With a high ΔT, the temperature of the cooler box room is also high, so that the cooling goal cannot be achieved. To find out more about whether HSF is the best heat dissipation unit.
Figure 9. Instantaneous Qc for all cases
3.2 Cooling load
Figure 9 displays Qc values various cases. Qc is a variable showing the ability of the cooler box to throw away heat from the cooler box room. Qc is usually called a cooling load. Qc is predicted using Eq. (12).
The instantaneous Qc in Figure 9 is very scattered. Nevertheless, the Qcof the case HS locates under the x-axis meaning that the Qc is negative. The negative sign here means that the cooler box temperature increases from time to time. Qc inside the cooler box is not absorbed but comes from the hot side of TE. Average Qc for the case HS, HSF, HP, and HPF are of approximately -1.437 W, 1.56 W, 0.452 W, and 1.256 W respectively. From the viewpoint of Qc, the best heat dissipation unit is HSF, while the worst is HS.
3.3 Coefficient of performance
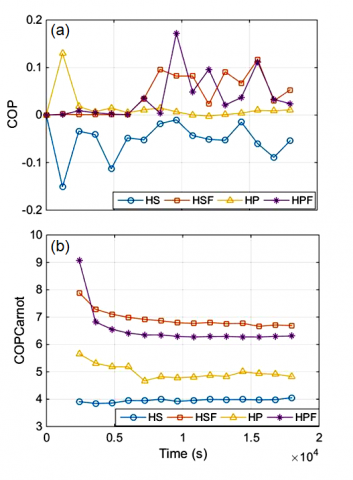
There is one variable to state that the HSF is the best one, i.e. COP. The COP is computed using Eq. (10). The experimental temporal COP is exhibited in Figure 10.
Figure 10. Experimental instantaneous COP and COP Carnot; (a) experimental COP, (b) COP Carnot
The Carnot COP can be obtained using equation (13) that is taken from Jugsujinda et al. [21], or Gökçek and Sahin [23]. The experimental COP is rather scattier, while the Carnot COP decreases with the time unless for the case HS. The trends of the Carnot COP were also found by the previous researchers, e.g. Jugsujinda et al. [21], and Gökçek and Sahin [23]. From the COP parameter, especially, Carnot COP, it can be seen that the case HSF is the best. This agrees with what found by Mirmanto et al. [6]. When they considered the fan power to be included in calculating the COP, the heat sink with a fan was better than the double fan heat pipe. Hence, the HSF is recommended as a heat dissipation unit for TCS.
The tests for examining four cases of heat dissipation units; i.e. HS, HSF, HP, and HPF were done at unconditioned environmental temperatures. The cooling loads were computed from heat contained in the air, water and bottles placed inside the cooler box and from conduction heat flowing through the cooler box walls. The total volume of the water was 6000 ml. The cooler box was run for about 18000 seconds. Some findings were obtained. For case HS, the cooler box temperature increases with time. Qc and COP are negative. The best heat dissipation unit is the HSF. The HSF is recommended for designing a better thermoelectric cooler box.
The author would like to thank DRPM of the Indonesian technology research and higher education minister for research funding through the PDUPT scheme with the contract number: 182/SP2H/LT/DRPM/2019.
A heat transfer area, m²
COP coefficient of performance
cp heat capacity, J.kg-1.°C-1
E energy, J
i segment
I current, A
k thermal conductivity, W.m-1.°C-1
P power, W
Q heat, W
t time, s
T temperature, ºC
V voltage, V
x cooler box wall thickness, m
ΔT temperature difference, °C
Subscript
a air
c cold side
di inner wall
do outer wall
h hot side
in input
k conduction
p plastic
TEC thermoelectric cooler
w water
[1] Tritt, T.M. (2002). Thermoelectric Materials: Principles, Structure, Properties, and Applications, Encyclopedia of Materials: Science and Technology. Elsevier Science Ltd., Kidlington, Oxford, UK.
[2] Mirmanto, M., Joniarta, I.W., Sayoga, I.M.A., Nurpatria, N., Padang, Y.A., Yudhyadi, I.G.N.K. (2018). Effect of water volume on a thermoelectric cooler box performance. Frontiers in Heat and Mass Transfer (FHMT), 11: 1-9. https://doi.org/10.5098/hmt.11.17
[3] Ramdan, G. (2016). Sistem pendingin pada kulkas termoelektrik dengan variasi pembebanan. Skripsi, Fakultas Teknik Universitas Mataram.
[4] Putra, D.K. (2018). Unjuk kerja kotak pendingin termoelektrik dengan variasi laju aliran massa air pendingin. Skripsi, Jurusan Teknik Mesin, Universitas Mataram, Mataram, Indonesia.
[5] Anggani, Y. (2018). Perbandingan performa kotak pendingin termoelektrik dengan menggunakan heat pipe dan heat sink dengan kipas sebagai unit pembuang. Skripsi, Fakultas Teknik, Universitas Mataram.
[6] Mirmanto, Alit, I.B., Sayoga. I.M.A., Sutanto, R., Nurchayati, Mulyanto, A. (2018). Experimental cooler box performance using two different heat dissipation units: A heat sink fin-fan, and a double fan heat pipe. Frontiers in Heat and Mass Transfer, 10: 1-7. http://doi.org/10.5098/hmt.10.34
[7] Zhao, D., Tan, G. (2014). A review of thermoelectric cooling: materials, modeling, and applications. Applied Thermal Engineering, 66(1-2): 15-24. https://doi.org/10.1016/j.applthermaleng.2014.01.074
[8] Abdul-Wahab, S.A., Elkamel, A., Al-Damkhi, A.M., Al-Habsi, I.A., Al-Rubai’ey’, H.S., Al-Battashi, A.K., Al-Tamimi, A.R., Al-Mamari, K.H., Chutani, M.U. (2009). Design and experimental investigation of a portable solar thermoelectric refrigerator. Renewable Energy, 34(1): 30-34. https://doi.org/10.1016/j.renene.2008.04.026
[9] Hafis, S.M., Ridzuan, M.J.M., Firdaus, A.Z.A., Shahril, S.M., Farahana, R.N., Chong, C.A. (2014). COP improvement of thermoelectric cooler through the optimization of the heat dissipation system. Applied Mechanics and Materials, 554: 241-245. https://doi.org/10.4028/www.scientific.net/AMM.554.241
[10] Sujith, G., Varghese, A., Achankunju. A., Mathew, R., George, R., Vishnu, V. (2016). Design and fabrication of thermoelectric refrigerator with thermosiphon system. International Journal of Scientific Engineering and Applied Science (IJSEAS), 2: 373-379.
[11] Kaushik, S.C., Hans, R., Manikandan, S. (2016). Theoretical and experimental investigations on solar photovoltaic driven thermoelectric cooler system for cold storage application. International Journal of Environmental Science and Development, 7(8): 615-620. https://doi.org/10.18178/ijesd.2016.7.8.850
[12] Ahamat, M.A., Abidin, R., Abdullah, S.M. (2016). Performance of thermoelectric module as a water cooler and water heater. Int. J. on Advanced Science Engineering Information Technology, 6(4): 524-528. https://doi.org/10.18517/ijaseit.6.4.900
[13] Pokale, D.S.V., Walgude, N.P.A., Patunkar, P.P. (2016). Design and fabrication of thermoelectric refrigerator for liquid cooling by automatic temperature micro-controller. Int. J. Science Technology & Engineering, 3: 21-27.
[14] Maral, Y., Aktas, M., Erol O, Ongun R, Polat F. (2017). An examination about thermal capacities of thermoelectric coolers in battery cooling systems. J. Engineering Research and Applied Science, 6(2): 703-710.
[15] Aziz, A., Mainil, R.I., Mainil, A.K., Syafri, Syukrillah, M.F. (2017). Design of portable beverage cooler using one-stage thermoelectric cooler (TEC) module. Aceh International Journal of Science and Technology, 6(1): 29-36. https://doi.org/10.13170/aijst.6.1.5427
[16] Vián, J.G., Astrain, D. (2009). Development of a thermoelectric refrigerator with two-phase thermosyphons and capillary lift. Applied Thermal Engineering, 29(10): 1935-1940. https://doi.org/10.1016/j.applthermaleng.2008.09.018
[17] Mirmanto, M., Syahrul, S., Wirdan, Y. (2019). Experimental performances of a thermoelectric cooler box with thermoelectric position variations. Engineering Science and Technology, an International Journal, 22(1): 177-184. https://doi.org/10.1016/j.jestch.2018.09.006
[18] Coleman, H.W., Steele, W.G. (2009). Experimentation, Validation, and Uncertainty Analysis for Engineers. 3rd edition, John Wiley and Son, Inc., Hoboken, New Jersey, USA.
[19] Incropera, F.P., Dewitt, D.P., Bergman, T.L., Lavine, A.S. (2006). Fundamental of Heat and Mass Transfer. Sixth Edition, John Wiley and Sons, USA.
[20] Ananta, H., Padang, Y.A., Mirmanto, M. (2017). Unjuk kerja kulkas termoelektrik dengan rangkaian seri dan pararel pada beban air 1500 ml. Dinamika Teknik Mesin 7: 80-86. https://doi.org/10.29303/dtm.v7i2.157
[21] Jugsujinda, S., Vora-ud, A., Seetawan, T. (2011). Analyzing of thermoelectric refrigerator performances. Procedia Engineering, 8: 154-159. https://doi.org/10.1016/j.proeng.2011.03.028
[22] Cengel, Y.A. (2002). Heat Transfer a Practical Approach. 2nd Edition, Mcgraw-Hill (Tx).
[23] Gökçek, M., Şahin, F. (2017). Experimental performance investigation of minichannel water cooled-thermoelectric refrigerator. Case Studies in Thermal Engineering, 10: 54-62. https://doi.org/10.1016/j.csite.2017.03.004