Feasibility Study of Cold Production Using Activated Carbon/CO2 Pair

Amal Bel Haj Jrad* | Abdelaziz Zagnani | Abdallah Mhimid | Mohammed El Ganaoui
© 2019 IIETA. This article is published by IIETA and is licensed under the CC BY 4.0 license (http://creativecommons.org/licenses/by/4.0/).
OPEN ACCESS
The use of CO2 for adsorption cooling system is attractive and interesting. the production of solar cooling adsorption using activated carbon possesses many advantages: nontoxic and nonflammable natural refrigerant, with zero ozone depleting potentiel, negligible global warming potentiel for refrigeration and operating with solar thermal energy. A computer program written in Fortran language has been developed to provide us with the time-space evolution of temperature and average fluid content and to optimize the heat and mass transfers performance using activated-carbon/CO2 pair in Monastir city (Tunisia) during sorption phenomena. The main numerical results showed that activated carbon / methanol pair is more efficient than activated carbon / CO2 pair. COPs is less than 0.206 and 0.098 for activated-carbon/methanol and activated-carbon/CO2 pairs, respectively. The temperature is strongly related to mass desorbed. So, to improve the solar coefficient of performance COPs, it is necessary to have a large evaporation temperature and a low condensation temperature.
solar adsorption cooling, heat and mass transfers, activated carbon/CO2 pair, solar coefficient of performance (COPs)
Throughout Energy is an essential input to all economic activities, therefore access to energy is a vital component to ensure economic competitiveness and growth. The conventional fossil-fuel based energy structure comprises of fuel sources like coal, natural gas and petroleum. These sources are non-renewable in nature because their supply is limited and finite. In addition to being unsustainable, the fossil-fuel based energy structure is a major contributor to climate change and in some cases it proliferates adverse ecological impacts. The catastrophic effects caused by the overdependence of fossil based fuel sources have forced modern economies to consider renewable forms of energy. Renewable energy sources are infinite since they are naturally replenished. Adsorption cooling system is one of the most promising research topics in field of renewable energy. Common adsorbents, which have been studied in adsorption cooling applications: zeolite, silica-gel, and activated-carbon [1-7]. The activated carbon has been used with different refrigerants for low-temperature applications [8] for example activated-carbon/methanol [9, 10], activated-carbon/ammonia [11, 12], activated- carbon/ethanol [13, 14], activated-carbon/ /HFO-1234ze(E) [15]. During this work we are interested to the production of cold by adsorption using activated carbon / CO2 pair. The studies made so far are few, we note some work [16-20]. Animesh Pal et al. [16] have studied, experimentally, CO2 adsorption by a composite adsorbent using three models. They have showed that the Toth model is the most adequate.
Skander Jribi et al. [17] studied the adsorption kinetics of CO2 on a microporous activated carbon powder of Maxorb III type. They found that the classical linear driving force (LDF) allows for better tuning of Toth and Duinin-Astakhov models.
Vinod Kumar Singh et al. [18] have experimentally determined CO2 adsorption isotherms on three types of activated carbons. They found that specific cooling effect (SCEmax) and maximum coefficient of performance (COPmax) are respectively equal to 25.85 kJ / kg and 0.09, when heating temperature is 80 °C and evaporation temperature is 15 °C.
Skander Jribi et al. [19] studied, numerically, the performance of four-bed adsorption refrigeration machine using activated carbon / CO2 pair. They found that with heating temperature of 95 °C and an optimal desorption pressure of 79 bar, the maximum coefficient of performance is 0.1.
Wu Fan et al. [20] have studied, theoretically and experimentally, CO2 adsorption by five types of activated carbon to determine the maximum capacity of CO2 adsorption for each adsorbent. This study, also allowed that coefficient of performance is better when pore diameter of activated carbon is between 7 and 15 A.
Nor Adilla Rashidi et al. [21] have studied, experimentally, CO2 adsorption by using a static volumetric instrument. They have determined CO2 adsorption isotherms using a various isotherm models. They found that Freundlich isotherm is the most adequate to the experimental data.
Saha et al. [22] measured CO2 adsorption isotherms using activated carbon fiber of type A-20 and activated carbon powder of type Maxsorb III. The results show that that The Tóth and modified D−A isotherms are better fitting than that of the Langmuir and the D−A equations.
Garcia et al. [23] measured CO2 adsorption isotherms on phenol-formaldehyde resin based activated carbon at three different temperatures 298 K, 318 K and 338 K. They have found that the CO2 adsorption capacity dropped from 440.14 to 264.08 mg/g as the temperature increased from 298 to 338 K.
Yu et al. [24] studied CO2 adsorption isotherms on commercial Kureha carbon at different temperatures (298–323 K). They have found that the adsorption capacity decreased from 462.15 to 374.12 mg/g with increase in temperature from 298 to 323 K.
As such, the purpose of this article is to study heat and mass transfers in a flat solar collector using activated-carbon/CO2 pair in order to study the feasibility of this pair for adsorption refrigeration cycle evolution under Monastir city climatic conditions. According to various studies cited above, we have chosen the Dubinin model since the results showed that D-A isotherm's equation is better fitting than that of the other equations. Numerical results have been compared with activated carbon/methanol pair.
2.1 Mathematical formulation
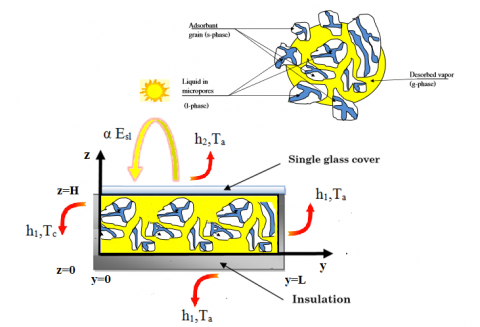
The adsorber is a plane collecter (Figure1) with three phases: a solid phase (activated carbon), liquid phase (methanol or CO2), and a gaseous phase (vapor methanol or vapor CO2. The macroscopic equations governing coupled heat and mass transfer are derived from the volume-averaging technique [25]. Thermo-physical properties of the porous bed are constant and independant of temperature. The porous medium is undeformable, homogeneous and isotropic and bed porosity and grain porosity are supposed constant. Gas-solid and solid-liquid surfaces are immobile.
Figure 1. Solar plan set-up
Coupled heat and mass transfers model is written in two-dimensional configuration (oy, oz) and the assumption of local thermal equilibrium for the energy conservation equation as well as the Darcy flow model are assumed to be valid.
Based on the above assumptions, the macroscopic governing equations can be written as follows:
Mass conservation equation:
Gaseous phase:
$\frac{\partial\left(\varepsilon_{b} \rho_{g}\right)}{\partial t}+\operatorname{div}\left(\rho_{g} \vec{V}_{g}\right)=-\dot{m}$ (1)
where $\rho_{\mathrm{g}}$ is gas density, $\vec{V}_{g}$ is gas velocity, and $\dot{m}$ is the desorbed mass rate.
Momentum equation (Darcy's law):
Darcy’s law can express the gas velocity:
$\overrightarrow{V_{g}}=-\frac{\mathrm{k}}{\mu} \overrightarrow{gradP}$ (2)
where k is the permeability of the medium, it is given by the Koseny-Carmen empirical relation as follows:
$k=\frac{\varepsilon_{b}^{3} d p^{2}}{150\left(1-\varepsilon_{b}\right)^{2}}$ (3)
Energy conservation equation:
We have the following energy equation (when there is local thermal equilibrium) represented by
$(\rho C p)_{e f f} \frac{\partial T}{\partial t}+\rho_{g} C p_{g} \overrightarrow{V_{g}} \overrightarrow{gradT}=\lambda_{e f f} \operatorname{div}(\overrightarrow{gradT})+\dot{m} \Delta H_{\mathrm{vap}}$ (4)
The effective heat capacity of the porous bed is given by:
$(\rho C p)_{e f f}=\left[\left(1-\varepsilon_{b}\right)\left(1-\varepsilon_{m}\right) \rho_{s}\left(C p_{s}+X C p_{L}\right)+\rho_{g} C p_{g} \varepsilon_{b}\right]$ (5)
The effective thermal conductivity is given by:
$\lambda_{e f f}=\left[\left(1-\varepsilon_{\mathrm{b}}\right)\left(1-\varepsilon_{m}\right) \lambda_{\mathrm{s}}+\left(1-\varepsilon_{b}\right) \varepsilon_{m} \lambda_{L}+\varepsilon_{b} \lambda_{\mathrm{g}}\right]$ (6)
Desorption kinetic:
$\dot{m}=\left(1-\varepsilon_{\mathrm{b}}\right)\left(1-\varepsilon_{m}\right) \rho_{s} \frac{\partial X}{\partial t}$ (7)
where X is the fluid content, which is determined by the Dubinin’s equation:
$X=X_{0} \exp \left\{-D\left[T \log \left(\frac{P_{s}(T)}{P_{s}\left(T_{c}\right)}\right)\right]^{2}\right\}$ (8)
In the present study, $\log \left[P_{s}(T)\right]$ is given by the following relation [26]:
$\log \left[P_{s}(T)\right]=A-\frac{B}{T}$ (9)
Thus, the equation of X becomes
$X=X_{0} \exp \left[-D B^{2}\left(\frac{T}{T_{c}}-1\right)^{2}\right]$ (10)
where X0, DB2 depend on the chosen adsorption couples.
2.2 Basic considerations on the adsorption system
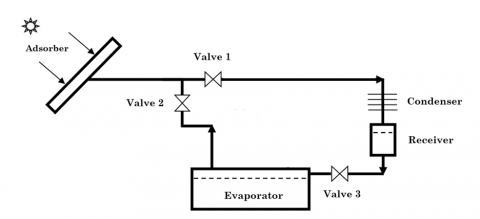
A classical solar adsorption cycle has been studied in this section (Figure 2). At the beginning of the cycle, the valves V1, V2 and V3 are closed, the adsorber is at its low pressure Pe and at its low temperature Ta, the adsorbent is loaded with a maximum adsorbate mass. During the heating of the adsorber, the pressure of the adsorbed gas increases as its temperature increases, the adsorbed mass remains constant.
When the pressure reaches that of the condenser Pc, the valve V2 opens, the desorbed vapor flows to the condenser where it liquefies at the condensing temperature and the condensate is stored in the tank. The heating continues until the adsorber is in equilibrium with the temperature of the hot source where the temperature reaches its maximum value Tg. At this point, the cooling of the adsorber begins. Its pressure decreases and the valve V2 closes. The valve V3 opens, the condensate stored in the tank expands and enters the evaporator, its pressure drops from the pressure of the condenser to that of the evaporator. When the pressure in the adsorber reaches that of the evaporator, the valve V1 opens and the adsorber which is in slight depression sucks the steam produced in the evaporator. The useful effect of cooling occurs during evaporation. The cooling of the adsorber continues until it reaches its minimum temperature, where the adsorbent is saturated with adsorbate. Valves V1 and V3 close and another cycle begins.
Figure 2. Solar adsorption refrigeration system
Initially, the temperature and fluid content in the adsorber are supposed to be constant:
$T(0, y, z)=T_{i}$ (11)
$P(0, y, z)=P_{i}$ (12)
$X(0, y, z)=X_{i}$ (13)
The three faces: (y=L), (z=0), and (z=H) are impermeable to mass transfer, and then
$\frac{\partial P}{\partial y}(t, L, z)=0 ; v_{y}(t, L, z)=0$
$\frac{\partial P}{\partial z}(t, y, 0)=0 ; v_{z}(t, y, 0)=0$
$\frac{\partial P}{\partial z}(t, y, H)=0 ; v_{z}(t, y, H)=0$
At the inlet face (y=0), the thermal boundary condition is written.
$\lambda_{e f f} \frac{\partial T}{\partial y}(t, 0, z)=h_{1}\left(T-T_{c}\right)$ (14)
The faces (y=0), (y=L), and (z=0) are thermally insulated by an insulator with a very low overall conductance, they are given by:
$\lambda_{e f f} \frac{\partial T}{\partial z}(t, y, 0)=h_{1}\left(T_{a}-T\right)$ (15)
$-\lambda_{e f f} \frac{\partial T}{\partial y}(t, L, z)=h_{1}\left(T_{a}-T\right)$ (16)
where h1 depends on the conductivity of the insulator and convective terms inside and outside the box (In this case we find that h1 = 2 W / K.m)
The upper face of the collector (z = H) is heated by the solar energy, so the thermal boundary conditions is written as follows:
$\lambda_{e f f} \frac{\partial T}{\partial x}(t, y, H)=\alpha E_{s l}-h_{2}\left(T-T_{a}\right)$ (17)
where α is the optical efficiency of the solar collector (it is 0.8) and h2 is a convective term which is equal to 4.
To clearly appreciate the effects of the influencing parameters on fluid flow, heat, and mass-transfer characteristics, we have defined the average reduced temperature and the average reduced moisture content, respectively, as follows:
$\overline{T}=\frac{1}{L H} \int_{0}^{L} \int_{0}^{H} \frac{T}{T_{i}} d y d z$ (18)
$\overline{X}=\frac{1}{L H} \int_{0}^{L} \int_{0}^{H} \frac{X}{X_{i}} d y d z$ (19)
Solar performance coefficient
A study of heat and mass transfers evolution under the climatic conditions of the city of Monastir, Tunisia has been conducted in order to improve the performance of solar adsorption cooling system.
The solar performance coefficient of an adsorption cooling machine COPs is defined by the ratio between the amount of cold produced and the amount of solar energy incident. We therefore write:
$\operatorname{COPs}=\frac{\mathrm{Qe}}{\mathrm{Esl}}$
$C O P s=\frac{Q e}{\mathrm{Esl}}$ (20)
Qe = Δmdes [Lv −Cp(Tc −Te )] (21)
where Δmdes = Ms (Xf −Xi) and Ms = (1−εm)(1−εb)ρs S e
We obtain
Qe =(1−εm)(1−εb)ρs S e ∆X [Lv −Cp(Tc −Te)] (22)
where ∆X is the difference between the mass fluid content in the initial state and that in the final state (∆X=Xi −Xf)
Lv: is the latent heat of evaporation of the adsorbed fluid.
Cp (Tc - Te): Cp (Tc - Te): is the sensible heat necessary to cool the fluid desorbed from the condenser temperature Tc to the temperature Te of the evaporator
The solar global energy incident during a day is obtained by integration of the instantaneous power Esl=Imax sin(π t/Δt), we obtain therefore:
$E s l=\frac{2 I_{\max } \Delta t}{\pi}$ (23)
The system of differential equations governing the heat and mass transfers during desorption in solved numerically by the classical finite volumes method. We used an implicit scheme for the temporal derivative terms, the upwind scheme for the convective terms, and a centered scheme for the convective terms, and a centered scheme for the diffusive terms. The obtained numerical code is iterative, and the convergence criterion is that when the actual error for all variables is lower than 10-6. A numerical study of the grid has been achieved for a size ranging from 26*10 to 26*26 and the grid of 26*26 exhibit good compromise between the accuracy and the computation time to be used in all investigated case.
The plane adsorber used is of length L=1 m, width w=1 cm, and height H=0.04 m. The thermophysical properties used in all the numerical simulations are listed in Table 1.
Table 1. Thermophysical property values used in numerical simulations
|
Activated carbon |
$C_{p s}=711 \mathrm{J.kg}^{-1} \cdot \mathrm{K}^{-1}$ , $\lambda_{s}=1.6 \mathrm{W} \cdot \mathrm{m}^{-1} \cdot \mathrm{K}^{-1}$ , $\mathrm{d}_{\mathrm{p}}=2.5 \times 10^{-3} \mathrm{m}$ , $\varepsilon_{b}=0.34, \varepsilon_{m}=0.43$ |
|
Methanol |
$C_{P l}=2534 \mathrm{J} \cdot \mathrm{kg}^{-1} \cdot \mathrm{K}^{-1}$ ; $\lambda_{L}=0.2008 \mathrm{W} \cdot \mathrm{m}^{-1} \cdot \mathrm{K}^{-1}$ , $C_{P g}=3617 \mathrm{J} \mathrm{kg}^{-1} \cdot \mathrm{K}^{-1}$ ; $\lambda_{\mathrm{g}}=0.0154 \mathrm{W.m}^{-1} \cdot \mathrm{K}^{-1}$,ΔHvap = 1.418 106 J.K-1 |
|
Carbon dioxide |
$C_{P l}=6347 \mathrm{J} \cdot \mathrm{kg}^{-1} \cdot \mathrm{K}^{-1}$; $\lambda_{L}=0.8 \mathrm{W} \cdot \mathrm{m}^{-1} \cdot \mathrm{K}^{-1}$, $C_{P g}=8012 \mathrm{J} \mathrm{kg}^{-1} \cdot \mathrm{K}^{-1}$; $\lambda_{\mathrm{g}}=0.045 \mathrm{W.m}^{-1} \cdot \mathrm{K}^{-1}$ , ΔHvap = 1.52 106 J.K-1 |
3.1 Discussion
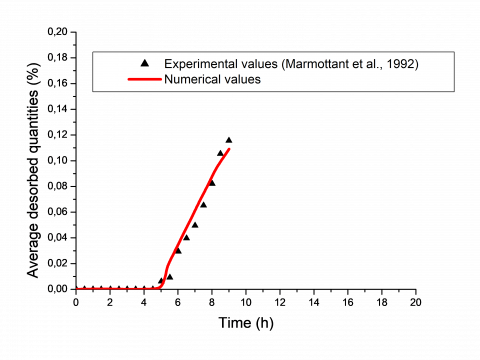
The numerical code has been validated with the closest available works and good agreement was shown by A. Zegnani et al. [27]. Obtained results are compared with the experimental data of Marmottant et al. [28] in figures 3a and 3b. The numerical results are in accordance with experimental results.
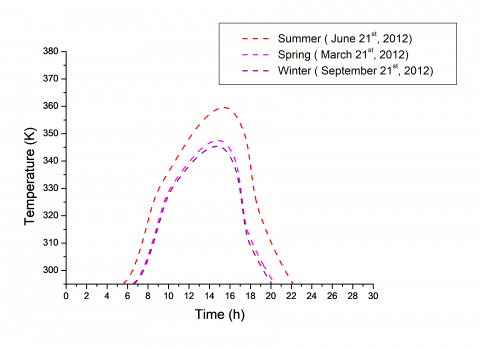
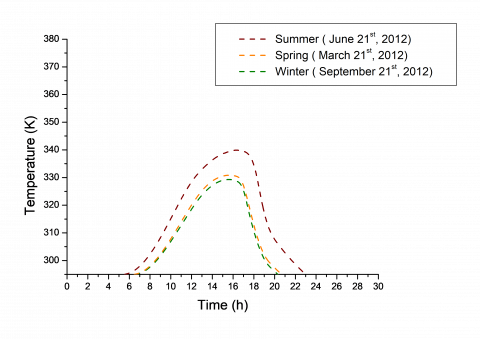
During this work, we present the temperature evolution and fluid content as a function of time for three solar recordings (March 21, June 21, and September 21) (Figure 4).
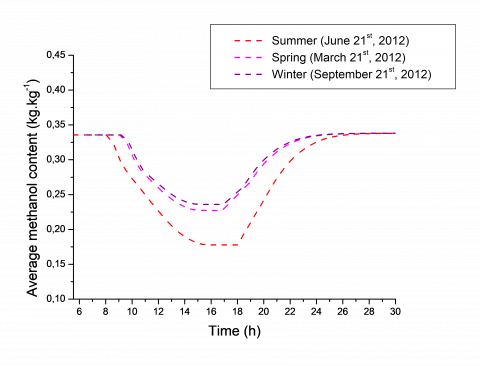
These curves are shown in Figures 5.a and 5.b in the case of activated carbon / methanol pair. It emerges from this study that heat and mass transfers are coupled. In fact, when collector is heated by solar energy, temperature increases and fluid content decreases simutanely.
(a) Temperature versus time
(b) Average desorbed quantities versus time
Figure 3. Comparison between numerical results of temperature field / fluid content field versus available experimental data
Figure 4. Solar energy time evolution during the four typical days March 21, June 21, September 21, and December 21
Numerical simulation allows us to distinguish two periods. the first period for desorption which extends between 6h until 17h and an adsorption period which extends until the next morning.
During desorption period, the collector starts to heat up from 6 o'clock, which causes the increasing of temperature, but fluid content remains constant. This period is called the heating period.
From about 10 h, temperature reaches 325 K, the desorption begins and fluid content decreases rapidly in the beginning.
Desorption rate decreases progressively and tends to zero at the end of desorption. The fluid content takes a constant value, which is its equilibrium value. It can be noted that this equilibrium value depends on temperature and specific humidity.
The equilibrium fluid content is the lowest for the month of June when heating is very important.
During adsorption, the fluid content progresses with time. In fact, the collector cools gradually and temperature decreases. At the end of adsorption, fluid content resumes its equilibrium value corresponding to initial climatic conditions.
(a) Activated-carbon/methanol pair temperature evolution
(b) Average methanol content evolution
Figure 5. Activated-carbon/methanol pair temperature / average methanol content evolution with time on typical days
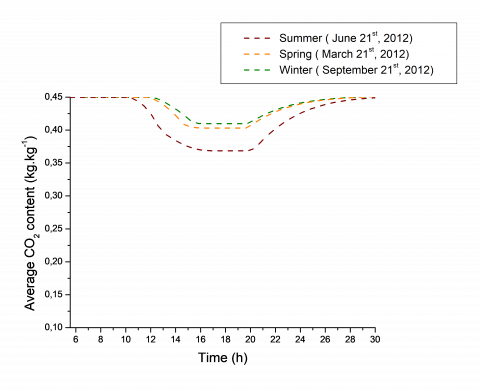
The same simulation was performed to determine average temperature and average CO2 content for three seasons using activated carbon / CO2 pair (see Figures 6.a and 6.b).
The same general findings are observed as before. only the desorbed amount of CO2 is less than that obtained for methanol.
(a) Activated-carbon/CO2 pair temperature evolution
(b) Average CO2 content evolution
Figure 6. Activated-carbon/CO2 pair temperature / average CO2 content evolution with time on typical days
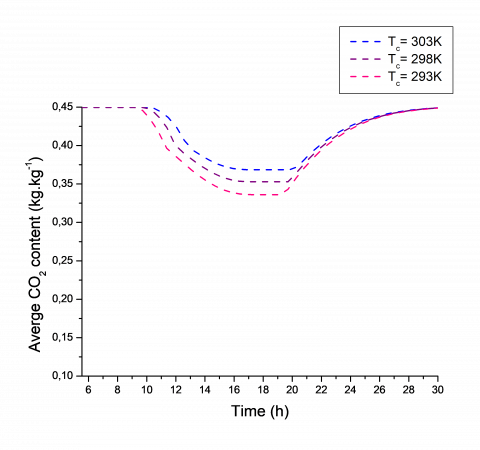
3.2 Influence of condensation temperature and evaporation temperature on average fluid content
(a) Influence of condensation temperature on average CO2 content
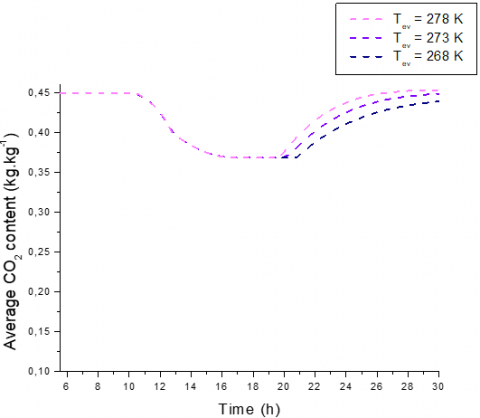
(b) Influence of evaporation temperature on average CO2 content
Figure 7. Influence of condensation temperature / evaporation temperature on average CO2 content
The fluid content for various values of condensation temperature (293 K, 298 K and 303 K) are presented in (Figure 7a). The results allow us to observe that the increase of the condensation Tc has an important effect on the
desorption acceleration. Indeed, when Tc increases, reducing desorption and consequently the desorbed mass decreases. Similarly, we are interested in the effect of evaporation temperature on the average content. The numerical simulation allows us to represent the average content evolution for various values of evaporation temperature (268 K, 273 K and 278 K) in (Figure 7b). The results allow us to observe that when Tev increases, reducing desorption and so the quantity of the desorbed average content decreases.
3.3 Coefficient of performance COPs
The solar performance coefficient of an adsorption-cooling machine COPs is defined by the ratio between the amount of cold produced and the amount of solar energy incident. We have compiled in Tables 2a and 2b the different COPs values of both pairs during three days.
The results have shown that a faster desorption by methanol rather than by CO2 causes an activated-carbon/methanol COPs to be higher than that of activated-carbon /CO2 pair. The value obtained of solar coefficient of performance COPs is acceptable for CO2 and very important for methanol. In fact, COPs is less than 0.206 and 0.098 for activated-carbon/methanol and activated-carbon/CO2 pairs, respectively.
Table 2a. Activated carbon/ methanol COPs variations during the four typical days in Monastir area
|
|
Difference between initial and final water content Xi-Xf (kg kg-1) |
Amount of cooling produced Qe (kJ) |
Amount of incident solar energy Esl (kJ) |
COPs |
|
21 March 2012 |
0.108 |
3567.389 |
17340.279 |
0.205 |
|
21 June 2012 |
0.157 |
5192.369 |
25194.902 |
0.206 |
|
21 September 2012 |
0.099 |
3280.222 |
16138.565 |
0.203 |
Table 2b. Activated-carbon/CO2 COPs variations during the four typical days in Monastir area
|
|
Difference between initial and final water content Xi-Xf (kg kg-1) |
Amount of cooling produced Qe (kJ) |
Amount of incident solar energy Esl (kJ) |
COPs |
|
21 March 2012 |
0.046 |
1428.705 |
17340.279 |
0.082 |
|
21 June 2012 |
0.081 |
2486.904 |
25194.902 |
0.098 |
|
21 September 2012 |
0.039 |
1223.790 |
16138.565 |
0.075 |
Table 3a. Influence of condensation temperature on average CO2 content
|
|
Amount of cooling produced Qe (kJ) |
Amount of incident solar energy Esl (kJ) |
COPs |
|
Tc=303 K |
2490.456 |
25194.902 |
0.098 |
|
Tc= 298 K |
3060.149 |
25194.902 |
0.121 |
|
Tc= 293 K |
3698.319 |
25194.902 |
0.146 |
Table 3b. Influence of evaporation temperature on average CO2 content
|
|
Amount of cooling produced Qe (kJ) |
Amount of incident solar energy Esl (kJ) |
COPs |
|
Te= 278 K |
2568.125 |
25194.902 |
0.102 |
|
Te= 273 K |
2490.456 |
25194.902 |
0.098 |
|
Te= 268 K |
2412.788 |
25194.902 |
0.095 |
The theoretical study allows us to determine the COPs variation of activated carbon/CO2 pair according to condensation temperature and evaporation temperature in Tables 3a and 3b, respectively. The study shows that the increase of the condensation temperature Tc, decreasing the therefore the mass desorbed and therefore decreasing the value of solar coefficient of performance COPs and the increase of the evaporation temperature, increasing the value of solar coefficient of performance COPs.
During this work, we have studied, numerically heat and mass transfer in a flat solar collector during desorption and adsorption using activated carbon / methanol and activated carbon / CO2 pairs.
A numerical home code is used to determine the spatio-temporal evolution of various variables essentially average temperature and fluid content. This computational approach permits us, also, to calculate solar performance coefficient.
This study shows that the solar performance coefficient of adsorption machine is better in summer and the activated carbon / methanol pair is better than that of activated carbon / CO2, in fact solar performance coefficient can reach 0.206 for activated carbon / methanol pair and 0.098 for that of activated carbon / CO2.
Similarly, we have studied the effect of different parameters (condensation temperature and evaporation temperature) on the desorption acceleration and desorbed mass. The value of the solar coefficient of performance COPs was also studied according to these parameters. The results have shown that for Tc= 293 K and Te= 278 K we obtained the important value of solar coefficient of performance COPs. So, to improve the solar coefficient of performance COPs, it is necessary to have a large evaporation temperature Tev and a low condensation temperature Tc.
|
A Cp E h I |
Area, m2 specific heat, J.kg-1.K-1 energy, kJ heat transfer coefficient, W.m-2.K-1 incident radiation, W .m-2 |
|||
|
Lv |
latent heat of vaporization, J.kg-1 |
|||
|
ֺm P Q |
desorbed mass rate, kg.s-1 pressure, Pa cooling produced, kJ |
|||
|
T t |
Temperatue, K Time, s |
|||
|
V |
Velocity, m.s-1 |
|
||
|
X $\Delta H$ |
moisture content, kg.kg-1 heat of desorption, J.kg-1 |
|
||
|
$\Delta X$ Δ |
cycled mass, kg. kg-1 thickness, m |
|
||
|
ρ α |
density, kg.m-3 absorptivity |
|
||
|
$\varepsilon$ |
porosity |
|
||
|
$\lambda$ |
thermal conductivity, W.m-1.K-1 |
|
||
|
Subscripts
|
|
|
||
|
a |
ambient |
|
||
|
b |
Bed |
|
||
|
c |
Condensation |
|
||
|
e eff |
evaporation effective |
|
||
|
g |
Gaz |
|
||
|
H |
Heating |
|
||
|
i |
Initial |
|
||
|
l |
Liquid |
|
||
|
m max |
grain maximum |
|
||
|
s sat sl |
solid saturation solar |
|
||
|
vap
Abbreviation
COP COPs COPth |
vapor
coefficient of performance solar coefficient of performance themal coefficient of performance |
|
||
[1] Teo, H.W.B., Chakraborty, A., Fan, W. (2017). Improved adsorption characteristics data for AQSOA types zeolites and water systems under static and dynamic conditions. Microporous and Mesoporous Materials, 242: 109-117. http://dx.doi.org/10.1016/j.micromeso.2017.01.015
[2] Teo, H.W.B., Chakraborty, A., Han, B. (2017). Water adsorption on CHA and AFI types zeolites: Modelling and investigation of adsorption chiller under static and dynamic conditions. Applied Thermal Engineering, 127: 35-45. https://doi.org/10.1016/j.applthermaleng.2017.08.014
[3] Mohammed, R.H., Mesalhy, O., Elsayed, M.L., Chow, L.C. (2017). Novel compact bed design for adsorption cooling systems: Parametric numerical study. International Journal of Refrigeration, 80: 238-251. https://doi.org/10.1016/j.ijrefrig.2017.04.028
[4] Bouzeffour, F., Khelidj, B., Tahar Abbes, M. (2016). Experimental investigation of a solar adsorption refrigeration system working with silicagel/water pair: A case study for Bou-Ismail Solar data. Solar Energy, 131: 165-175. http://dx.doi.org/10.1016/j.solener.2016.02.043
[5] El Fadar, A. (2015). Thermal behavior and performance assessment of a solar adsorption cooling system with finned adsorber. Energy, 83: 674–684. http://dx.doi.org/10.1016/j.energy.2015.02.074
[6] Hadj Ammar, M.A., Benhaoua, B., Bouras, F. (2017). Thermodynamic analysis and performance of an adsorption refrigeration system driven by solar collector. Applied Thermal Engineering, 112: 1289-1296. http://dx.doi.org/10.1016/j.applthermaleng.2016.09.119
[7] Jrad, A.B.H., Hamida, M.B.B., Ghnay, R., Mhimid, A. (2017). Contribution to the study of combined adsorption–ejection system using solar energy. Advances in Mechanical Engeneering, 9(7): 1-9. https://doi.org/10.1177/1687814017711855
[8] Elsayed, A.M., Askalany, A.A., Shea, A.D., Dakkama, H.J., Mahmoud, S., Al-Dadah, R., Kaialy, W. (2017). A state of the art of required techniques for employing activated carbon in renewable energy powered adsorption applications. Renewable and Sustainable Energy Reviews, 79: 503-519. https://doi.org/10.1016/j.rser.2017.05.172
[9] Hadj Ammar, M.A., Benhaoua, B., Bouras, F. (2017). Thermodynamic analysis and performance of an adsorption refrigeration system driven by solar collector. Applied Thermal Engineering, 112: 1289-1296. http://dx.doi.org/10.1016/j.applthermaleng.2016.09.119
[10] Hadj Ammar, M.A., Benhaoua, B., Balgouthi, M. (2015). Simulation of tubular adsorber for adsorption refrigeration system powered by solar energy in Sub-Sahara region of Algeria. Energy Conversion and Management, 106: 31–40. http://dx.doi.org/10.1016/j.enconman.2015.09.013
[11] Xu, S.Z., Wang, L.W., Wang, R.Z. (2016). Thermodynamic analysis of single-stage and multi-stage adsorption refrigeration cycles with activated carbon-ammonia working pair. Energy Conversion and Management, 117: 31–42. https://doi.org/10.1016/j.enconman.2016.03.010
[12] Louajar, M., Mimet, A., Ouammi, A. (2011). Study of the effect of finned tube adsorber on the performance of solar driven adsorption cooling machine using activated carbon–ammonia pair. Applied Energy, 88(3): 690-698. https://doi.org/10.1016/j.apenergy.2010.08.032
[13] Palomba, V., Dawoud, B., Sapiezza, A., Vasta, S., Frazzica, A. (2017). On the impact of different management strategies on the performance of a two-bed activated carbon/ethanol refrigerator: An experimental study. Energy Conversion and Management, 142: 322-333. http://dx.doi.org/10.1016/j.enconman.2017.03.055
[14] Umair, M., Akisawa, A., Ueda, Y. (2014). Simulation study of continuous solar adsorption refrigeration system driven by compound parabolic concentrator. Open Renew Energy Journal, 7: 1–12. http://dx.doi.org/10.2174/1876387101407010001
[15] Jribi, S., Saha, B.B., Koyama, S., Chakraborty, A., Ng, K.C. (2013). Study on activated carbon/ HFO-1234ze(E) based adsorption cooling cycle. Applied Thermal Engineering, 50(2): 1570–1575. http://dx.doi.org/10.1016/j.applthermaleng.2011.11.066
[16] Pal, A., El-Sharkawy, I.I., Saha, B.B., Jribi, S., Miyazaki, T., Koyama, S. (2016). Experimental investigation of CO2 adsorption onto a carbon based consolidated composite adsorbent for adsorption cooling application. Applied Thermal Engeneering, 109: 304-311. https://doi.org/10.1016/j.applthermaleng.2016.08.031
[17] Jribi, S., Miyazaki, T., Saha, B.B., Pal, A., Younes, M.M., Koyama, S., Maalej, A. (2017). Equilibrium and kinetics of CO2 adsorption onto activated carbon. Inertantional Journal of Heat and Mass Transfer, 108: 1941-1946. https://doi.org/10.1016/j.ijheatmasstransfer.2016.12.114
[18] Singh, V.K., Kumar, E.A. (2017). Experimental investigation and thermodynamic analysis of CO2 adsorption on activated carbons for cooling system. Journal of CO2 Utilization, 17: 290-304. https://doi.org/10.1016/j.jcou.2016.12.004
[19] Jribi, S., Saha, B.B., Koyama, S., Bentaher, H. (2014). Modeling and simulation of an activated carbon-CO2 four bed based adsorption coolig system. Energy Conversion and Management, 78: 985-991. https://doi.org/10.1016/j.enconman.2013.06.061
[20] Fan, W., Chakraborty, A., Kayal, S. (2016). Adsorption cooling cycles:Insights into carbon dioxide adsorption on activated carbons. Energy, 102: 491-501. https://doi.org/10.1016/j.energy.2016.02.112
[21] Rashidia, N.A., Yusupa, S., Borhana, A. (2016). Isotherm and thermodynamic analysis of carbon dioxide on activated carbon. Procedia Engineering, 148: 630-637. https://doi.org/10.1016/j.proeng.2016.06.527
[22] Saha, B.B., Skander, J., Shigeru, K., EI-Sharkawy, I.I. (2011). Carbon dioxide adsorption isotherms on activated carbons. J. Chem. Eng. Data, 56(5): 1974-1981. https://doi.org/10.1021/je100973t
[23] García, S., Pis, J.J., Rubiera, F., Pevida, C. (2013). Predicting mixed-gas adsorption equilibria on activated carbon for precombustion CO2 capture. Langmuir 29(20): 6042–6052. https://doi.org/10.1021/la4004998
[24] Yu, H., Wang, X., Xu, C., Chen, D.L., Zhu, W., Krishna, R. (2015). Utilizing transient breakthrough for evaluating the potential of Kureha carbon for CO2 capture. Chemical Engineering Journal, 269: 135–147. https://doi.org/10.1016/j.cej.2015.01.091
[25] Whitaker, S. (1977). Simultaneous heat, mass and momentum transfer in porous media: A theory of drying. Advances in Heat Transfer, 13 : 199-203. https://doi.org/10.1016/S0065-2717(08)70223-5
[26] Khodr, A. (1989). Contribution expérimentale à l'étude de la cinétique d'adsorption de gaz. Thèse de doctorat. ENSAM, France.
[27] Zegnani, A., Mhimid, A., Dhahri, H., Slimi, K. (2010). New modeling approach for heat and mass transfers during sorption phenomena in a plane adsorber. Journal of Porous Media, 13: 1087-1100. http://dx.doi.org/10.1615/JPorMedia.v13.i12.40
[28] Marmottant, B., Mhimid, A., Elgolli et Ph. Grenier, S. (1992). Installation de réfrigération solaire à adsorption, expérimentation et modélisation. Revue Générale de Thermique, 362: 97-10.