Foued Chabane* | Fares Adouane | Noureddine Moummi | Abdelhafid Brima | Djamel Bensahal
© 2019 IIETA. This article is published by IIETA and is licensed under the CC BY 4.0 license (http://creativecommons.org/licenses/by/4.0/).
OPEN ACCESS
Thin layer drying of mint was evaluated using a solar dryer at the university of Biskra. The experimental moisture ratios of the samples were fitted to eight drying models. The drying experiments were carried out on the mint with effect the mass flow rate, which varies from 0.018 to 0.034 kg.s-1. In this part of the study, we cut the mint to virtual median little pieces. The mathematical models were tested with the drying behavior of mint in the laboratory solar dryer. The coefficients of the models were determined by the multiple regression method in the solar dryer to find out the most suitable moisture ratio model. We conclude that the mass flow rate influence onto the coefficients of correlation it’s meaning the mass flow it is an important factor. The our model was found as the best model based on statistical parameters of R², RMSE and χ². The model is applicable to predict the moisture content of mint during solar drying of mint.
drying room, R², RMSE, χ². moisture content, mass flow rate, mint, solar drying
An improved technology in utilizing solar energy for drying agricultural is the use of solar dryers where the air is heated in a solar collector and then passed through products. There are two basic types of solar dryer appropriate for use with agricultural: natural convection dryers where the air flow is induced by thermal gradients; and forced convection dryers wherein air is forced through a solar collector. In this study the drying solar with forced convection, The forced convection solar dryer can be considered as a conventional mechanical drying system in which air is forced through a dried product holder but the air is heated by a flat plate solar collector rather than by more conventional means.
Most developing countries are unable to solve their food problems for then tire population because of the rapidly increasing number of people in their respective territories.
Some research effort to design and develop a forced convection solar dryer using evacuated tube air collector. Their performance was compared with natural sun drying. The results of the present study show that the proposed solar dryer has been greater efficiency, and the moisture content of bitter gourd is reduced from 91 % to 6.25 % in 6 hours as compared to 10 hours in natural sun drying [1].
Another work studies an experimental study was conducted to investigate the performance of a solely solar drying system and a system equipped with an auxiliary heater as a supplement to the solar heat, [2]. The performances of both are compared to that of natural drying. Beans and peas are dehydrated in a system that consists of two flat plate collectors, a blower, and a drying chamber. Tests with four different airflow rates, namely, 0.0383, 0.05104, 0.0638, and 0.07655 m3/s were conducted. The efficiency of the mixed drying system was found to increase by 25 % to 40 % compared to the solely solar drying. A best fit to the experimental data of peas and beans was obtained by six exponential equations for the various systems with a correlation coefficient in the range 0.933 and 0.997.
Solar drying can be an effective means of food preservation since the product is completely protected during drying against rain, dust, insects and animals [3].
There is a great diversity of designs and modes of operation: forced convection, Ahmad et al., [4], Indirect forced convection, Bahlou et al., [5], Direct cabinet and indirect cabinet solar dryers, Banoult et al., [6], Solar-biomass hybrid dryer enhanced by the Co-Gen technique, Tadahmun and Hussai, [7]; Leon and Kumar, [8], Greenhouse solar dryers, Abdullah, [9]; Bechoff et al., [10], Direct solar dryer, Hii et al., [11], Heat pumps, Fadhel et al., [12]; Li et al., [13], Indirect natural convection solar dryer with chimney, solar dryer with greenhouse as collector, solar tunnel dryer (air collector), hybrid solar dryer assisted by evacuated tube collectors, Jairaj et al., [14]. F. Chabane et al. [15-26], Presents a study of heat transfer in a solar air heater by using new design of solar collector. The collector efficiency in a single pass of solar air heater without, and with using fins attached under the absorbing plate has been investigated experimentally the maximum efficiency obtained for the 0.012 and 0.016 kg/s with, and without fins were 40.02, 51.50 % and 34.92, 43.94 %.
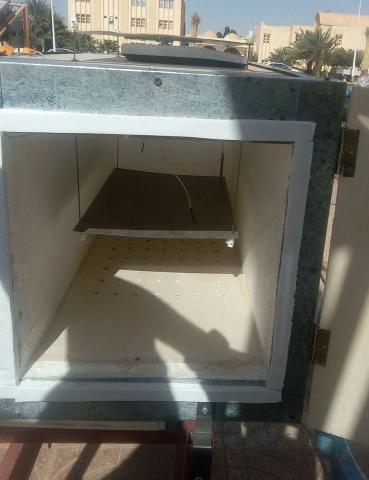
In this study, we focused on agro-food drying, using a solar collector and a drying chamber, which we manually performed in the technological hall of the Department of Mechanical Engineering of the University of Biskra, carried out in the period from February to May 2018.
Figure 1. Experimental setup (solar collector with drying chamber)
-Orifices: We drilled holes in order to distribute the air on the product and avoid burning it. In our case, we put holes 10 mm in diameter in a square board, 30 cm by 30 cm. As show in Figure 2.
Figure 2. Orifices into drying chamber
-The grate: Is a support on which the product is arranged, with holes for the removal of water, attached by four rods equilibrated to allow us to weigh the product without removing it (see Figure 3, This grid is characterized by its hardness and resistance to rust.
Figure 3. Support of the product
Table 1. Parameters of solar drying with m =0.018 kg/s
|
m |
0.018 kg/s |
Before drying
After drying |
|
G |
928.43 W/m² |
|
|
Vwind |
0.98 m/s |
|
|
Tamb |
26.86 °C |
|
|
Te,cham |
60.69 °C |
|
|
Ts,cham |
50.29 °C |
|
|
Tpr |
41.98 °C |
|
|
Tcham |
44.47 °C |
|
|
DTChambre |
-10.40 °C |
|
|
Mt |
168 g |
|
|
Man |
62 g |
|
|
Mw |
106 g |
Table 2. Parameters of solar drying with m =0.029 kg/s
|
m |
0.029 kg/s |
Before drying After drying |
|
G |
919 W/m² |
|
|
Vwind |
1.36 m/s |
|
|
Tamb |
28.04 °C |
|
|
Te,cham |
56.47 °C |
|
|
Ts,cham |
45.51 °C |
|
|
Tpr |
39.94 °C |
|
|
Tcham |
39.45 °C |
|
|
DTChambre |
-10.95 °C |
|
|
Mt |
105 g |
|
|
Man |
39 g |
|
|
Mw |
66 g |
Table 3. Parameters of solar drying with m =0.034 kg/s
|
m |
0.034 kg/s |
Before drying After drying |
|
G |
882 W/m² |
|
|
Vwind |
1.34 m/s |
|
|
Tamb |
32.19 °C |
|
|
Te,cham |
57.49 °C |
|
|
Ts,cham |
48.41 °C |
|
|
Tpr |
43.34 °C |
|
|
Tcham |
43.91 °C |
|
|
DTChambre |
-9.07 °C |
|
|
Mt |
120 g |
|
|
Man |
38 g |
|
|
Mw |
82 g |
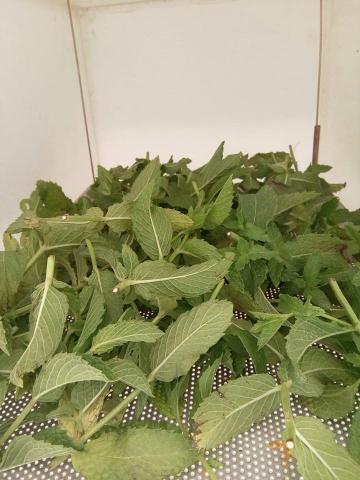
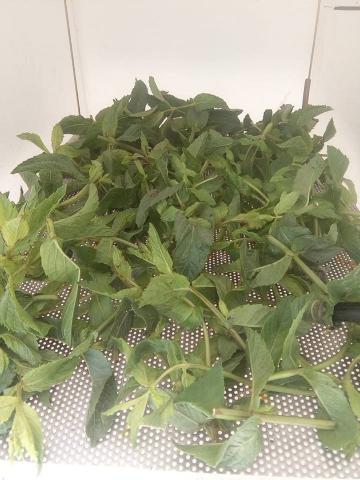
Table 1, 2 and 3, shows the different variation of the solar drying according three different mass flow rates. The temperature of an inlet chamber vary between 56 to 60 °C, approximately is approach, this mean that the effect climate is play with important role about this change. Such as ambiante temperature solar irradiation and velocity wind which varying for each day of the test. The tables show the picture of the wet and dry mint for each experiment.
Preparation for the test:
• Experimental determination:
The dimensions of the collector are:
Dimensions (general): 1.53 m x 0.83 m.
- Dimensions (specific): 1.50 m x 0.80 m.
Calculation of the collector surface:
- Total area: 1.27
- Area (specific): 1.20
• Dimensions of the drying chamber:
- Dimensions (general): 0.80 m x 0.50 m x0.50
- Dimensions (specific): 0.73m x 0.42m x0.39
• Calculation of the volume of the drying chamber:
- Total volume: 0.20
- Characteristics of the drying process:
We summarized the results of the drying process in the Table 2 showing the state of the product before and after drying with a characteristic average, the results are as follows:
Table 4. Mathematical model applied to the drying curves
|
Models |
Equation |
References |
|
Newton |
MR = exp(-k*x) |
(Ayensu, 1997) [27] |
|
Page |
MR=exp(-ktn) |
(Page, 1949; Doymaz, 2004) [28] |
|
Henderson and Pabis |
MR=aexp(-kt) |
(Rahman et al., 1998) [29] |
|
Logarithmic |
MR=aexp(-kt)+c |
(Lahsasni et al., 2004) [30] |
|
Two-term |
MR=aexp(-kt)+cexp(-gt) |
(Dandamrongrak et al., 2002) [31] |
|
Two-term exponential |
MR = aexp(-kt) + (1-a)cexp(-kat) |
(Hayaloglu et al., 2007) [32] |
|
Wang and Singh |
MR=1+at+ct² |
(Hayaloglu et al., 2007) [32] |
|
Midilli et al. |
MR=aexp(-kt) +ct |
(Hayaloglu et al., 2007) [32] |
The moisture content was expressed in percentage wet basis (%, w.b) and then converted to kilogram water per kilogram dry matter. The drying curves were fitted to eight different moisture ratio models to select a suitable model for describing the drying process of mint pieces (Table 4).
The moisture ratio of the samples during drying was expressed by the Eq. (1):
$M R=\frac{M_{t}-M_{e q}}{M_{0}-M_{e q}}$ (1)
However, the moisture ratio (MR) was simplified by modifying the Equation (1) to $\frac{M_{t}}{M_{0}}$ instead of the $\frac{M_{t}-M_{e q}}{M_{0}-M_{e q}}$, [33]. The reduced chi-square (χ² and root mean square error (RMSE) were used as the primary criterion to select the best equation to account for variation in the drying curves of the dried samples [34]. The lower the value of the χ², the better the goodness of the fit. The RMSE gives the deviation between the predicted and experimental values and it is required to reach zero. The statistical values were calculated by Equations (2) and (3):
$\chi^{2}=\frac{\sum_{i=1}^{N}\left(M_{\mathrm{exp}, i}-M_{\mathrm{mod}, i}\right)^{2}}{N-m}$ (2)
$R M S E=\left(\frac{1}{N} \sum_{i=1}^{N}\left(M_{\mathrm{exp}, i}-M_{\mathrm{mod} i}\right)^{2}\right)^{\frac{1}{2}}$ (3)
$S S E=\frac{1}{N} \sum_{i=1}^{N}\left(M_{\mathrm{exp}, i}-M_{\mathrm{mod}, i}\right)^{2}$ (4)
The results of the statistical computations undertaken to assess the consistency of 9 drying models are presented in Tables 5 for the Wang and Singh and our model. The Wang and Singh model yielded the highest values of R² and about our model takes the lowest values of SEE and c² and with important values of R² which the order 3 of all models. To take into account the effect of the drying variables on the our model constants a, c, k and n were regressed against those of drying air temperatures and mass flow rate using multiple regression analysis. Based on the multiple regression analysis, the accepted model was as follows:
$\frac{M_{t}-M_{e q}}{M_{0}-M_{e q}}=c+a \times \sin \left(\pi \frac{(t-k)}{g}\right)$ (5)
Calculation of effective diffusivities:
It has been accepted that the drying characteristics of biological products in the falling rate period can be described by using Fick’s diffusion equation. The solution of Fick’s law for a slab was, according to Equation (6) [35].
$\frac{M_{t}-M_{e q}}{M_{0}-M_{e q}}=\frac{8}{\pi^{2}} \sum_{n=1}^{\infty} \frac{1}{(2 n+1)^{2}} \exp \left(-(2 n+1)^{2} \pi^{2} \frac{D_{e f f} t}{4 H^{2}}\right)$ (6)
For a long drying period, Equation (6) can be further simplified to only the first term of the series [36]. Thus, Equation (6) is written in a logarithmic form according to Equation (7):
$\ln \frac{M_{t}-M_{e q}}{M_{0}-M_{e q}}=\ln \left(\frac{8}{\pi^{2}}\right)-\left(\pi^{2} \frac{D_{e f f}}{4 H^{2}}\right) t$ (7)
Diffusivities are typically determined by plotting experimental drying data in terms of Ln (MR) versus drying time t in Equation (7), because the plot gives a straight line with a slope according to Equation (8) [37].
$k_{0}=\left(\pi^{2} \frac{D_{e f f}}{4 H^{2}}\right)$ (8)
Table 5. Results of nonlinear regression analyses for drying curve fitting
|
Models |
R² |
RMSE |
SSE |
c² |
a |
c |
g |
k |
n |
|
|
Newton |
1 |
0,9533 |
0,0977 |
0,0059 |
0,0095 |
|
|
|
0,0132 |
|
|
2 |
0,9874 |
0,0528 |
0,0017 |
0,0028 |
|
|
|
0,01679 |
|
|
|
3 |
0,9745 |
0,0736 |
0,0033 |
0,0054 |
|
|
|
0,0177 |
|
|
|
Page
|
1 |
0,9647 |
0,0856 |
0,0046 |
0,0073 |
|
|
|
0,00941 |
1,078 |
|
2 |
0,9938 |
0,0376 |
0,0010 |
0,0014 |
|
|
|
0,01005 |
1,118 |
|
|
3 |
0,9763 |
0,0711 |
0,0031 |
0,0051 |
|
|
|
0,01632 |
1,019 |
|
|
Henderson and Pabis |
1 |
0,9459 |
0,0905 |
0,0050 |
0,0082 |
1,0744 |
|
|
0,01416 |
|
|
2 |
0,9855 |
0,0504 |
0,0016 |
0,0025 |
1,0384 |
|
|
0,01732 |
|
|
|
3 |
0,9718 |
0,0705 |
0,0030 |
0,0050 |
1,0511 |
|
|
0,01842 |
|
|
|
Logarithmic |
1 |
0,9936 |
0,1359 |
0,0158 |
0,0185 |
2,43 |
-1,405 |
|
3,78E-03 |
|
|
2 |
0,9934 |
0,0302 |
0,0006 |
0,0009 |
1,12578 |
-0,10579 |
|
1,35E-02 |
|
|
|
3 |
0,9808 |
0,0532 |
0,0018 |
0,0028 |
1,1438 |
-0,109 |
|
1,44E-02 |
|
|
|
Two-term |
1 |
0,9460 |
0,0906 |
0,0050 |
0,0082 |
0,204 |
0,871 |
0,01413 |
0,014214 |
|
|
2 |
0,9855 |
0,0504 |
0,0016 |
0,0025 |
0,519 |
0,5192 |
0,01725 |
0,017398 |
|
|
|
3 |
0,9718 |
0,0705 |
0,0030 |
0,0050 |
0,52553 |
0,52552 |
0,018227 |
0,018615 |
|
|
|
Two-term exponential |
1 |
0,9459 |
0,0904 |
0,0049 |
0,0082 |
0,98366 |
5,552 |
|
0,014178 |
|
|
2 |
0,9966 |
0,0243 |
0,0005 |
0,0006 |
1,9199 |
1,0024 |
|
0,0245 |
|
|
|
3 |
0,9921 |
0,0371 |
0,0012 |
0,0014 |
2,0855 |
1,00177 |
|
0,027699 |
|
|
|
Wang and Singh |
1 |
0,9939 |
0,0466 |
0,0009 |
0,0022 |
-0,0099 |
2,39E-05 |
|
|
|
|
2 |
0,9988 |
0,0128 |
0,0001 |
0,0002 |
-0,0116 |
3,29E-05 |
|
|
|
|
|
3 |
0,944 |
0,0293 |
0,0006 |
0,0009 |
-0,0122 |
3,59E-05 |
|
|
|
|
|
Midilli et al. |
1 |
0,9932 |
0,1437 |
0,0177 |
0,0206 |
1,02496 |
-0,002869 |
|
6,23E-03 |
|
|
2 |
0,9844 |
0,0468 |
0,0009 |
0,0022 |
1,061 |
-0,000165 |
|
1,81E-02 |
|
|
|
3 |
0,9528 |
0,0846 |
0,0028 |
0,0072 |
1,0997 |
-0,000055 |
|
2,22E-02 |
|
|
|
Chabane et al. |
1 |
0,9959 |
0,0191 |
0,0002 |
0,0004 |
0,67498 |
0,64124 |
258,863 |
-210,997 |
|
|
2 |
0,998 |
0,0641 |
0,0015 |
0,0041 |
869,67 |
869,65 |
11477,63 |
-17039,8 |
|
|
|
3 |
0,9903 |
0,0289 |
0,0007 |
0,0008 |
5,92766 |
5,88629 |
874,62 |
-1143,56 |
|
|
Figure 4 shows the variation of the inlet temperature of the drying chamber as a function of time of the day, according to different values of mass flow rate. We can be seen that the inlet temperature takes a maximum value with the low mass flow rate and a minimum in the much mass flow rate, and the evolution of curves takes a same variety.
Figure 4. Inlet temperature of the drying chamber according to mass flow rate
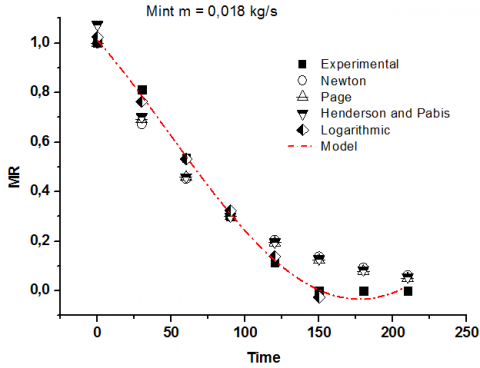
The following curve shows the variation of MR as a function of time for different models, compared to the experimental model. It should be noted that for the drying of this product, all models have the same decreasing appearance.
Figure 5. The moisture content according to models of Newton, Page, Henderson and Pabis, Logarithmic and experimental data with mass flow rate 0.018 kg/s
The following curve shows the variation of MR as a function of time for different models, compared to the experimental model. It should be noted that for the drying of this product, all models have the same decreasing appearance.
Figure 6. The moisture content according to models of Two-Term, Two-term exponential, Wang and Singh, Midilli et al, Prediction model and experimental data with mass flow rate 0.018 kg/s
The following figure shows the variation of MR for a mass flow rate of 0.018 kg / s compared to the proposed model. It can be seen that the proposed model is consistent with other models.
Figure 7. The moisture content according to models of Newton, Page, Henderson and Pabis, Logarithmic and experimental data with mass flow rate 0.029 kg/s.
The following Figure 8 shows a comparison made between the different models for a mass flow rate of 0.029 kg / s. It should be noted that for higher throughput, the drying time is longer. However the evolution of the curves is the same.
For a higher throughput a distribution between the models appears. The proposed model is closer to the experimental curve.
In the following Figure 9 and for a mass flow rate of 0.034 kg /s the shape of the drying curve takes a different shape for the experimental model. Phase 1 (warming up) appears. This is not the case for some models.
Figure 8. The moisture content according to models of Two-Term, Two-term exponential, Wang and Singh, Midilli et al, Prediction model and experimental data with mass flow rate 0.029 kg/s
Figure 9. The moisture content according to models of Newton, Page, Henderson and Pabis, Logarithmic and experimental data with mass flow rate 0.034 kg/s
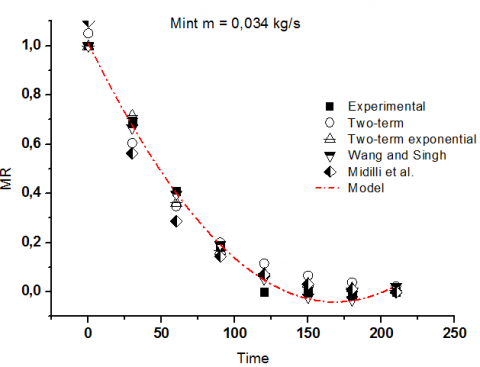
Figure 10. The moisture content according to models of Two-Term, Two-term exponential, Wang and Singh, Midilli et al, Prediction model and experimental data with mass flow rate 0.034 kg/s
Here, we note that for this mass flow, the shape of the variation curve of MR as a function of time of the proposed model follows the evolution of the experiment. This shows a better performance of the proposed model as to the best translation of this drying phenomenon for this product.
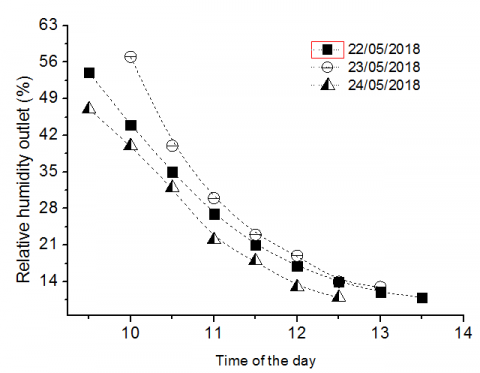
Figure 11. Relative humidity in the outlet drying chamber
The Figure 11 show, the progression of relative humidity which goes to outlet drying chamber, according to three days of the test, we can be remarked that values come much of the inlet solar collector which means the product out much the wet content and that what I needed to come. In the second days the relative humidity is going with a maximum values which begin with it 59 % and the median in the first day with 54 %, and a last variation in the last day with a minimum attain 47 %.
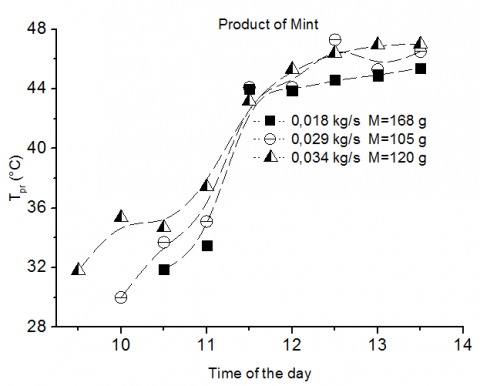
Figure 12. Temperature of the product of mint in the drying chamber
A during the heat air with solar collector which gives this temperature to drying chamber when the product put it inside on the support, under all this we create the source of distribution under the form of orifices in favor of homogenate the heat inside all chamber. In the Figure 12, show the variation of temperature of the mint according to time of the day, we can see all the evolution curves begin with a less temperature and then take a more in the median sun time and for after that is stable with fixe temperature. When the mass flow rate take a much is associating that the product get a much the heat from air.
In conclusion, this experimental study mainly has been carried out to investigate the solar drying behaviour of agricultural products under forced convection, by using an indirect solar dryer, which was designed and constructed previously with local materials. This study considers the thin layer drying under various conditions, for three different mass flow rate and quantities of mint. The experimental data were fitted to different mathematical moisture ratio models to compare them with the extracted model.
Moreover, the effect of the solar radiation intensity is the primary factor to accomplish the drying process as purpose of heating the absorbing plate; the tests recorded good results of solar radiation and average temperature absorbing with maximum values of 928.43 W/m² and 80 °C respectively.
Finley, a several mathematical models were used to determine the reducing moisture ratio, and the our model, showed the best fit to the experimental data with the highest average values of R² and the lowest average values of c² and RMSE. While our extracted model was in agreement with the other models, and it was better just in all times.
[1] Umayal Sundari, A.R., Neelamegam, P., Subramanian, C.V. (2013). An experimental study and analysis on solar drying of bitter gourd using an evacuated tube air collector in Thanjavur, Tamil Nadu, India. Conference Papers in Energy. http://dx.doi.org/10.1155/2013/125628
[2] Khalifa, A.J.N., Al-Dabagh, A.M., Al-Mehemdi, W.M. (2012). An experimental study of vegetable solar drying systems with and without auxiliary heat. ISRN Renewable Energy, 2012. http://dx.doi.org/10.5402/2012/789324
[3] Esper, A., Muhlbauer, W. (1998). Solar drying – an effective means of food preservation. Renew Energy 15(1-4): 95-100. https://doi.org/10.1016/S0960-1481(98)00143-8
[4] Ahmad, F., Kamaruzzaman, S., Mohammad, H.Y., Mohd, H.R., Mohamed, G., Hussein, A.K. (2014). Performance analysis of solar drying system for red chili. Sol. Energy, 99: 47–54. https://doi.org/10.1016/j.solener.2013.10.019
[5] Bahloul, N., Boudhrioua, N., Kouhila, M., Kechaou, B., (2009). Effect of convective solar drying on colour, total phenols and radical scavenging activity of olive leaves (Olea europaea L.). International Journal Food Science & Technology, 44(12): 2561-2567. https://doi.org/10.1111/j.1365-2621.2009.02084.x
[6] Banout, J., Havlik, J., Kulik, M., Kloucek, P., Lojka, B. (2010). Effect of solar drying on the composition of essential oil of Sacha Culantro (Eryngium Foetidum L.) grown in the Peruvian Amazon. Journal of Food Process Engineering, 33(1): 83–103. https://doi.org/10.1111/j.1745-4530.2008.00261.x
[7] Yassen, T.A., Al-Kayiem, H.H. (2016). Experimental investigation and evaluation of hybrid solar/termal dryer combined with supplementary recovery dryer. Solar Energy, 134: 284–293. https://doi.org/10.1016/j.solener.2016.05.011
[8] Leon, M.A., Kumar, S. (2008). Design and performance evaluation of a solar assisted biomass drying system with thermal storage. Drying Technology, 26(7): 936–947. https://doi.org/10.1080/07373930802142812
[9] Abdullah, K. (1997). Drying of vanilla pods using a greenhouse effect solar dryer. Drying Technology, 15(2): 685-698. https://doi.org/10.1080/07373939708917254
[10] Bechoff, A., Dufour, D., Dhuique-Mayer, C., Marouzé, C., Reynes, M., Westby, A. (2009). Effect of hot air, solar and sun drying treatments on provitamin a retention in orange-fleshed sweet potato. Journal of Food Engineering, 92(2): 164–171. https://doi.org/10.1016/j.jfoodeng.2008.10.034
[11] Hii, C.L., Abdul Rahman, R., Jinap, S., Che Man, Y.B. (2006). Quality of cocoa beans dried using a direct solar dryer at different loadings. Journal of the Science Food and Agriculture, 86: 1237-1243. https://doi.org/10.1002/jsfa
[12] Fadhel, M.I., Sopian, K., Daud, W.R.W., Alghoul, M.A. (2010). Performance analysis of solar-assisted chemical heat-pump dryer. Solar Energy 84(11): 1920–1928. https://doi.org/10.1016/j.solener.2010.07.001
[13] Li, Y., Li, H.F., Dai, Y.Y., Gao, S.F., Wei, L., Li, Z.L., Odinez, I.G., Wang, R.Z. (2011). Experimental investigation on a solar assisted heat pump in-store drying system. Applied Thermal Engineering, 31(10): 1718–1724. https://doi.org/10.1016/j.applthermaleng.2011.02.014
[14] Jairaj, K.S., Singh, S.P., Srikant, K. (2009). A review of solar dryers developed for grape drying. Solar Energy, 83(9): 1698–1712. https://doi.org/10.1016/j.solener.2009.06.008
[15] Chabane, F., Moummi, N., Benramache, S., Bensahal, D., Belahssen, O. (2013). Collector efficiency by single pass of solar air heaters with and without using fins. Engineering Journal, 17(3): 44-53. https://doi.org/10.4186/ej.2013.17.3.43
[16] Chabane, F., Moummi, N., Benramache, S. (2014). Heat transfer and energy analysis of a solar air collector with smooth plate. The European Physical Journal Applied Physics, 66(1): 10901. https://doi.org/10.1051/epjap/2014130405
[17] Chabane, F., Hatraf, N., Moummi, N. (2014). Experimental study of heat transfer coefficient with rectangular baffle fin of solar air heater. Frontiers in Energy, 8(2): 160-172. https://doi.org/10.1007/s11708-014-0321-y
[18] Chabane, F., Moummi, N., Bensahal, D., Brima, A. (2014). Heat transfer coefficient and thermal losses of solar collector and Nusselt number correlation for rectangular solar air heater duct with longitudinal fins hold under the absorber plate. Applied Solar Energy, 50(1): 19-26. https://doi.org/10.3103/S0003701X14010046
[19] Chabane, F., Moummi, N., Benramache, S. (2014). Experimental study of heat transfer and thermal performance with longitudinal fins of solar air heater. Journal of Advanced Research, 5(2): 183-192. https://doi.org/10.1016/j.jare.2013.03.001
[20] Chabane, F., Moummi, N., Brima, A., Benramache, S. (2013). Thermal efficiency analysis of a single-flow solar air heater with different mass flow rates in a smooth plate. Frontiers in Heat and Mass Transfer, 4(1). https://doi.org/10.5098/hmt.v4.1.3006
[21] Chabane, F., Khadraoui, Z., Bensahal, D. (2013). Prediction of global solar radiation on the horizontal area with the effect of ambient temperature Part: II. TECNICA ITALIANA-Italian Journal of Engineering Science, 63(1): 73-77. https://doi.org/10.18280/ti-ijes.630110
[22] Chabane, F., Moummi, N., Benramache, S. (2013). Experimental analysis on thermal performance of a solar air collector with longitudinal fins in a region of Biskra, Algeria. Journal of Power Technologies, 93(1): 52-58.
[23] Chabane, F., Sekseff, E. (2018). Solar air collectors with doubles glazed by different distances in support of mass flow. Instrumentation, Mesure, Metrologie, 17(1): 37-53. https://doi.org/10.3166//I2M.17.37-53
[24] Chabane, F., Moummi, N., Brima, A. (2018). Estimation of Ultraviolet A (315–400 nm) and Ultraviolet B (280–315 nm) on region of Biskra. Instrumentation, Mesure, Metrologie, 17(2): 193-204. https://doi.org/10.3166/i2m.17.193-204
[25] Chabane, F., Laznek, I., Bensaha, D. (2018). Prediction of global solar radiation on the horizontal area with the effect of relative humidity part: I. TECNICA ITALIANA: Italian Journal of Engineering Science, 62(2): 115-118.
[26] Chabane, F., Moummi, N., Benramache, S. (2012). Effect of the tilt angle of natural convection in a solar collector with internal longitudinal fins. International Journal of Science and Engineering Investigations, 1(7): 13-17.
[27] Ayensu, A. (1997). Dehydration of food crops using a solar dryer with convective heat flow. Solar Energy, 59(4-6): 121-126. https://doi.org/10.1016/S0038-092X(96)00130-2
[28] Doymaz, I. (2004). Drying kinetics of white mulberry. Journal of Food Engineering, 61(3): 341-346. https://doi.org/10.1016/S0260-8774(03)00138-9
[29] Rahman, M.S., Perera, C.O., Thebaud, C. (1998). Desorption isotherm and heat pump drying kinetics of peas. Food Research International, 30(7): 485-491. https://doi.org/10.1016/S0963-9969(98)00009-X
[30] Lahsasni, S., Kouhila, M., Mahrouz, M., Jaouhari, J.T. (2004). Drying kinetics of prickly pear fruit (Opuntica ficus indica). Journal of Food Engineering, 61(2): 173-179. https://doi.org/10.1016/S0260-8774(03)00084-0
[31] Dandamrongrak, R., Young, G., Mason, R. (2002). Evaluation of various pre-treatments for the dehydration of banana and selection of suitable drying models. Journal of Food Engineering, 55(2): 139-146. https://doi.org/10.1016/S0260-8774(02)00028-6
[32] Hayaloglu, A.A., Karabulut, I., Alpaslan, M., Kelbaliyev, G. (2007). Mathematical modeling of drying characteristics of strained yoghurt in a convective type tray-dryer. Journal of Food Engineering, 78(1): 109-117. https://doi.org/10.1016/j.jfoodeng.2005.09.006
[33] Shanmugam, V., Natarajan, E. (2006). Experimental investigation of forced convection and desiccant integrated solar dryer. Renewable Energy, 31(8): 1239-1251. https://doi.org/10.1016/j.renene.2005.05.019
[34] Hossain, M.A., Bala, B.K. (2002). Thin layer drying characteristics for green chilli. Drying Technology, 20(2): 489–505. https://doi.org/10.1081/DRT-120002553
[35] Ullah, F., Kang, M., Khattak, M.K., Wahab, S. (2018). Retracted: Experimentally investigated the asparagus (Asparagus officinalis L.) drying with flat‐plate collector under the natural convection indirect solar dryer. Food Science & Nutrition, 6(6): 1357-1357. https://doi.org/10.1002/fsn3.603
[36] Prakash, S., Jha, S.K., Datta, N. (2004). Performance evaluation of blanched carrots dried by three different driers. Journal of Food Engineering, 62(3): 305-313. https://doi.org/10.1016/S0260-8774(03)00244-9
[37] Shamekhi-Amiri, S., Gorji, T.B., Gorji-Bandpy, M., Jahanshahi, M. (2018). Drying behaviour of lemon balm leaves in an indirect double-pass packed bed forced convection solar dryer system. Case Studies in Thermal Engineering, 12: 677-686. https://doi.org/10.1016/j.csite.2018.08.007