Siddharaj V. Kumbhar*| Basgonda K. Sonage
© 2019 IIETA. This article is published by IIETA and is licensed under the CC BY 4.0 license (http://creativecommons.org/licenses/by/4.0/).
OPEN ACCESS
The purity of water has become a very important aspect now-a-days by virtue of diminishing and polluted fresh water sources and increased ground water contamination levels due to arsenics and fluorides. Whilst many technological solutions of purification being invented; the most effective and cheapest method worldwide is only been – distillation, which yields about 99-99.7 % pure water. Solar distillation is the best way in terms of availability of energy, as solar energy is freely available throughout the year. But the other distillation processes require high energy to be produced by either burning fuel or at the expense of electricity. Thus solar distills are better than any other means. Over the years, the efficiency of solar stills has been reached to 32-35% and rate of distillate to 2-2.5 litres. An effort has been made for the improvement in design of stills by incorporating the reflectors and phase change material (PCM) for energy storage. The experimental investigations proved that the efficiency of the solar still raised up to 42 % and rate of distillate to 4 litres.
distillate, efficiency, PCM, reflectors, solar still
The need of pure water for drinking purpose is increasing day by day; as the available natural resources of fresh water are extinguishing very fast. Also the release of effluents by the industries and the local pollution of water of the rivers, lakes have made the available water non-potable. Kumbhar S.V. [1] said, due to the over extraction of water from ground has caused stress on increase in ground water contamination levels due arsenics and fluorides, which health hazards are leading to cancer and fluorosis. Therefore it becomes necessary to purify the water and make it potable to avoid such health hazards. For this the best method of purification is Solar Distillation which is cheap and most effective of all the existing technologies. Kumbhar S.V. et al. [2] discussed that the efficiency of the Solar Stills can be increased by the use PCM, which also increases the productivity of stills overnights. By implementing new designs features like PCM and reflectors, the black painting of the basin leads to increment in efficiency and productivity of the stills. The development of solar stills gives the opportunity to manage the scarcity of pure water, from the existing and more or less polluted and contaminated sources of ground water and flowing water [1-2].
Tiwari A.K. et al. [3] showed that maximum yield and efficiency of still is attained for lowest possible depth of water. Also it is proved that yield is maximum for 15° and 45° glass cover angles which efficiency is maximum (21.93 %) for 15° cover angle.
Khalifa A.J.N. [4] discussed on the effect of cover tilt angle on productivity of solar still as per different seasons and latitude. It suggests having large cover tilt in winter and small in summer with optimum cover tilt nearer to latitude angle of the location.
Elango T. et al. [5] discussed on the effect of the water depth on the productivity of solar stills. It is shown that output is high for lower depths of water for both single and double basin stills. Also insulating the basins increases the output of the stills than un-insulated conditions of basin.
The study of Phadatare M.K. et al. [6] discusses the effect of water depth on the internal heat and mass transfer in a single basin single slope plastic solar still. Internal heat and mass transfer and productivity of the still are determined for varying depth of water in the basin (2-12 cm). The maximum distillate output of 2.1 L/m2/day was obtained with water depth in still basin 2 cm. The maximum efficiency of the experimental still varies from 10% to 34%. The results indicated that with increase in depth of basin water, still productivity decreases.
The effect of water depth on the internal heat and mass transfer in the single basin double slope (DS) solar still is studied [7]. The effect of Environmental factors is by virtue of temperature, solar intensity and wind speed. Operational parameters comprise of feed water quantity, water depth and orientation of still.
Leinhard et al. [8] discussed on the performance of the solar stills can be improved by increasing energy input and evaporative surface area, and lowering condenser surface temperature.
The effect of energy storage material on performance of solar still is studied [9]. The phase change material (PCM) as the thermal energy storage medium is applied to solar still to enhance the energy storage capacity of the solar still in present study. The paraffin wax with melting point 68oC is used as the PCM.
Prakash P. et al. [10] discussed various approaches on the parameters influencing the productivity of the solar stills. For improving productivity, the factors such as area of absorption, minimum depth of water, inlet water temperature, glass cover temperature, etc. are important. The factors such as heat storage capacity, use of PCM, vacuum technology, reflectors, and condensers play equivalent role in enhancing productivity. It is found that productivity is directly proportional to area of absorption and water - glass cover temperature difference (Tw – Tg). Also the basin water depth affects the rate of productivity quite largely. The productivity of still increases, if water depth in still is maintained minimum.
The effect of use of phase change material in basin of solar still is studied which shows increase in productivity by 12.7 %. The energy efficiency of solar still increases by 12.42 % when Lauric acid PCM is used [11]. The maximum temperature attained in solar still is 65 ℃ for 10 litres water in basin. The efficiency of this still with reflector is found to be 26.67 %. Use of reflectors with still increases the efficiency by 14.2 % [12]. The productivity of still is found to increase by 30-35 % with the use of Zinc Nitrate Hexahydrate – PCM [13].
Shukla S. K. [14] developed a solar still with myristic acid phase change material which stores latent heat, so this system can be used to increase the productivity at night. The use of integrated condenser reduces glass cover temperature which increases the productivity.
The present research work deals with development of double slope solar still incorporated with reflectors and PCM. Due to this increment in efficiency and rate of distillate can be achieved [15].
2.1 Objectives and considerations
i. For high efficiency, the solar still should maintain
a) A high feed (impure) water temperature
b) Significant temperature gradient of feed water and condensing surface
c) Least possible vapour leakage.
ii. A high feed water temperature can be achieved if
a) Feed water absorbs higher proportion of solar radiation. For this, low absorptivity and high transmissivity glass is required.
b) Heat losses from the bottom and walls are kept low.
c) Proper ceramic wool insulation from all sides of basin.
iii. A large temperature difference can be achieved if
a) The condensing surface absorbs little or none of the incoming radiation.
b) Heat dissipated by condensing water on condensing surface is convected by another media.
2.2 Existing design approaches
i. Function Based
Solar still may be classified into two types as follows
A) Passive solar still B) Active solar Still
A) Passive solar still
In passive solar stills the absorptivity of feed water is increased by using charcoal or other amorphous powders or dyes. The depth of water in the basin is decided on the basis of thermal capacity of the still. Also vapour tightness is assured by using rubber or gravel. Using reflective side walls and good insulation ensures minimum heat loss.
B) Active solar still
In active stills, to increase the rate of evaporation, the waste heat recovery or an additional collector is used to heat the water in basin. Also a vacuum may be maintained inside the still or glass cover may be cooled externally to increase the temperature gradient.
ii. Basin Types
1. Single-basin stills
A single basin of solar still has a thin layer of water, a transparent glass cover that covers the basin and channel for collecting the distillate water from solar still. The sunrays pass through high transmissivity glass cover and reach the basin surface through the feed water. The basin and the water get heated by this solar radiation. In a solar still, high temperature gradient between vapours and glass cover yields pure water at a higher rate. This enhances rate of evaporation from water surface in basin up to glass cover. Vapours travel towards glass surface due to pressure difference and condense on it. The distillate (condensate water) is collected through the adjoining channels. Efficiency of single basin type solar still is 15 % - 25 % typically.
2. Multiple basin stills
It has two or more compartments. The vapours in lower compartment condense on its upper compartment bottom surface. This heat is absorbed by upper compartment to vaporize the water further in that compartment, at higher rate. Efficiency of this still is higher about 35% than single basin still with increased cost and complexity of the system.
3. Wick still
In this type of still, feed water is passed through a porous pad which is capable of absorbing radiations, known as wick. These have a feature of tilting the wick so as to reduce reflections and avail larger effective area for solar insolation. Also water is heated at a faster rate due lower feed water depth in the still. Wick stills are more effective than the basin ones due to reduced cost for same output.
2.2.1 Remarks from approaches
From above approaches following can be concluded
Thermal losses are mostly in form of conduction and convection and very little by radiation- owing to low temperature. So we can assume radiation losses can be negligible.
2.2.2 Some problems with solar stills which would reduce their efficiency
Disturbance of reflector due heavy winds or rains causing angular misalignments
2.3 Aspects of manufacturing still
The cover can be either glass or plastic. Glass is preferable to plastic because most of the time in the long term due to ultra violet light from sunlight and because it is more difficult for water to condense onto it. Tempered low-iron glass is the best material to use because it is highly transparent and not easily damaged. To make it low cost affair, normal plain window glass of 4-6 mm thickness may be used. A high grade transparent polyethylene may be used for temporary application. Stills with a double sloping cover with the back made from an insulating material do not suffer from a very low angle cover plate at the back reflecting sunlight and thus reducing efficiency. It is important for greater efficiency that the water condenses on the channel as a film rather than as droplets, which tend to drop back into the saline water. For this reason the channel is set at an angle of 10° to 30°.
2.4 Design methodology
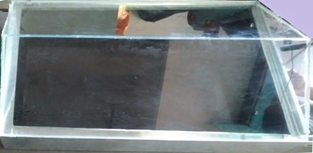
The design methodology of the project involves designing symmetrical solar still as per the output requirements. The solar still is designed for an estimated output of around 2 litres. In addition to it, an external reflector and PCM has been used to increase the output efficiency. Figure 1 shows the actual setup of “Double Slope Solar Still”.
Figure 1. Actual setup of double slope solar still
2.4.1 Base area
Estimation of base area is required for determining the quantum of incident solar radiation necessary for producing the desired output. With a desired output of 2 litres of water, the amount of solar energy required can be calculated as
$M_{w}=\frac{Q_{r e q}}{\text {Latent Heat of vaporiazation}}$ (1)
By calculation, $Q_{r e q}$ is 4520 $\mathrm{kJ}$
Now, in order to calculate the amount of incident solar energy $\left(Q_{\text {incident}}\right)$ it is needed to analyze the data of the average amount of solar energy incident in Solapur every month. The average solar energy received in Solapur throughout the year is 5.33 $\mathrm{kWhr} / \mathrm{m}^{2} / \mathrm{day}$
$\mathrm{I}=$ Average solar incident radiation for Solapur region
$\mathrm{I}=553 \mathrm{W} / \mathrm{m}^{2}$
Generally glass transmits 80 % of light through it. Let us consider 70 % of solar rays incident are utilized.
$Q_{\text {available}}=\tau_{\text {glass}} \cdot I$ (2)
By calculation, Q available is 387.1 $\mathrm{W} / \mathrm{m}^{2}$.
Thus, $Q_{\text {incident}}=Q_{\text {req}}$
Therefore, area required to get 4520 $\mathrm{kJ}$ is $Q_{\text {req}} / Q$ available.
Assuming that the system works 6 $\mathrm{hrs} / \mathrm{day}$
$Q_{\text {available}}$ is 7166.88 $\mathrm{kJ} / \mathrm{m}^{2}$;
Area required is 0.63 $\mathrm{m}^{2}$.
2.4.2 Reflector
In order to increase the incident solar radiation into the still, the external reflectors are incorporated. Due to this evaporation rate is increased. The additional amount of solar energy incident on the solar still, due to the external reflector can be calculated as follows.
Considering 4000 kJ of excess energy is available, area of reflector required to obtain this energy.
We get average solar incident radiation for Solapur region is 553 $\mathrm{W} / \mathrm{m}^{2} .$
$Q_{\text {req}}=\tau_{\text {glass}} \times A_{\text {reflector}} \times I$ (3)
By calculation, Qreq is 387.1 $\mathrm{W}$.
2.4.3 Phase Change Material (PCM)
For 1 kg pure water, additional 2600 kJ energy is needed. To store 2600 kJ energy in storage material i.e. paraffin wax we need
$Q=\left\{m \times C_{p}\left(T_{\text {melting}}-T_{\text {ambient}}\right)\right\}_{\text {solid}}+\left(m \times L_{h}\right)+\left\{m \times C_{p}\left(T_{\max }-T_{\text {melting}}\right)\right\}$ (4)
Then, we can carry the following calculation
$2600=\{m \times 2.14(55-30)\}+(m \times 215)+\{m \times 2.9(100-55)\}$
So, $m=6.5 \mathrm{kg}$
2.5 Specifications of solar still
Table 1. Specifications of solar still
|
Sr. No. |
Parameters |
Values |
|
1 |
Area of basin |
0.65 m2 |
|
2 |
Height of basin |
0.15 m2 |
|
3 |
Area of glass |
0.648 m2 |
|
4 |
Thickness of glass |
0.004 m |
|
5 |
Inclination of glass |
23° |
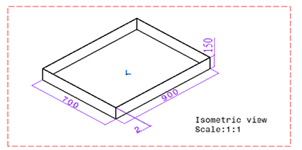
3.1 Basin (Figure 2)
Shape = Rectangular
Area = 0.9 m × 0.7 m
Height = 0.15 m
Material = G.I.
Specific heat of G.I. = 0.45 kJ/kg·K
Black spray painted base so as to increase the absorptivity
Figure 2. CAD model of basin
3.2 Transparent glass cover (Figure 3)
Thickness = 5 mm
Area = 720 mm×900 mm
Figure 3. Transparent glass cover
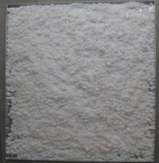
3.3 PCM (Phase Change Material) Tank (Figure 4&5)
Area of Tank = 0.9 m × 0.7 m
Thickness of Tank = 15 mm
PCM = Paraffin Wax (Organic)
Quantity = 6 kg
Figure 4. Phase change material tank
Figure 5. Paraffin wax
Table 2. Properties of Paraffin Wax – PCM
|
Sr. No. |
Property |
Value |
|
1 |
Form and appearance |
White solid at room temperature |
|
2 |
Melting temperature |
55 °C |
|
3 |
Latent heat |
215 kJ/kg |
|
4 |
Specific heat |
2.14-2.9 kJ/kg·K |
3.4 Reflectors
Highly polished silver coated mirrors are used for high reflectivity of ~ 0.99; so as to transmit maximum amount of radiation to the basin. Total reflector area is 1.5 m2
3.5 Insulation material for basin
Material = Ceramic wool
Thickness = 50 mm
Density = 64 kg/m3
Thermal Conductivity = 0.25 W/m·K
The material selected ceramic wool is having very low thermal conductivity and hence heat losses are minimized to lowest possible extent. It is available in standard size of 50mm thickness. It is fitted in size of PCM tank on all sides.
4.1 Experimentations & results
Case-1: Still – Without reflector and without PCM tank
Sample 1 – Brackish Water (High contents of Sodium Carbonates – 40% soap solution)
Intensity of Solar Radiation I = 800 W/m2
Quantity of Sample = 6 kg
Atmospheric temperature = 30 °C
Table 3. Observations on 29th March 2017 from 10hrs to 16 hrs
|
Time (hours) |
Temperature of Basin water (°C) |
Temperature of Basin (°C) |
Glass Cover Temperature (°C) |
Distillate output (ml) |
|
|
Inside |
Outside |
||||
|
10 |
25 |
31 |
36 |
34 |
0 |
|
11 |
55 |
55 |
48 |
42 |
110 |
|
12 |
68 |
60 |
55 |
45 |
260 |
|
13 |
71 |
68 |
60 |
47 |
530 |
|
14 |
65 |
64 |
59 |
48 |
750 |
|
15 |
68 |
72 |
55 |
44 |
940 |
|
16 |
60 |
67 |
50 |
42 |
1070 |
Figure 6. Evolution of the temperature with time (Case-1)
It is observed from Figure 6 that initially temperature was 25 °C and the maximum temperature achieved during this process is 71 °C. Also it is observed that temperature of basin increases from 31 °C to 72 °C and after the sunset it slowly decreases.
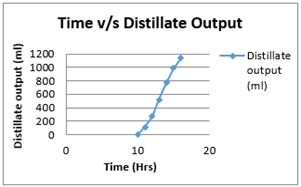
The graph (Figure 7) shows distillate output per hour and it is observed that during 12 hrs to 14 hrs distillate output is maximum and total collected distillate output is 1.07 litres in 6 hrs for 0.5 m2 incident area.
The efficiency of solar still is given by
$\eta=\frac{\sum M_{e w} \times L}{A_{g l a s s} \times I \times t} \times 100$ (5)
Therefore, $\eta$ is 27.98$\%$
Figure 7. Graph of Time v/s Distillate Output (Case-1)
Case-2: Still – Without reflector and without PCM tank
Sample 2 – Waste water of RO plant
Intensity of Solar Radiation I = 800 W/m2
Quantity of Sample = 6 kg
Atmospheric temperature = 32 °C
Table 4. Observations on 30th March 2017 from 10hrs to 16hrs
|
Time (hours) |
Temperature of Basin water (°C) |
Temperature of Basin (°C) |
Glass Cover Temperature (°C) |
Distillate output (ml) |
|
|
Inside |
Outside |
||||
|
10 |
30 |
32 |
36 |
32 |
0 |
|
11 |
53 |
56 |
50 |
39 |
110 |
|
12 |
58 |
60 |
57 |
41 |
270 |
|
13 |
55 |
58 |
56 |
46 |
520 |
|
14 |
56 |
57 |
55 |
41 |
770 |
|
15 |
56 |
57 |
48 |
40 |
985 |
|
16 |
52 |
53 |
47 |
39 |
1135 |
Figure 8. Evolution of the temperature with time (Case-2)
The graph (Figure 8) show that as time goes on increasing, the temperature of the water in the basin also increases. It is observed that initially temperature was 30 °C and after an hour temperature reached is 53 °C and the maximum temperature achieved during this process is 58 °C. Also it is observed that the temperature of basin is increasing from 30 °C to 60 °C and after the sunset it is slowly decreasing. From the graph, it is also observed that inside surface temperature of glass is maximum and that of outside surface of glass is minimum.
The graph (Figure 9) shows distillate output per hour and it is observed that during 12 hrs to 16 hrs distillate output is maximum and total collected distillate output is 1.135 litres in 6 hrs for 0.5 m2 incident area.
The efficiency of solar still is given by
$\eta=\frac{\sum M_{e w} \times L}{A_{g l a s s} \times I \times t} \times 100$ (6)
By calculation, η is 29.38 %.
Case-3: Still – With reflector and without PCM
Sample 1 – Brackish Water (High contents of Sodium Carbonates – 40 % soap solution)
Intensity of Solar Radiation I = 800 W/m2
Quantity of Sample = 6 kg
Atmospheric temperature = 32 °C
Table 5. Observations on 2nd April 2017 from 10hrs to 16 hrs
|
Time (hours) |
Temperature of Basin water (°C) |
Temperature of Basin(°C) |
Glass Cover Temperature (°C) |
Distillate output (ml) |
|
|
Inside |
Outside |
||||
|
10 |
30 |
32 |
30 |
32 |
0 |
|
11 |
61 |
64 |
57 |
36 |
56 |
|
12 |
68 |
70 |
69 |
47 |
371 |
|
13 |
68 |
72 |
61 |
46 |
610 |
|
14 |
69 |
74 |
64 |
42 |
859 |
|
15 |
61 |
63 |
60 |
42 |
1108 |
|
16 |
59 |
60 |
59 |
40 |
1260 |
Figure 10. Evolution of the temperature with time (Case-3)
It is observed from Figure 10 that initially temperature is 30 °C and the maximum temperature achieved during this process is 69 °C. Also it is observed that temperature of basin is increasing from 32 °C to 74 °C. Because of mounting the reflector, the distillate output is maximum.
The graph (Figure 11) shows distillate output per hour and it is observed that during 13 hrs to 16 hrs distillate output is maximum and total collected distillate output is 1.26 litres in 6 hrs for 0.5 m2 incident area.
The efficiency of solar still is given by
$\eta=\frac{\sum M_{e w} \times L}{A_{g l a s s} \times I \times t} \times 100$ (7)
Figure 11. Graph of Time v/s Distillate Output (Case-3)
Case-4: Still – With reflector and without PCM
Sample 2 – Waste water of RO plant
Intensity of Solar Radiation I = 800 W/m2
Quantity of Sample = 6 kg
Atmospheric temperature = 32°C
Table 6. Observations on 3rd April 2017 from 10hrs to 16 hrs
|
Time (hours) |
Temperature of Basin water (°C) |
Temperature of Basin(°C) |
Glass Cover Temperature (°C) |
Distillate output (ml) |
|
|
Inside |
Outside |
||||
|
10 |
30 |
31 |
30 |
33 |
0 |
|
11 |
58 |
62 |
55 |
37 |
100 |
|
12 |
65 |
69 |
67 |
45 |
330 |
|
13 |
74 |
74 |
68 |
46 |
615 |
|
14 |
69 |
70 |
61 |
44 |
880 |
|
15 |
62 |
64 |
59 |
43 |
1105 |
|
16 |
60 |
61 |
58 |
42 |
1255 |
It is observed in Figure 12 that initially temperature is 30 °C and the maximum temperature achieved during this process is 74 °C. Also it is observed that temperature of basin is increasing from 31 °C to 74 °C.
The graph (Figure 13) shows distillate output per hour and it is observed that during 13 hrs to 16 hrs distillate output is maximum and total collected distillate output is 1.25 litres in 6 hrs for 0.5 m2 incident area.
The efficiency of solar still is given by
$\eta=\frac{\sum M_{e w} \times L}{A_{g l a s s} \times I \times t} \times 100$ (8)
By this formula, η is calculated to be 32.69 %.
Case-5: Still – With reflector and with PCM
Sample 1 – Brackish Water (High contents of Sodium Carbonates – 40 % soap solution)
Intensity of Solar Radiation I = 800 W/m2
Quantity of Sample = 6 kg
Atmospheric temperature = 32 °C
Figure 12. Evolution of the temperature with time (Case-4)
Figure 13. Graph of Time v/s Distillate Output (Case-4)
Table 7. Observations on 4th April 2017 from 10hrs to 19:30 hrs
|
Time (hours) |
Temperature of Basin water (°C) |
Temperature of Basin(°C) |
Glass Cover Temperature (°C) |
Distillate output (ml) |
Wax Temperature (°C) |
|
|
Inside |
Outside |
|||||
|
10.30 |
30 |
32 |
31 |
32 |
0 |
32 |
|
11.30 |
62 |
64 |
57 |
36 |
160 |
57 |
|
12.30 |
72 |
74 |
68 |
47 |
460 |
71 |
|
13.30 |
67 |
70 |
62 |
43 |
780 |
74 |
|
14.30 |
60 |
65 |
54 |
42 |
920 |
77 |
|
15.30 |
62 |
59 |
54 |
39 |
1130 |
60 |
|
16.30 |
61 |
65 |
53 |
42 |
1350 |
60 |
|
17.30 |
55 |
63 |
48 |
38 |
1480 |
59 |
|
18.30 |
51 |
52 |
40 |
37 |
1540 |
54 |
|
19.30 |
48 |
50 |
35 |
34 |
1580 |
52 |
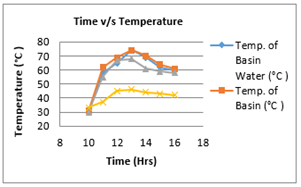
It is observed in Figure 14 that initially temperature is 30 °C and the maximum temperature achieved during this process is 72 °C. Also it is observed that temperature of basin is increasing from 32 °C to 74 °C.
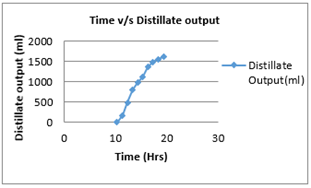
The graph (Figure 15) shows distillate output per hour and it is observed that during 9 hrs to 13 hrs distillate output is maximum and total collected distillate output is 1.58 litres in 9 hrs for 0.5 m2 incident area. From 13 hrs to 17 hrs, the distillate output doubles to about 4 litres. Also in this case, the working time of solar still increases from 16 hrs to 19:30 hrs because of incorporating the PCM, which stores the excess energy available at peak time and discharges back to still water during sunset when solar intensity is low and thus maintains the efficient working of the still.
Figure 14. Evolution of the temperature with time (Case-5)
Figure 15. Graph of Time v/s Distillate Output (Case-5)
Actual efficiency
Maximum temperature reached by paraffin wax is 77 °C, so total energy stored in paraffin wax is given by
$Q=\left\{m \cdot C_{p} \cdot\left(T_{\text {melting}}-T_{\text {ambient}}\right)\right\}_{\text {solid}}+\left(m \cdot L_{h}\right)+\left\{m \cdot C_{p} \cdot\left(T_{\max }-\right.\right.T_{\text {melting}} ) \}$liquid (9)
Efficiency of solar still using energy storage material is given by
$\eta=\frac{\sum M_{e w} \times L}{\left(A_{g l a s s} \times I \times t\right)+Q} \times 100$ (10)
By calculation, Q = 6.5 × 2.14 × (55-30) + 6.5 × 215 + 6.5 × 2.9 × (77-55) = 2159.95 kJ; η is 41.31%.
Case-6: Still – With reflector and with PCM
Sample 2 – Waste water of RO plant
Intensity of Solar Radiation I = 800 W/m2
Quantity of Sample = 6 kg
Atmospheric temperature = 32 °C
It is observed in Fig.16 that initially temperature is 32 °C and after an hour temperature is 52 °C and the maximum temperature achieved during this process is 73 °C. Also it is observed that temperature of basin is increasing from 33 °C to 71 °C.
The graph (Figure 17) shows distillate output per hour and it is observed that during 9 hrs to 13 hrs distillate output is maximum and total collected distillate output is 1.61 litres in 9 hrs for 0.5 m2 incident area.
From 13 hrs to 17 hrs, the distillate output doubles to about 3.3 litres.
Table 8. Observations on 5th April 2017 from 10hrs to 19:30 hrs
|
Time (hours) |
Temperature of Basin water (°C) |
Temperature of Basin (°C) |
Glass Cover Temperature (°C) |
Distillate output (ml) |
Wax Temperature °C) |
|
|
Inside |
Outside |
|||||
|
10.30 |
32 |
33 |
30 |
32 |
0 |
32 |
|
11.30 |
63 |
64 |
58 |
35 |
165 |
58 |
|
12.30 |
71 |
73 |
68 |
45 |
482 |
72 |
|
13.30 |
73 |
71 |
63 |
44 |
800 |
74 |
|
14.30 |
65 |
68 |
58 |
42 |
980 |
77 |
|
15.30 |
62 |
64 |
54 |
39 |
1120 |
76 |
|
16.30 |
65 |
70 |
56 |
42 |
1365 |
61 |
|
17.30 |
55 |
64 |
50 |
41 |
1490 |
60 |
|
18.30 |
54 |
52 |
40 |
35 |
1560 |
59 |
|
19.30 |
51 |
50 |
38 |
34 |
1610 |
55 |
Figure 16. Evolution of the temperature with time (Case-6)
Figure 17. Graph of Time v/s Distillate output (Case-6)
Actual efficiency
Maximum temperature reached by paraffin wax is 77°C, so total energy stored in paraffin wax is given by
Q = {m·Cp·(Tmelting- Tambient)}solid+ (m·Lh) + {m·Cp·(Tmax- Tmelting)}liquid TERGENT n Waxll Title Page No. (11)
$\eta=\frac{\sum M_{e w} \times L}{\left(A_{g l a s s} \times I \times t\right)+Q} \times 100$ (12)
By calculation, Q = 6.5 × 2.14 × (55-30) + 6.5 × 215 + 6.5 × 2.9 × (77-55) = 2159.95 kJ; η is 42.10%.
4.2 Testing reports of distilled water
The water samples selected for testing purposes i.e. Sample 1 and Sample 2 above cases1 to 6, are based on using very high TDS water which is obtained from waste water of washing clothes, utensils and that of RO plant, which is to be recycled. Distillation is the only method in which such waste water can be recycled with greatest efficiency i.e. the distilled water will not contain any TDS as only pure water is evaporated from the brackish water.
4.2.1 Results of Sample 1 – Brackish Water (High contents of Sodium Carbonates – 40 % soap solution)
Table 9. Results of distilled water analysis (sample 1)
|
Sr. No. |
Test |
Brackish Water |
Result of Distillate Brackish Water |
Acceptable limit |
|
1 |
pH |
8.3 |
7.1 |
6.5-8.5
|
|
2 |
Alkalinity (mg/l) |
172 |
120 |
200 |
|
3 |
Hardness (mg/l) |
236 |
160 |
200 |
|
4 |
Chlorides (mg/l) |
278 |
206 |
250 |
|
5 |
Turbidity (NTU) |
3.8 |
0.1 |
1 |
|
6 |
Total Dissolved Solids (mg/l) |
780 |
250 |
500 |
Figure 18. Water filled in Still (Sample 1), Before Purification
Figure 19. Water filled in Still (Sample 1), After Purification
4.2.2 Results of Sample 2 – Waste water of RO plant
Table 10. Results of distilled water analysis (Sample 2)
|
Sr. No. |
Test |
RO plant waste water |
Result of Distillate RO plant waste water |
Acceptable limit |
|
1 |
pH |
7.82 |
7.3 |
6.5-8.5 |
|
2 |
Alkalinity (mg/l) |
166 |
168 |
200 |
|
3 |
Hardness (mg/l) |
178 |
166 |
200 |
|
4 |
Chlorides (mg/l) |
235 |
228 |
250 |
|
5 |
Turbidity (NTU) |
1.1 |
0.6 |
1 |
|
6 |
Total Dissolved Solids (mg/l) |
420 |
260 |
500 |
Figure 20. Water filled in Still (Sample 2), Before Purification
Figure 21. Water filled in Still (Sample 2), After Purification
5.1 General
The efficiency of the designed solar still is found to be more than 42 % which tend to increase up to 46 % if it is operated under optimum conditions of temperature and effective cooling of glass cover; while in existing solar stills efficiency is about 32-35 % maximum.
In this work, the effect of simultaneous use of PCM on solar still is investigated and it is observed that efficiency is more when used with PCM.
The daylight productivity of distillate output is found to decrease slightly with increasing the mass of PCM but the overnight productivity is significantly increasing with increasing mass of PCM.
5.2 Effectiveness of solar still system
The designed area (0.63 m2) of solar still yields average 3-4 litres of pure water within 6-7 hours for 6 litres of brackish water filled in the reservoir; which is fairly high than the existing stills considering the given area of still. For area of about 1 m2 the yield increases up to 6-6.5 litres for the same period.
5.3 Efficiency of the still
The efficiency of solar still increased when used with external reflector and energy storage material. Addition of reflectors increases efficiency by 12.28 %. Addition of reflectors and PCM together, increases the efficiency by 40 % to existing efficiency of about 32%.
|
Q_req |
heat required, W |
|
τ_glass |
transmissivity |
|
A I |
area, m2 incident radiation , W.m-2 |
|
m Cp T Lh η Mew |
mass of water, kg specific heat, J.kg-1.K-1 temperature, oC latent heat, J.kg-1.K-1 efficiency, % mass of evaporated water, kg |
[1] Kumbhar, S.V. (2017). Status of groundwater contamination and health hazards due to arsenic and fluorides: A review. International Journal of Water Resources, 3(1): 1-4.
[2] Kumbhar, S.V., Sonage, B.K. (2017). Adaptation and implementation of solar distillation plants for pure water: A review. Journal of Water Pollution & Purification Research, 4(1): 1-3.
[3] Tiwari, A.K., Tiwari, G.N. (2008). Effect of cover inclination and water depth on performance of a solar still for Indian climatic conditions. Journal of Solar Energy Engineering, 130(2): 024502. https://doi.org/10.1115/1.2844450
[4] Khalifa, A.J.N. (2011). On the effect of cover tilt angle of the simple solar still on its productivity in different seasons and latitudes. Energy Conversion and Management, 52(1): 431–436. https://doi.org/10.1016/j.enconman.2010.07.018
[5] Elango, T., Murugavel, K.K. (2015). The effect of the water depth on the productivity for single and double basin double slope glass solar stills. Desalination, 359: 82–91. https://doi.org/10.1016/j.desal.2014.12.036
[6] Phadatare, M.K., Verma, S.K. (2007). Influence of water depth on internal heat and mass transfer in a plastic solar still. Desalination, 217(1-3): 267-275. https://doi.org/10.1016/j.desal.2007.03.006
[7] Rajamanickam, M.R., Ragupathy, A. (2011). Influence of water depth on internal heat and mass transfer in a double slope solar still. Energy Procedia, 14: 1701-1708. https://doi.org/10.1016/j.egypro.2011.12.1155
[8] Lienhard, J.H., Antar, M.A., Bilton, A., Blanco, J., Zaragoza, G. (2012). Chapter 9: Solar Desalination. Annual Review of Heat Transfer, Begell House, Inc., pp. 277-347.
[9] Hasan, F.M., Rai, A.K., Sachan, V., Omar, M.I. (2014). Experimental study of double slope solar still with energy storage medium. International Journal of Advanced Research in Engineering and Technology (IJARET), 5(3): 147-154.
[10] Prakash, P., Velmurugan, V. (2015). Parameters influencing the productivity of solar stills – a review. Renewable and Sustainable Energy Reviews, 49: 585-609. https://doi.org/10.1016/j.rser.2015.04.136
[11] Kumar, M., Rai, A.K. (2016). Performance study of a phase change material assisted solar still. International Journal of Advanced Research in Engineering and Technology (IJARET), 7(1): 60-67.
[12] Mathur, K., Thomas, M., Lineswala, P., Nayar, S. (2015). Solar distillation of water. International Research Journal of Engineering and Technology (IRJET), 2(7): 767-770.
[13] Rai, A.K., Sachan, V., Kumar, M. (2013). Experimental investigation of a double slope solar still with a latent heat storage medium. International Journal of Mechanical Engineering and Technology (IJMET), 4(1): 22-29.
[14] Shukla, S.K. (2014). Chapter 2: Application of Solar Distillation Systems with Phase Change Material Storage. Modern Mechanical Engineering, Materials Forming, Machining and Tribology, Springer-Verlag Berlin Heidelberg, pp. 15-42.
[15] Kumbhar, S.V. (2019). Double slope solar still distillate output data set for conventional still and still with or without reflectors and PCM using high TDS water samples. Data in Brief (DiB), 24: 103852. https://doi.org/10.1016/j.dib.2019.103852