OPEN ACCESS
The energy retrofit of social housing buildings in Italy is a big challenge, for their poor energy performance and their large diffusion, but it is affected by several problems mainly due to lack of funds. Therefore, a solid methodological base to achieve optimal energy levels, considering the best balance with the costs, can be useful for a cheaper approach to their energy performance improvement. The cost optimal methodology indicated by the European Directive 2010/31/UE is here applied on a social housing building, located in the northern Italy, in order to demonstrate how it can be used as a supporting decision tool for refurbishment interventions on existing residential buildings, when limited investments from Public Authorities or privates are involved. A series of energy efficiency measures are defined in order to identify different improvement scenarios, related both to the envelope and to the technical systems. After a first step calculating the primary energy consumption and the Global Cost in accordance with the EN 15459:2007, the best costs/benefits ratio is evaluated among all the hypothesized scenarios. The results of the research are expected to be a stimulus for the definition of specific refurbishment plans for the energy efficiency increase of social housing.
cost-optimal methodology, energy refurbishment, energy saving, social housing refurbishment
Italy is one of the most densely populated European regions. The final energy consumption is distributed among transports for 33%, industry with 31%; households and service sector combined represent 35% of the whole amount. The building sector represents a huge basin of opportunities to apply energy improvement criteria at a large scale. In the second half of the XX century, the largest amount of buildings was erected on the basis of common construction criteria characterized by poor attention to thermal insulation.
Some improvements were made in the following years: quite half of the residential buildings in Italy (48%) were subdued to renovation/modifications of the heating, hydraulic, electrical systems and/or to reconstruction of structural (external walls and roofs) and not structural (internal partitions, floors) building elements. Modifications were made on the buildings indistinctly, even if they were in good state of conservation.
The energy performance of the national building stock needs therefore a more organized improvement strategy. The most suitable target is the social housing building stock for its poor maintenance, efficiency and its large diffusion.
An example of the typical social housing development after the II World War can be represented by INA-Casa project (funds managed by the National Assurance Organization) characterized mainly by masonry walls or reinforced concrete grid closed by lighter walls depending on structural needs and not on energy performance considerations. Following this program, almost 355,000 dwellings were built all around Italy [1]. Due to the significant quantity of common constructive typologies, like the cited ones, characterised by low energy performance, spread in all the Italian territory, the energy retrofit of these buildings is an important opportunity to reduce primary energy consumptions in the residential sector. Moreover, the same refurbishment criteria may be not suitable for all the buildings, as they depend strongly on the climatic conditions. The outdoor conditions of northern-central-southern and insular Italy are significantly different each other and have therefore a great influence on the heating/cooling energy consumption.
From 1976, a national law (n.373) [2] started to put the attention on the energy saving in buildings. A second step in this direction was another law (n.10/91) [3] that determined higher attention to thermal insulation and energy efficiency of heating systems. The following steps were represented by the national adoption of the EPBD. While the first Directive (2002/91/EC) [4] was mainly focused on the energy efficiency target, the Directive 2010/31/EU [5] clearly specifies that energy efficiency must be applied looking at the cost-optimal level achievement indicating that “Member States shall take the necessary measures to ensure that minimum energy performance requirements for buildings or building units are set with a view to achieving cost-optimal levels” (article 4). Another important target fixed by the European Commission is that “after 31 December 2018 new buildings occupied and owned by public authorities must be nearly zero-energy buildings (nZEB)” (article 9). In Italy, with DM 26 June 2015 [6] new or existing buildings submitted to a relevant refurbishment have to reach nZEB target from 1st January 2019 for the public ones and from 1st January 2021 for all the others.
The aim of this study is to assess an energy retrofit intervention of an existing social housing building, belonging to a widely diffused category, in order to test a method established by the European Union that can be applied in real situations, with the nZEB target, to evaluate if the costs of the interventions can be optimized.
1.1 Relevant studies
The EPBD Recast [5] introduces two new concepts: cost optimal energy requirements and nearly-zero energy buildings. The first one is focused on the cost and the second one on the energy performance and the use of renewable energy. Ferreira et al. [7] try to find a correlation between these two concepts and demonstrate that it is possible to integrate them, by using renewable energy systems with the cost optimal levels of building’s envelope.
Dall’O’ et al. [8] study a methodology for the evaluation of the potentiality of energy saving measures for the residential stock renovation, underlining the relevance of retrofitting existing buildings, since approximately 60% of the buildings in Italy were built before the first national law regarding energy savings in buildings (Law 373/1976 [2]).
Often, in a new construction or retrofit intervention, the minimum legislative standards are respected with the lowest cost, without the evaluation of the life cycle cost of the building and its components [9]. Lo Cascio et al. [10] adopt a building retrofit prioritization process to define the most cost-effective intervention for a 7000 m2 residential Australian building; this approach assesses economically each Energy Conservation Measure, giving priority on the basis of the performance achieved in connection with economical indexes (Net Present Value, Internal Rate of Return, Profitability Index, Discounted Payback Period). Another procedure followed by many scientific authors is the cost-optimal methodology, consisting in the energy and economical assessment of energy refurbishment packages composed by several different measures combined together; this method follows the European Guidelines n.244/2012 [11].
Barthelems et al. [12] and Becchio et al. [13] describe a methodology to support designers and architects in the selection of the best scenario in cost optimal terms, both for a new project and for an energy retrofit project. Zacà et al. [14] develop a methodology to assess energy and cost effectiveness in new buildings located in the Mediterranean area and show how economical high efficient buildings can be obtained at a design stage for a warm climate. When the target is nZEB buildings, it is important to evaluate how much to invest in the envelope performance and in the renewable energy technologies [15]. One of the focus of this paper is to understand if lower consumption can compensate higher investment costs and which is the role of incentives in the cost optimal solution. Becchio et al. [16] analyze 40 economically and technically feasible energy efficiency measures for a high performing single family house. They demonstrate that, without proper financial subsides, net ZEB solutions are still far for being the cost optimal ones. In order to reach net zero balance solutions, the maximum level of PV panels plays a key role.
According to the EPDB [5], “cost-optimal level” means the energy performance level which leads to the lowest cost during the estimated economic lifecycle. The methodology provided by the European Regulation n.244/2012 [11] is addressed to Public Authorities and thus requires the individuation of representative buildings of the typical and average building stocks for which cost-optimal solutions suitable for the same buildings’ types are considered.
In addition to the macroeconomic analysis that this procedure carries on, it is possible to achieve financial analysis on a case study to which the same methodology can be applied, as well as in this research. The representative building assessed belongs to a widespread social housing typology of the period between the thirties and fifties of the XX century in Lombardy region and it can be individuated in all the northern Italy regions.
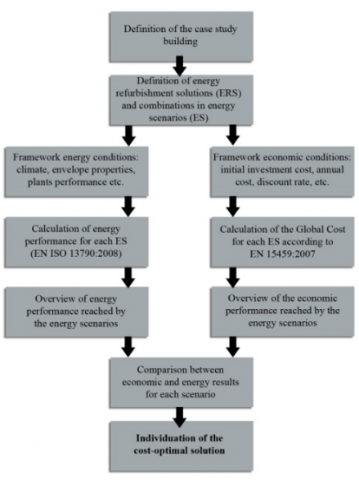
Figure 1. Cost-optimal methodology steps
Once selected the building to be studied, the steps are the following (Fig.1):
1) identification of improvement measures for building envelope and energy systems (Energy Solutions ES);
2) energy consumption and energy performance calculation of the building for each ES;
3) global cost calculation for each ES in terms of net actual value during the considered period, according to the methodology of EN15459:2007 [17];
4) energy and economic comparison between the different ES;
5) choice of the most appropriate solution in terms of energy and economic level and identification of the optimal levels of energy performance requirements in relation to the global costs.
2.1 Case study
The research is intended to test the methodology to find the best costs-benefits balance, mainly for the use by Public Authorities and, to this purpose, the methodology has been applied on an existing residential social building.
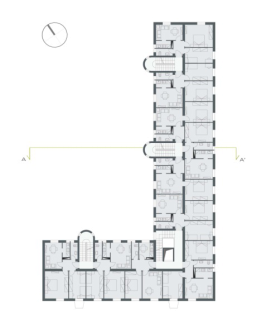
The construction presents a “L” floor plan and three stairwells protruding towards the inner court that distribute the 30 small size residential units for a total living net area equal to 1411.3 m2 distributed over three floors (Figure 2).
Figure 2. 3D-model of the case study building
The ground floor contains the cellars and the centralized thermal power station, where the traditional gas generator is located, delivering heating to all the flats through a not-insulated distribution network.
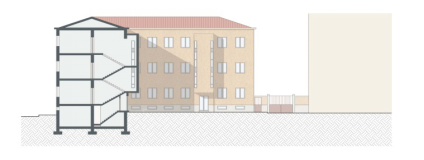
The elevations are marked by 130x150 cm openings (Figure 3), with the only exception of four French doors 130x240 cm.
Figure 3. Plan and section of the case study
The building presents the constructive connotations of the Fifties social housing, with internal net heights equal to 3.35 m, external walls of 40 cm thickness of solid bricks, pitched roof with not insulated and not conditioned attic; in Table 1 the current thermal transmittances and thicknesses of the existing envelope are reported. The primary energy consumption of the existing construction is evaluated in order to compare the results achieved with the energy refurbishments from the initial situation (Table 2).
The construction is located in an area with similar buildings and the studied solutions can be replicated in the whole district.
Table 1. Thermal transmittance and thickness of the existing building envelope elements
|
Envelope elements |
External walls |
Roof slab |
Ground slab |
Windows |
|
U S |
1.50 0.40 |
1.87 0.25 |
1.87 0.25 |
1.66 - |
Table 2. Primary energy and energy class of the existing building
|
Ep |
Primary Energy for heating |
Primary Energy for DHW |
Primary Energy for auxiliars |
Energy class |
|
246.06 |
328,452.35 |
18,811.52 |
13,649.52 |
G |
Figure 4. Picture of the case study
2.2 Energy Refurbishment Solutions (ERS)
According to the Guidelines n.244/2012 [11], the more packages and variations of the measures included in the assessed scenario are used, the more accurate the calculated optimum of the achievable performance will be, with a minimum of packages/variations set equal to 10. For this reason a series of refurbishment measures divided into envelope, plants and renewable plants were set and combined in order to establish 18 different scenarios to be assessed. The cost-optimal methodology recommends to combine measures into packages, since meaningful combinations can create synergy effects that lead to better results than single measures. Variants are defined as a “global result and description of a full set of measures/packages applied to a building that can be composed of a combination of measures on the building envelope, passive techniques, measures on building systems and/or measures based on renewable energy sources"[11]. For this reason, the variants in the case study have been divided into the three categories (envelope, plants and renewable sources), in order to create different combinations to be assessed.
The U-values, fixed for the envelope refurbishment, respect the limit values set by the Italian national decree 26/06/2015 [6] for the reference building. Three envelope configurations were defined: in ERS1 and ERS2 the limit values respectively for 2015 and 2019/2021 were considered, while ERS3 aims at the assessment of an energy efficiency measure overcoming the national limits (Table 3). In particular, the following actions for the envelope refurbishment were assessed:
- insulation of the ceiling slab towards the unconditioned roofspace: the choice was not to change the existing roof with a performing one but to insulate on the internal side of the roof, for a consistent economic saving. The insulating material used was glass wool of 0.14 m, 0.18 m and 0.22 m of thickness for ERS1, ERS2 and ERS3 respectively.
- Insulation of the floor above the unconditioned ground floor with EPS of 0.14 m, 0.15 m and 0.22 m of thickness for ERS1, ERS2 and ERS3 respectively.
- Insulation of external brick walls with EPS of 0.14 m, 0.18 m, 0.24 m of thickness for ERS1, ERS2 and ERS3 respectively.
- Replacement of windows with double-glazing (ERS1, ERS2) and triple-glazing (ERS3) windows, replacing the polystyrene-lined rolling shutter casing.
Table 3. Energy Refurbishment Solutions (ERS) for the building envelope
|
Envelope elements |
ERS1 |
ERS2 |
ERS3 |
|||
|
U |
S |
U |
S |
U |
S |
|
|
External Walls |
0.30 |
0.14 |
0.26 |
0.18 |
0.20 |
0.24 |
|
Roof Slab |
0.25 |
0.14 |
0.22 |
0.18 |
0.16 |
0.24 |
|
Ground slabs |
0.30 |
0.14 |
0.26 |
0.15 |
0.20 |
0.22 |
|
Windows |
1.80 |
1.36 |
1.00 |
|||
Since the limit values listed in the Table 3 are comprehensive of thermal bridges, the insulation thickness of the different elements (ceiling, floor, walls) was oversized in order to respect the decree [6].
The thermal plants combinations were determined choosing mostly or totally renewable heat generators with the double aim to reach a high energy efficiency class and to fulfill the renewable percentage that must be provided for heating, cooling and DHW, according to the Legislative Decree n. 28/2011 [18]. In case of significant renovations, the energy power plants must be designed to ensure, through the use of energy produced from plants powered by renewable sources, the covering of the 50% of the consumption planned for heating, cooling and hot water.
The adopted solutions for plants are:
- ERS4: Air to water heat pump combined with condensing boiler;
- ERS5: Geothermal heat-pump;
- ERS6: District heating connection;
- ERS7: Solar panels;
- ERS8: Solar and photovoltaic panels;
- ERS9: Solar and photovoltaic panels (33% photovoltaic panels reduction in comparison to ERS8).
The combination of the different energy refurbishment solutions thought for the envelope and the thermal plants brought to the formulation of 18 Energy Scenarios (ES, Table 4) to be assessed. In each scenario, radiant panels were chosen as emission system, since the operating temperature is low (30-35°C) and it is the optimal terminal device to be associated with heat pumps.
Table 4. Energy Scenarios (ES) and the corresponding Energy Refurbishment Solutions (ERS) considered
|
ES |
Envelope |
Plants |
Renewables |
|
1 |
ERS1 |
ERS4 |
ERS7 |
|
2 |
ERS1 |
ERS4 |
ERS8 |
|
3 |
ERS1 |
ERS5 |
ERS7 |
|
4 |
ERS1 |
ERS5 |
ERS8 |
|
5 |
ERS1 |
ERS6 |
ERS7 |
|
6 |
ERS1 |
ERS6 |
ERS8 |
|
7 |
ERS2 |
ERS4 |
ERS7 |
|
8 |
ERS2 |
ERS4 |
ERS8 |
|
9 |
ERS2 |
ERS5 |
ERS7 |
|
10 |
ERS2 |
ERS5 |
ERS8 |
|
11 |
ERS2 |
ERS6 |
ERS7 |
|
12 |
ERS2 |
ERS6 |
ERS8 |
|
13 |
ERS3 |
ERS4 |
ERS9 |
|
14 |
ERS3 |
ERS4 |
ERS8 |
|
15 |
ERS3 |
ERS5 |
ERS9 |
|
16 |
ERS3 |
ERS5 |
ERS8 |
|
17 |
ERS3 |
ERS6 |
ERS9 |
|
18 |
ERS3 |
ERS6 |
ERS8 |
2.3 Energy calculation
The energy model of the residential building has been built setting as climatic conditions the Italian climate zone “E” (2,404 Heating Degree Days), adopting the temperature and humidity data extracted from the national standard UNI 10349:2016 [19]. For the calculation of the energy needs, the monthly method has been employed, through a commercial software approved by the National Thermo-technical Committee, CTI [20]; the software implements the standard method of UNI/TS 11300 [21], the Italian standard transposing the EN ISO 13790:2008 [22].
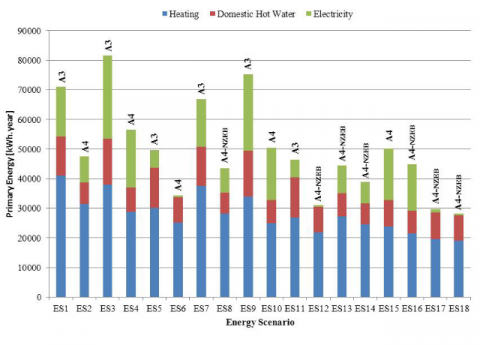
Analyzing the results of the energy calculations for all the 18 scenarios (Figure 5) it can be observed that ES3 and ES9 have a primary energy demand higher than the other solutions. It is due especially to the presence of deep geothermal water-to-water wells, whose electricity need is very high to move the fluid to the heat pump and therefore the absence of photovoltaic panels in these solutions affects significantly the performance results.
In fact, the electricity demand is cut down when the photovoltaic panels are applied, even if the primary demand for electricity in these solutions is high.
2.4 Economic evaluation
As defined in the Guidelines accompanying Commission delegated 244/2012 [11], in the economic evaluation, the measures that do not have an influence on the energy performances of the building and the costs that are the same for all the scenarios were not considered in the global cost calculation. For this case study, the cost optimal was calculated at a financial level and not a macroeconomic one, so the following conditions were assumed:
- costs considered comprehensive of VAT and taxes;
- incentives for Public Authorities calculated according to the Interministerial Decree of 16th February 2016 [23] and then detracted from the initial investment costs;
- actualization rate assumed equal to the interest market rate;
- CO2 emission costs neglected.
Figure 5. Primary energy demand for each ES subdivided in heating, DHW and electricity
In accordance with the Standard EN 15459:2007 [17], Global Cost CG (τ) was calculated considering the initial investment costs, the running costs (energy, operational and maintenance costs), the replacement costs, and the final value, as follows in Eq. 1:
C_{G}(\tau)=C_{I}+\sum_{j}\left[\sum_{i=1}^{\tau}\left(C_{a, i}(j) x R_{d}(i)\right)-V_{f, \tau}(j)\right] (1)
where:
- CI, Initial Investment Costs, achieved from the price list for the execution of public works and maintenances of the City of Milan [24]. The missing price voices were based on market analysis, as requested by the Guidelines [11].
- Ca,i(j), the Annual Costs for the component j at the year i, calculated considering a calculation period of 30 years in accordance to the guidelines [11] for retrofit analysis. The Annual Costs involve both energy consumption and operational, maintenance and replacement costs of each envelope and system component. To obtain the Energy Costs, gas and electricity consumptions provided by the quasi-state simulation were multiplied with the tariff set by the Italian Regulatory Authority for Electricity Gas and Water (€ 0.16 kWh-1 for electricity, € 0.75 m-3 for natural gas) [25]. To consider the variation of the energy prices, an actualization factor of 2% was applied [17]. Maintenance and replacement costs of systems components are provided by the Annex A of the Standard EN 15459 [17]. When data are not available, market analyses were considered. The lifespan of the envelope components is equal to the calculation period.
- Rd(i), the discount Rate at the year i calculated by using a Market Rate of 4% [26] and an Inflation Rate of 0,49% [27], calculated comparing the December 2016 CPI to the December 2015 CPI.
- Vf,t(j), the Final Value of the component j, calculated in function of the lifespan at the end of the calculation period and then subtracted at the last replacement cost.
2.5 Results
After the analysis of energy and economic performances reached by each ES, a comparison between the solutions was developed in order to define the best scenarios.
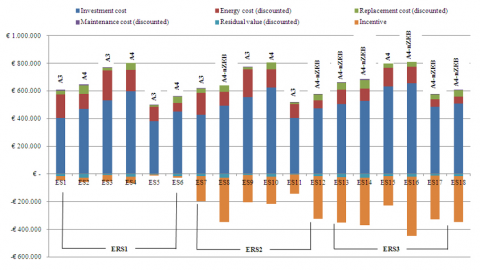
In Figure 6 Global Costs are represented divided in each item of the Eq.1: with the plus sign Investment Costs, Energy Costs, Replacement e Maintenance Costs, with the minus sign Residual Value and Incentives. In the three envelope configurations (ERS1, ERS2, ERS3), the ES with geothermal heat pump (ES3, ES4, ES9, ES10, ES15, ES16) have an Investment Cost and an Energy Cost higher than the other plants configurations, with a further cost addiction when the PV panels are added to the solar ones.
With the same plants configuration, to the addition of the PV panels always corresponds an increasing of the Investment Costs and of the Replacement Cost but also a reduction of the Energy Costs. The reduction of the PV panels of 33% in ES13, ES15 and ES17 implicates a reduction of the Investment Costs and Replacement Costs but a higher energy consumption than ES14, ES16 e ES18.
Except for the ES15 that does not obtain the nZEB class and has a reduction of the incentives in accordance to the Decree [23], in the other ES the PV panel reduction does not mean a significant reduction of the Global Cost: with subsides, costs and energy consumptions are balanced.
Figure 6. Subdivision of incentives and costs for each scenario
Figure 7. Cost optimal solution
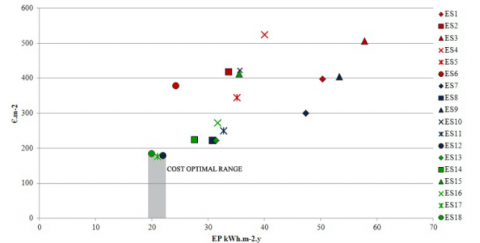
In Figure 7 the Cost Optimal range is represented with the correlation between Global Costs for square floor meter (€.m-2) and primary energy use (kWh.m-2.y). The ES17 has the lower Global Cost: 247,536.70 €, with an amount of 175.40 €.m-2 and with an EP of 21.04 kWh.m-2y. Then, the ERS3 combined with district heating and solar panels with the 33% PV panels reduction (ES17) achieves the best economic and energy performance balance. At the same time the ES12, with ERS2 combined with district heating, solar panels and the total amount of PV panels, is a little less efficient than the ES17 (ES12, Global Cost is 252,660.29 €, with an amount of 179.03 €.m-2 and with an EP of 22.0 kWh.m-2.y).
Comparing Figure 6 with Figure 7 the incentives gained with the nZEB class (65% for all the interventions) influence a lot the reduction of the global cost. If the incentives are not considered, ES5 (349.97 €.m-2) and ES11 (362.15 €.m-2), would be the best scenarios: both scenarios with solar panels without PV panels and, respectively, with ERS1 and ERS2. This result demonstrates that PV panels are indispensable to reach the nZEB class but without incentives are not economical affordable. Among the three best solutions in Figure 7, the ES18 foresees the ERS3 with district heating, solar panels and the total amount of PV panels: the result is a lower EP equal to 19.99 kWh.m-2y but a higher cost equal to 183.83 €.m-2. The difference in comparison to ES17 and ES12 is low and this is a confirmation that a higher initial investment not necessary implicates a lower global cost in a calculation period of 30 years.
ES3 and ES4 (ERS1 with geothermal plants) have the higher global cost: the PV panels (ES4) reduce the energy consumption but the Initial Investment Costs and the Replacement Costs are too high to be balanced with the energy performance.
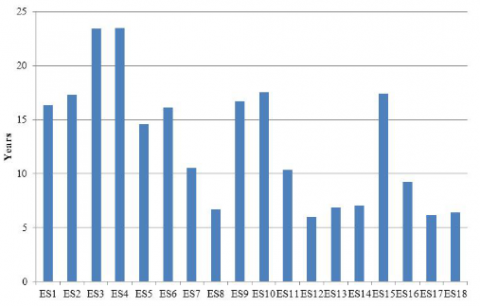
Figure 8 underlies how the three best solutions (ES12, ES17 and ES18) have a Pay Back Period lower than 10 years while ES 3 and ES 4 have a PBP close to 30 years.
Figure 8. Payback Period of different ES for the case study
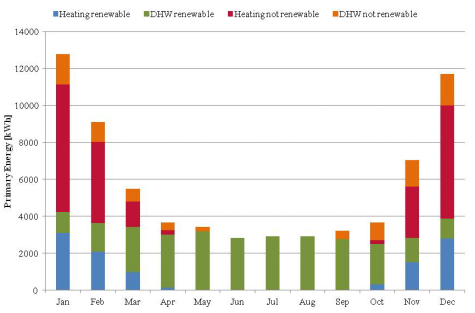
Figure 9. Renewable and not renewable primary energy-ES17
Figure 10. Renewable and not renewable primary energy-ES12
A reduction of the envelope performance can be compensated by an increasing of the PV panels quantity, earning the same nZEB class. Otherwise, a reduction of the PV panels can be compensated with an increasing of the envelope performance. This is evident from the comparison between the monthly primary energy demand in the two scenario ES17 and ES12 (respectively Figure 9and Figure 10); in both the renewable sources cover the same percentage of primary energy (56% for heating and domestic hot water, 75% for domestic hot water).
Therefore in ES17 the energy demand is lower, since the envelope is more insulated and the windows are triple glazed, while in ES12 the energy demand is higher but the larger quantity of PV panels compensates the greater demand.
In case of refurbishment intervention on social housing towards nZEB class, it is relevant for the Public Authorities to have the possibility to consider the results represented both in Figure 6 and Figure 7. It is possible to identify among the different solutions with the lower global cost, the most advantageous ones and to analyze the costs breakdown for each category. In this way, for the same achieved energy class, depending on the available funds, it is possible to decide whether to prefer a solution with a higher initial investment cost but with lower running costs, or to mediate with a solution having lower investment costs but higher running costs. The nZEB class can be reached both with district heating combined with an average level of insulation and the total amount of PV panels, or with district heating combined with high level of insulation and a reduction of the PV panels.
The PBP for the three best solutions is similar and confirms the economic results of the Cost Optimal calculation (Figure 8).
It may be noticed the substantial role the incentives play in the cost-optimal solution calculation; in fact, comparing Figure 9 and Figure 10, the similar results of the two solutions ES12 and ES17 are evidenced, both for achieving nZEB class and for the optimal balance between costs and energy performances. It follows that, according to the existing incentives in the assessment period, the investment can be more convenient on the building envelope (insulation, windows replacement, etc.) or on PV panels.
This paper highlights how PV panels are necessary to achieve the nZEB class but without subsides they are still far from cost optimality. The district heating proves to be the best plant solution for this case of study and confirms the prescription of the DM 26 June 2015 [6] that, in case of important refurbishment, the connection to the district heating network is required (when it is minus than 1000 m far). Nevertheless this plant solution is still not capillary spread all over the Italian territory, therefore not always practicable [28].
For almost equal results between two or three solutions, as in this research, the obtained results can be the starting point for a further exploration of convenience in terms of sustainability through the application of an assessment tool and LCA analysis of the two cost-optimal solutions.
Furthermore, using a dynamic simulation software for a multi-objective optimization it is possible to analyze, at the same time, energy, economic and environmental skills, like comfort and CO2 emissions. This holistic approach could be a useful instrument to define the best solution and to identifying the best parameters yielding the lowest energy consumption without compromising occupant comfort.
|
CG (t) |
Global cost (referred to starting year t0), € |
|
CI |
Initial investment costs, € |
|
Ca,i(j) |
Annual cost year i for component j (including running costs and periodic or replacement costs), € |
|
DHW |
Domestic Hot Water, kWh |
|
EPS |
Expanded polystyrene insulation |
|
Ep |
Primary Energy Indicator for global not renewable energy, kWh.m-2 |
|
ERS |
Energy Refurbishment Solution |
|
ES |
Energy Scenario |
|
PBP |
Payback Period, years |
|
PV |
Photovoltaic Panel |
|
Rd(i) |
Discount rate for year i |
|
S |
Thickness, m |
|
U |
Thermal Transmittance, W.m-2.K-1 |
|
Vf,t(j) |
Final value of component j at the end of the calculation period (referred to the starting year t0) |
|
Greek symbols |
|
|
τ |
Calculation period (assumed equal to 30 years) |
[1] Beretta A.L. (1963). I 14 anni del piano INA-Casa (14 years of INA-Casa plan), Staderini Editore, Roma.
[2] Italian National Law n.373/1976, Law on the thermal energy saving in buildings, Official Gazette of the Italian Republic, No. 148.
[3] Italian National Law n.10/1991. (1991). Law on the implementation of the National Energy Plan for the energy use, energy saving and development of renewable energy sources, Official Gazette of the Italian Republic, No. 13.
[4] Directive 2002/91/EC of the European Parliament and of the Council of 16 December 2002 on the energy performance of buildings, Official Journal of the European Union.
[5] Directive 2010/31/EU of the European Parliament and of Council of 19 May 2010 on the energy performance of building (recast), Official Journal of the European Union. DOI: 10.3000/17252555.L_2010.153.eng
[6] Interministerial Italian Decree 26 June 2015 – National guidelines for energy certification of buildings.
[7] Ferreira M., Rodrigues A. (2016). Cost-optimal energy efficiency levels are the first step in achieving cost effective renovation in residential buildings with a nearly-zero energy target”, Energy and Buildings, Vol. 133, No. 1, pp. 724-737. DOI: 10.1016/j.enbuild.2016.10.017
[8] Dall’O’ G., Galante A., Pasetti G. (2012). A methodology for evaluating the potential energy savings of retrofitting residential building stocks, Sustainable Cities and Society, Vol. 4, pp. 12-21. DOI: 10.1016/j.scs.2012.01.004
[9] Ryghaug M., Sørensen K.H. (2009). How energy efficiency fails in the building industry, Energy Policy, Vol. 37, pp. 984-91. DOI: 10.1016/j.enpol.2008.11.001
[10] Cascio E.L., Ma Z., Borelli D., Schenone C. (2017). Residential building retrofit through numerical simulation: A case study, Energy Procedia 111, pp. 91-100. DOI: 10.1016/j.egypro.2017.03.011
[11] Commission Delegated Regulation (EU) No 244/2012 of 16 January 2012 supplementing Directive 2010/31/EU of the European Parliament and of the Council on the energy performance of buildings by establishing a comparative methodology framework for calculating cost-optimal levels of minimum energy performance, Official Journal of the European Union, DOI: 10.3000/19770677.L_2012.081.eng
[12] Barthelmes V.M., Becchio C., Bottero M.C., Corgnati S.P. (2014). The influence of energy targets and economic concerns in design strategies for a residential nearly-zero energy building, Buildings, Vol. 4, pp. 937-962. DOI: 10.3390/buildings4040937
[13] Becchio C., Ferrando D.G., Fregonara E., Milani N., Quercia C., Serra V. (2016). The cost-optimal methodology for the energy retrofit of an ex-industrial building located in Northern Italy, Energy and Buildings, Vol. 127, pp. 590-602. DOI: 10.1016/j.enbuild.2016.05.093
[14] Zacà I., D’Agostino D., Congedo P.M., Baglivo C. (2015). Assessment of cost-optimality and technical solutions in high performance multi-residential buildings in the Mediterranean area, Energy and Buildings, Vol. 102, pp. 250-265. DOI: 10.1016/j.enbuild.2015.04.038
[15] Marszal A.J., Heiselberg P. (2011). Life cycle cost analysis of a multi-storey residential net zero energy building in Denmark, Energy, Vol. 36, pp. 5600-5609. DOI: 10.1016/j.energy.2011.07.010
[16] Becchio C., Dabbene P., Fabrizio E., Monetti V., Filippi M. (2015). Cost optimality assessment of a single family house: Building and technical systems solutions for the nZEB target, Energy and Buildings, Vol. 90, pp. 173-187. DOI: 10.1016/j.enbuild.2014.12.050
[17] European Standard EN-15459:2007. (2007). Energy performance of buildings–economic evaluation procedure for energy systems in buildings.
[18] Italian Legislative Decree (2011). Implementing the European Union's Renewable Energy Directive 2009/28/EC, amending and subsequently repealing Directives 2001/77/EC and 2003/30/EC.
[19] Italian National Body of Standardization UNI 10349-1:2016, Heating and cooling of buildings - Climatic data - Part 1: Monthly means for evaluation of energy need for space heating and cooling and methods for splitting global solar irradiance into the direct and diffuse parts and tor calculate the solar irradiance on tilted planes.
[20] Italian National body of standardisation, www.uni.com.
[21] Italian National Body of Standardization UNI/TS 11300:2014, Energy performance of buildings, Part 1: Evaluation of energy need for space heating and cooling, Part 2: Evaluation of primary energy need and of system efficiencies for space heating, domestic hot water production, ventilation and lighting for non-residential buildings, Part 3: Evaluation of primary energy and system efficiencies for space cooling, Part 4: Renewable energy and other generation systems for space heating and domestic hot water production
[22] Italian National Body of Standardization. Energy performance of buildings, calculation of energy use for space heating and cooling, UNI EN ISO 13790.
[23] Italian Interministerial Decree 16 February 2016, Amendment to the “Conto Termico”.
[24] Listino prezzi per l’esecuzione di opera pubbliche e manutenzioni del Comune di Milano, edizione 2017, volume 1.1 Opere compiute civili ed urbanizzazioni e 1.2 Opere compiute impianti elettrici e meccanici (Price list for the execution of public works and maintenances of the City of Milan)
[25] The Italian Regulatory Authority for Electricity Gas and Water, from www.autorita.energia.it, accessed August 2017.
[26] http://ec.europa.eu/smart-regulation/guidelines/tool_54_en.htm, accessed August 2017.
[27] http://www.inflation.eu/inflation-rates/italy/historic-inflation/cpi-inflation-italy.aspx, accessed August 2017.
[28] https://www.legambiente.it/teleriscaldamento/, accessed August 2017.