OPEN ACCESS
EU Directive n. 27/2012 on energy efficiency establishes that each year, until 2020, 3% of the surface covered by buildings owned by the Central Government shall be restructured. In Italy, the total surface to be requalified amounts to 2,5 million square meters. In Italy, the Kyoto Rotating Fund for Schools is one of incentives available to achieve the goal of energy requalification for Public Administration. The Kyoto Fund finances energy requalification of educational buildings with loans at a preferential rate of 0,25%.
The aim of this paper is to identify the more suitable energy retrofit strategies, on a School located in Sicily, to achieve the requirements for the granting of subsided rate loans under the Kyoto Fund. The feasibility study considers both technical and economic aspects.
In particular, the energy retrofit strategies are focused on the use of materials and products recyclable or otherwise arising from sustainable processes in order to ensure the requirements of the Kyoto Fund. The design strategies and methodology adopted for the retrofit of the school allowed to improve building's energy class from D to A4, with a considerable saving of energy needs from 104,50 kWh/m2 to 4,80 kWh/m2, with high return on reasonable short-term investment, as well as meaningful reduction of CO2 emissions (90%).
kyoto fund, school, energy efficiency, school retrofitting, energy saving
Buildings account for about 40% of the total energy consumption in the European Union, with more than 50% from the residential sector. The necessity to improve energy efficiency in buildings is thus becoming a challenge [1].
The improvement of building energy performance is one of the opportunities for the Member States of European Union to comply with the Kyoto Protocol, and to honor both its long-term commitment to maintain the global temperature rise below 2°C, and its effort to achieve the 20/20/20 targets by 2020.
However, funding programs should provide useful financing tools to support energy-efficient retrofitting projects and to boost investment [2].
Currently, in Italy nine financial instruments recently provided funding for energy efficiency. The majority of these funds are directed at the building sector. The largest programs in the years 2012-2014 were a tax rebate scheme for building redevelopment with a budget impact of almost €700 million per year, and the Revolving Kyoto Fund with an annual volume of around €100 million.
In particular, in 2007 the Financial Law introduced the so-called Kyoto Fund, of approximately 600 M€. This was meant to fund innovation projects to abate GHG in response to the Italian Kyoto targets. Financing is subject to an interest rate of 0.5%. The Ministry of the Environment with the support of the Cassa Depositi e Prestiti (Italian National Promotional Institution that has supported the economy since the 1850s, largely managing postal savings) manages the fund [3]. In 2012 the Kyoto Fund was focused on renewable energy projects (200 M€), in 2013 on projects that favor youth employment in the green economy (460 M€), and in 2015 funding was dedicated to the implementation of measures to improve energy efficiency in public schools (the interest rate was reduced to 0.25%).
Once again, in February 2016 financing has been made available, with 250 M€ available for energy efficiency interventions in schools, universities and kindergartens. Financing are still granted at a 0.25% rate, but only for those retrofit action capable of improving the energy class by at least two positions, within three years after completion [3].
The financeable amount for each individual school building should not exceed the limit of 1 M€ if only energy generation systems are addressed, and 2 M€ when building envelope renovation is also performed.
In Italy, a full and detailed knowledge of the existing school building stock is not currently available. However, the data provided by Italian National Statistics Institute (ISTAT) estimate that there are, nationwide, about 51,000 buildings entirely or partly used as schools [4].
As regard the location, 30% of school buildings are concentrated in 10 provinces (the top three being Rome, Milan and Naples).
More than half (51%) are located in 24 provinces. The school buildings are divided as follows: 49% nursery schools, 35% primary schools, 16% first level secondary schools.
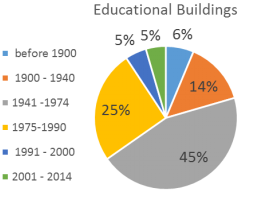
As shown by Fig. 1, most Italian educational buildings were built without any energy-related regulation in force (i.e. prior to 1976) and less than 11% were built after the adoption of the Law 10/1991 which is the first regulation in Italy introducing significant constraints about energy efficiency and consumptions [5].
Figure 1. Construction age for educational buildings in Italy
The great majority of existing educational buildings are provided with inefficient systems and technologies. They frequently use traditional heating systems, in particular radiators for heat distribution and gas/oil-fired boilers for generation.
Furthermore, in Italy school holidays are scheduled in summer, and this is the reason why most educational buildings are not provided with cooling systems or HVAC systems (Heating ventilation and air conditioning) [6], [7].
Hence, thermal comfort in hot days is entrusted to solar control devices (e.g. mobile or fixed shading devices, including verandas) and/or night ventilation. The reduction of the building energy demand has to be accomplished by addressing heating systems and artificial lighting.
The exploitation of Kyoto Fund to ensure the achievement of the energy and environmental target established for educational buildings can be an opportunity not to miss, as long as the improvement of the energy class by at least two positions can be reached through a set of widespread, suitable and low-cost solutions [8].
Besides Kyoto Fund, other financial support schemes can be considered, such as the Heating and Cooling Support Scheme (Conto Termico), which provides financial incentives on capital costs for eligible retrofit investments, payable on yearly basis for a variable period of 2 to 5 years depending on the type of action and on its scale of application [9].
The incentives introduced by Conto Termico are also available for Public Administrations (PA).
In this context, this paper analyses a set of energy efficient measures for the energy retrofit of an educational building located in Sicily, which allow to access the incentives provided by the Kyoto Fund and the Conto Termico scheme.
The proposed energy retrofit strategies significantly improve the energy class, moreover it is necessary to prove they sustainability even form a financial point of view, with high return on a short-term investment.
In order to obtain the expected exergy saving, the evaluation of a retrofit intervention requires finding out the most effective solutions according to the particular condition of the site and to the type of building to be renovated [10].
Therefore, it is essential to define a clear picture of the current condition of the building. Consequently, in the first stage, a diagnostic activity has been carried out in order to collect reliable information concerning the HVAC systems, the lighting systems, the geometry of the building elements, their current condition, the pathologies affecting them and the deficit to be addressed.
Moreover, specific information on the features of the site, the climatic conditions, the orientation and the current energy consumption are collected. All data regarding the building undergoing renovation have been used for modelling a specific case study, in order to obtain a reliable model where different scenarios with different technological solutions and strategies can be simulated and tested.
The energy performance (EP) index of the building has been investigated before and after the proposed retrofit actions. Analyses and simulations are performed using Termolog EpiX7 Software, which operates in accordance with the following regulations: UNI EN ISO 15316 [11], UNI EN ISO 13790 [12], UNI TS 11300 parts 1-2 [13], [14]. At the end, an economic analysis has been developed for evaluating the feasibility and convenience of the different solutions with regard to costs and revenues [15].
In particular, the following financial indices have been evaluated:
- The Net Present Value (NPV), which is the sum of the discounted values of incoming and outgoing cash flows, i.e. revenues (R) and costs (C), over the whole lifespan (T), taking into account the discount rate r:
$N P V=\sum_{t=0}^{T} \frac{R_{t}-C_{t}}{(1+r)^{t}}$ (1)
In order to compare different options with almost equal NPV, r has to be assumed equal to the cost of capital, which can be calculated according to the Weighted Average Cost of Capital (WACC):
$W A C C=\frac{K_{d} \cdot D+K_{e} \cdot E}{D+E}$ (2)
Here, WACC is the cost of the invested capital, Kd is the interest rate for Debt (D) and Ke is the opportunity cost of Equity (E). The interest rate for Debt (D = 90%) and the opportunity cost of Equity (10%) are referred respectively to the active and passive interest rates charged. The interest rate for Debt is set at 0.25% according to Kyoto Fund over 20 years loan life, while the opportunity cost of Equity is set at 12%. Consequently, the value of WACC is assumed by 1.43 %.
- The Internal Rate of Return (IRR), which is the discount rate that makes NPV of all cash flows from the investment equal to zero:
$0=\sum_{t=0}^{T} \frac{R_{t}-C_{t}}{(1+I R R)^{t}}$ (3)
IRR needs to be greater than the discount rate r, given that the discount rate is assumed as the global cost (interest rate and opportunity cost) of the invested capital.
- The Payback Period (PP) is used as an alternative to net present value. It is the time required after an investment to recoup the initial costs of that investment. Unlike NPV, the payback period fails to account for the time value of money. For this reason, payback periods calculated for long investments have a greater potential for inaccuracy, as they encompass more time during which inflation may occur and skew projected earnings.
- The Discounted Payback Period (DPP) is used to determine the profitability of a project. The discounted payback period gives the number of years it takes to break even, from undertaking the initial investment and by discounting future cash flows.
The economic analysis with reference to the retrofitting cases has been performed according to four different solutions, and the technical-economic situation in Italy was referred to the year 2016.
The operating costs were evaluated according to the Italian scenario by assuming the unit cost of natural gas equal to 0.10 €/kWh and the unit cost of electricity equal to 0.18 €/kWh [17]. The service life and maintenance costs of the energy efficiency measures and their components have been obtained according to the UNI EN 15459:2008 [18].
The different solutions consider the government incentives for the Public Administration (PA): Conto Termico and Kyoto Fund. Table 1 shows service life and maintenance time for some of the involved technologies.
Table 1. Service life and maintenance
|
Type |
Service Life |
Maintenance Cost |
|
|
year |
% |
|
Insulated Ventilated Façade |
50 |
- |
|
Photovoltaic plant |
25 |
1% |
|
Solar Thermal Plant |
20 |
2% |
|
Heat Pump |
20 |
4% |
3.1 Description of the building
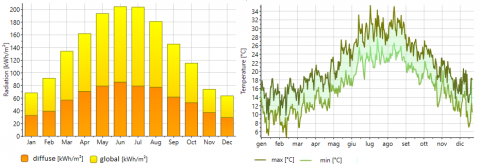
The case study considered is the “S. Francesco” kindergarten in Paternò, a municipality of about 48,500 inhabitants located in the southern area of Sicily. This city has 1087 degree days, defined relative to a base outdoor temperature of 20°C, and belongs to Zone C according to the national climatic zoning. This is quite common for the southern area of the Sicily, characterized by mild winter and hot dry summer.
Figure 2. Daily air temperature and monthly solar radiation
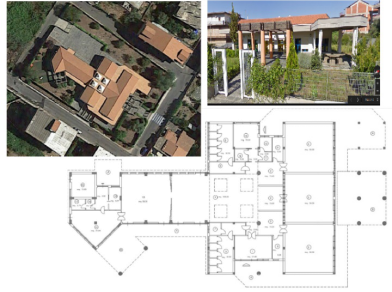
Figure 3. School entrance, map and ground floor
Daily air temperatures and monthly solar radiation for this site, based on the database available on Meteonorm, are plotted in Fig. 2. The building (Figure 3) is located on the north-west part of the city, in a not densely built area.
The whole structure has a gross surface of 1,147 m2 and a gross volume of 2,336 m3; the shape factor is 0.49 m-1. The number of pupils varies from 60 to 70, depending on the year, and the adults are between 8 and 12, including teachers and caretakers. The building has one level and hosts classrooms, laboratories, baths, dressing rooms, kitchen, canteen and administration rooms.
3.2 Building and energy systems’ features
The envelope of the building has the typical features of the period in which it was built (1996-2001). The bearing structure of the building consists of pillars and beams in reinforced concrete. The roof is made with typical Sicilian tiles with a pitch angle 25°
Vertical walls are made of a double layer of bricks with polyurethane insulation. The concrete slab (30 cm) of the attics is not insulated. Windows have double-glazing and aluminum frame with thermal break, and they are equipped with external roller blinds manually operated for thermal and visual comfort. U-values of the main envelope components, calculated after inspection, are as follows:
- main brick walls: U = 0.95 W·m-2·K-1
- concrete pillars and beams: U = 2.80 W·m-2·K-1
- attic floor: U = 1.55 W·m-2·K-1
- ground floor: U = 1.55 W·m-2·K-1
- windows: U = 2.6 W·m-2·K-1
The heating system of the school consists of:
- four 1.4 kW electric boilers, to prepare sanitary hot water; each boiler has 80 liters thermal buffer.
- one natural gas boiler with a power of 50 kW, plus 15 fan-coils placed, generally, under the windows;
- no room or zone temperature controls;
- no mechanical ventilation system
Manual opening of the windows ensures the air quality during classrooms and daily cleaning. The lighting system consists of T8 or T5 fluorescent lamps installed in rooms, corridors and service area, with a total power of 4 kW. No control systems are installed.
The school is practically unused from the end of May until mid-September, and no cooling system is required. All the spaces, as well as the corridors, have large windows, which ensure good daylighting.
Figure 4 shows the data referring to electricity and gas consumption in 2015. Only aggregated data are available, since no metering system for the different energy uses and services is actually installed. The graph shows that the average electricity consumption in 2015 is about 10,509 kWh (17.54 kWh·m-2·y-1), being the electricity use for appliances and artificial lighting. The average real thermal energy consumption is 38.4 kWh·m-2·y-1, and is provided by natural gas; this amount of energy is used for the space heating and kitchen use.
Figure 4. Gas and electricity consumption
3.3 The energy performance certificate
The Kyoto Fund target for an educational building requires an improvement of the energy class by at least two positions, within three years after completion. Hence, the energy performance (EP) index of the building has been calculated using Termolog EpiX7. The energy performance is expressed by the annual non-renewable primary energy consumption for heating, DHW preparation and lighting, needed for standard building operation. The result of energy performance calculation for the building in its current state is EPgl,nren = 104.50 kWh·m-2·y-1 with D energy class level.
The results show that the calculated consumption (3,791 Sm3) for heating are higher than real consumption (2,386 Sm3) recorded in 2005
While the calculated electric consumption (11,821 kWh) is very close to the one (10,509 kWh) observed in 2015.
3.4 Proposed retrofit strategies
The proposed energy retrofit strategies are focused on the use materials and products, which improve building's energy class, but also allow high return on a short-term investment and significant emissions reduction.
Starting from the analysis of the current building performance, energy efficient measures were addressed to the increase of the building insulation as well as to the upgrade of the heating system. The following energy efficient measures were chosen:
(1) insulated ventilated façade (see Table 2)
(2) heat pump for space heating and domestic hot water
(3) installation of PV and solar thermal plant
The opportunity to replace the windows was not evaluated, because they are already well performing. The ventilated façade solution was adopted since this technique avoids most thermal bridges that are due to concrete beams and pillars.
The cladding of the ventilated façade is made of naturally hardened fiber cement, while the insulation is made of panels realized with processing scraps of textile industries and recycled textile products that have reached the end of their life cycle. In table 2 is reported the layer of the existing wall (from 1 to 6) and the layer of the ventilated façade (from 7 to 9)
Hence, the ventilated façade is realized with sustainable eco-friendly material, easily separable during disassembly and recycling. After upgrading, the U-value of the opaque façade is U = 0.3 W·m-2·K-1.
An air-to-water electrical heat pump combined with PV panels was adopted to replace the obsolete heat generator, with a thermal power of 32 kW and COP = 4.10.
The PV panels can be placed on the roof of the building with south with a tilt angle of 25°. A total number of sixteen polycrystalline PV panels should be installed; each PV panel has a surface of 1.20 m2, with a peak power as high as 210 W and efficiency 16.7%.
Table 2. Thermal features of the ventilated façade
|
|
Layers |
Thickness |
Conductivity |
|
|
|
mm |
W/m K |
|
1 |
Gypsum plasterboard |
20 |
0.90 |
|
2 |
Masonry block |
80 |
0.40 |
|
3 |
Air Gap |
40 |
0.13 |
|
4 |
XPS |
30 |
0.25 |
|
5 |
Cement Brick |
120 |
0.50 |
|
6 |
Gypsum plasterboard |
20 |
0.90 |
|
7 |
Textile insulation panel |
65 |
0.03 |
|
8 |
Air Gap |
40 |
0.13 |
|
9 |
Cladding |
8 |
0.42 |
On the other hand, solar thermal collectors can supply sanitary hot water. The solar collectors are south-oriented with a tilt angle of 25°; the collector's optical efficiency (τα) is 83%, and the thermal loss coefficient is 3.40 W·m-2·K-1. Moreover, the solar plant is equipped with a stratified storage tank with a capacity of 1000 liters. The installation of six flat-plate collectors, with a gross area of 2.30 m2 each, is sufficient to satisfy the energy demand.
Several numerical analyses were carried out considering the energy efficiency measures described in the previous chapter, in order to verify the effectiveness of such measures to make the school meet the target performance.
The calculations were performed with a national certified software (Termolog EpiX7), based on relevant national and international standards.
The software allows the calculation of final and primary energy demand for all energy services, namely: space heating, sanitary hot water, lighting.
In Table 3 the main results are reported for the proposed energy efficiency measures, considering the non-renewable primary energy needs for heating (EPH,nr), domestic hot water (EPW,nr) and lighting (EPL,nr).
It can be noticed that, in case 3, the values of EPL,nr and EPW,nr decrease thanks the support of PV systems and solar thermal plant.
The results show that the only interventions on the envelope do not improve the energy class by at least two positions, as requested by Kyoto Fund.
Table 3. Energy performance results
|
Case |
EPH,nr |
EPW,nr |
EPL,nr |
EPgl,nr |
Class |
|
|
kWh/m2 |
|
|||
|
Base |
66.70 |
26.10 |
11.70 |
104.50 |
D |
|
(1) |
52.50 |
26.10 |
11.70 |
89.06 |
C |
|
(2) |
0.40 |
26.10 |
11.70 |
38.30 |
A3 |
|
(3) |
66.40 |
2.40 |
2.20 |
71.00 |
C |
|
(2)+(3) |
0.20 |
2.40 |
2.20 |
4.80 |
A4 |
|
(1)+(2)+(3) |
0.20 |
2.40 |
2.20 |
4.80 |
A4 |
The interventions on the energy systems are more effective if compared to those on the envelope, despite the latter may avoid thermal bridges and improve indoor thermal comfort.
In table 4, the main results are described for the proposed energy efficiency measures, considering the electricity and GHG emissions. It clearly appears that the solutions (1) + (2)+(3) and (2)+(3) are equivalent in terms of energy saving and emissions reduction.
Table 4. Energy and CO2 saving
|
|
Electricity |
Δ |
Gas |
Δ |
Δ GHG |
|
|
kWh |
% |
Sm3 |
% |
kg/m2 |
|
Base |
11,821 |
- |
3,792 |
- |
|
|
1 |
11,775 |
0.4 |
2,914 |
23 |
3.1 |
|
2 |
11,755 |
0.4 |
- |
100 |
13.3 |
|
3 |
1,530 |
87.1 |
3,792 |
- |
14.5 |
|
2+3 |
1,470 |
87.8 |
- |
100 |
27.8 |
|
1+2+3 |
1,470 |
87.8 |
- |
100 |
27.8 |
4.1 Economic issues
The economic evaluation was performed considering the initial investment costs, the annual operating cost for each energy service and a final value derived by a linear depreciation of the initial investment until the end of the calculation period. In the cost evaluation, taxes, VAT, charges and subsidies have been included.
Conto Termico provides financial incentives by 65% on capital costs for all retrofit interventions that can modify the status of the building up to Net ZEB. The incentives are available for a period of 5 years, with the investment limitation of 1.500.000 € and unitary costs of 500 €/m2.
So, two scenarios were analyzed, both able to fulfill these requirements (A4 class): scenario A that considers all proposed interventions (1 + 2 + 3), and scenario B that is the same as scenario A, but without intervention on envelope.
In both cases, Kyoto Fund provides the loan at a nominal fixed rate of 0.25% per annum for a maximum period of 20 years. In Table 5 the costs of the needed equipment is reported.
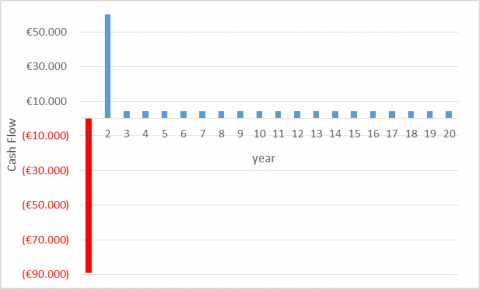
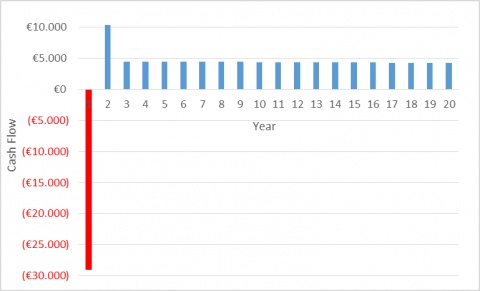
The cash flows for scenario A and B have been calculated and displayed in Fig. 5 and Fig. 6, showing the initial investment cost and the discounted incentives (during the first year) and savings (during the whole life cycle).
Eligible energy efficiency scenarios can be justified only based on an economic cost-benefit-analysis, for which the net present value, including externalities, is greater than the net present cost of the scenario over its life.
Figure 7 illustrates the NPV values for the two scenarios. It is highlighted that in both cases the investment shows a positive NPV and would be profitable, but the payback index is lower for scenario B despite the governmental incentives are lower compared with the scenario A
Table 5. Cost of systems
|
|
Heat Pump |
Solar Thermal |
Photovoltaics |
Envelope |
|
|
€ |
€ |
€ |
€/m2 |
|
Unitary cost |
15000 |
8000 |
6000 |
100 |
|
Investment cost |
15000 |
8000 |
6000 |
60000 |
|
Maintenance |
600 |
240 |
230 |
|
Figure 5. Cash flows for scenario A (1+2+3)
Figure 6. Cash flows for scenario B (2+3)
Figure 7. NPV values for scenario A and B
Obviously, the convenience of an investment cannot be merely based on NPV, considering that one primary issue with gauging an investment’s profitability with NPV is that it relies heavily upon multiple assumptions and estimates, so there can be substantial room for error.
Consequently, it is essential to calculate other economical indices such as IRR, PP and DPP. In Table 4, all calculated financial indices are summarized for both scenarios.
Table 6. Economic results and financial indices
|
|
Scenario A |
Scenario B |
|
NPV(€ ) |
40,115 |
52,074 |
|
IRR (%) |
9.65 |
17.67 |
|
PP (y) |
7.47 |
5.20 |
|
DPP (y) |
8.18 |
5.46 |
Both investment scenarios are optimal for the reason that NPV is greater than zero, IRR is greater than the WACC and PP and DPP are lower than service life (20 year).
However, as previously reported, the scenario B remains the best one for all indices.
Considering that, the issue of the energy efficiency measures for educational buildings is absolutely on the agenda, and that it is common to all schools and territories, it is needed to pay high attention on this topic and provide funding dedicated to it. Nevertheless, what would happen if the educational buildings could not access to Kyoto Fund?
If they accessed to other private loan (i.e. bank, investments funds, etc.) according to the statistics of Bank Italia [19] the debt rate would not be lower than 6.11% (over 5 years loan life). Under the previous hypothesis, all economical indices have been evaluated with a value of WACC equal to 6.70%. The results of this last analysis is reported in table 5.
Table 7. Economic results and financial indices
|
|
Scenario A |
Scenario B |
|
NPV(€ ) |
€ -6,927 |
€ 8,557 |
|
IRR (%) |
4.24 |
11.86 |
|
PP (y) |
10.89 |
6.32 |
|
DPP (y) |
20.00 |
9.26 |
It can be noticed that the investments become no-cost effective (Scenario A) for the reason that NPV is lower than zero, IRR is lower than the WACC despite PP and DPP are lower and equal to service life (20 year). On the contrary, scenario B is still an optimal investment for the reason that NPV is greater than zero, IRR is greater than the WACC and PP and DPP are lower than service life (20 year).
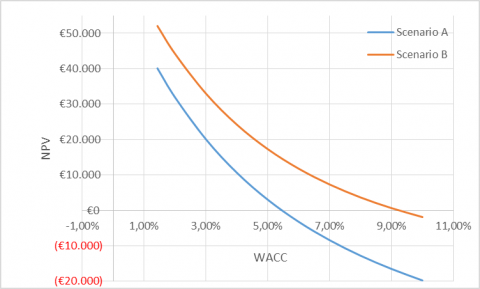
Figure 8. Sensitivity analysis of NPV on varying WACC
Consequently, the educational building cannot take into consideration the investments for energy efficiency measures without suitable and sustainable energy policy of government in terms of funding and grants. Finally, it can be useful to carry out a sensitivity analysis of NPV on varying WACC indices. Figure 8 shows that the investment for Scenario A is attractive for WACC less than 6.00%, with positive NPV values, while the investment for Scenario B is attractive for WACC less than 9.00%.
There is considerable potential within most public sectors to make large energy cost and carbon emission savings through the installation of energy efficiency measures. The energy efficiency technologies often recompense their initial capital cost within just a few years. Such improvements can provide important long-term cash savings and reduced exposure to future changes in energy costs.
There are a number of different approaches to investment appraisal (NPV, IRR, PP, DPP). Each approach has its own strengths, but all contain an element of uncertainty.
However, an investment is affordable if the public sector (educational building) is able to use competitive government funds to repaying the debt from the resulting cost saving.
In the present work, an existing educational building, located in Paternò − Italy, has been investigated taking into account different energy saving scenarios. Potential energy savings were calculated by steady-state software. Finally, an evaluation of financial indices was performed.
Many ideas emerged from this work. First, the only upgrading of the envelope does not produce an interesting energy efficiency value, and one could not benefit from Kyoto fund.
Notably, the installation of a total energy recovery system together with the upgrading of envelope resulted in sensible reduction of energy consumption and at the same time generated good values of NPV and other indices. However, the scenario without envelope upgrade represents the optimal solution for cost effectiveness. So if it is true that the upgrading of envelope guarantees to avoid the thermal bridges and improve the indoor thermal comfort, on the other hand, it is not economical convenient at parity of energy saving. So, the upgrading of envelope can be suggested in case of molds and or superficial degradations, or when the architectonic and aesthetical renovation of the building are the main scope of the refurbishment.
Moreover, in the context of the actual energy policy in Italy, retrofitting actions aimed at energy saving on existing educational buildings can be encouraged only if suitable government funds or grants are available.
[1] Gagliano A., Nocera F., Detommaso M., Evola G. (2016). Thermal behavior of an extensive green roof: Numerical simulations and experimental investigations, International Journal of Heat and Technology, Vol. 34, Sp. 2, pp. S226-S234. DOI: 10.18280/ijht.34Sp0206
[2] Evola G., Marletta L., Gagliano A., Nocera F., Peci D. (2016). Energy balances and payback time for controlled mechanical ventilation in residential buildings, International Journal of Heat and Technology, Vol. 34, Sp. 2, pp. S315-S322. DOI: 10.18280/ijht.34Sp0218
[3] Incentivi, Cassa Deposito e Prestititi, from http://www.cdp.it/Clienti/Government-PA, accessed on 2 March. 2016.
[4] Rapporto ISTAT, from https://www.istat.it/it/archivio/scuola, accessed on 2 March. 2016.
[5] Rapporto 2009 Sulla Scuola in Italia, Fondazione Giovanni Agnelli, from http://www.documentazione.info/rapporto-sulla-scuola-italiana-gli-insegnanti (accessed on 2 March 2016), accessed in Dicembre 2008.
[6] Gagliano A., F., et al. (2016). Synergic effects of thermal mass and natural ventilation on the thermal behavior of traditional massive buildings, International Journal of Sustainable Energy, Vol. 35, No. 5, pp. 411-428. DOI: 10.1080/14786451.2014.910517
[7] Gagliano A., Nocera F., et al. (2014). Performance assessment of a solar assisted desiccant cooling system Thermal Science, Vol. 18, No. 2, pp. 563-576. DOI: 10.2298/TSCI120526067G
[8] Gagliano A., Nocera F., et al. (2013). A case study of energy efficiency retrofit in social housing units, Energy Procedia, Vol. 42, pp. 289-298. DOI: 10.1016/j.egypro.2013.11.029
[9] Conto Termico, GSE, from www.gse.it /Home /Conto Termico (DM 28/12/12), accessend on 2 March. 2016.
[10] Gagliano A., Nocera F., et al. (2017), Energy efficient measure to upgrade a multistory residential in a nZEB, AIMS Energy, Vol. 5, No. 4, pp. 601-624. DOI: 10.3934/energy.2017.4.601
[11] EN 15316-2007 Heating systems in buildings - method for calculation of system energy requirements and system efficiencies (Part 1-4)
[12] EN ISO 13790 – 2008. Energy performance of buildings - calculation of energy use for space heating and cooling.
[13] UNI TS 11300 Prestazioni energetiche degli edifici Parte 1-2008 Determinazione del fabbisogno di energia termica dell’edificio per la climatizzazione estiva ed invernale.
[14] UNI TS 11300 Prestazioni energetiche degli edifici Parte 2-2008 Determinazione del fabbisogno di energia primaria e dei rendimenti per la climatizzazione invernale e per la produzione di acqua calda sanitaria.
[15] Giuffrida S., Ferluga G. (2015). A. valenti, capitalisation rates and ‘real estate semantic chains’: An application of clustering analysis, International Journal of Business Intelligence and Data Mining, Vol. 10, No. 2, p. 174. DOI: 10.1504/IJBIDM. 2015.069271
[16] Bonazzi G., Iotti M. (2016). Evaluation of investment in renovation to increase the quality of buildings: A specific Discounted Cash Flow (DCF) approach of appraisal, Sustainability, Vol. 8, No. 3, p. 268. DOI: 2071-1050/8/3/268
[17] Aste N., Caputo C., Buzzetti M., Fattore M. (2016). Energy efficiency inbuildings: What drives the investments? The case of Lombardy Region, Sustainable Cities and Societies, Vol. 20, pp. 27-37. DOI: 10.1016/j.scs.2015.09.003
[18] UNI EN 15459: 2008- Prestazione energetica degli edifici - Procedura di valutazione economica dei sistemi energetici degli edifici.
[19] Report Tassi della Banca di Italia, from https://www.bancaditalia.it, accessed on 2 March. 2016.