OPEN ACCESS
Reduction of energy consumption in educational buildings, and primarily in University buildings, is nowadays a relevant issue. The evaluation of the energy performance of these buildings is complex due to the variability in their construction age and their intermittent and wide variety of uses. In addition, these buildings are often characterized by a scarce availability of energy end use data, which makes challenging to benchmark energy performance and to inform energy policy decisions. To tackle this problem, this paper explores the use of simple indicators linking low-frequency available energy consumption data to variables measuring building characteristics and weather conditions. The use of such indicators is accompanied by detailed ad-hoc energy audits, including activities in the area of building management systems and dynamic energy simulation. The case study chosen is the Italian University of Modena and Reggio Emilia, which recently developed a Sustainability Plan targeting reductions in GHG emissions to 2020 and identified a framework for investment over the next 5 years to meet University targets. The results of the study shows that simple performance indicators can provide a first insight into the buildings energy performance and identify critical buildings that require detailed analysis. The results of the energy audits support the decision of actions to reduce heating and cooling energy consumption while maintaining acceptable thermal comfort for occupants.
energy planning, benchmark, energy audit, normalization, degree-days
Buildings account for approximately 40% of the total energy consumption in Europe and the sector is continuously expanding [1]. Reduction of energy consumption and the use of energy from renewable sources in the buildings sector constitute important measures to reduce the Union’s energy dependency and greenhouse gas (GHG) emissions [2,3].
Energy consumption in educational buildings, and primarily in University buildings, is usually high [4] and it represents a complex issue due to the variability in building construction age and the intermittent and wide variety of uses [5].
Energy planning is thus becoming more and more important for university campuses. Several universities put in place Sustainability Plans to reduce building energy consumption and GHG emissions [6]. The main aim of the energy planning is the identification of building stock criticalities and the definition of energy mitigation strategies. Knowledge of the characteristics of the building stock is essential for defining strategies for energy savings and for the calculation of those savings [7]. However, these buildings are often characterized by a scarce availability of energy end use data, which makes difficult the benchmark of their energy performance that would assist energy management decisions [8].
In order to achieve energy saving goals, detailed energy audits are presented in several studies as a valuable tool to support building managers identifying opportunities for reducing energy costs [4, 9-11]. It is also highlighted the added value of such activities in educational buildings as they can educate environmentally-aware citizens [10].
Due to the high number of buildings and the limited funds, detailed energy audits cannot be conducted for all the buildings in the stock and different procedures are presented in literature for the selection of the relevant buildings that deserve further analysis. In Escobedo et. al. [12] energy consumption of the campus was only available at building groups level and a representative sample of campus buildings and facilities was selected by category. Guan et al. [6] proposed a methodology based on coincidence factors and cluster analysis to identify buildings with the larger potential of operation optimization in a Norwegian University campus. The method makes use of long-term and real-time data of electricity, heating and water usage. However, high frequency data on energy end use are often not available for such large building stocks and a widespread monitoring system is in most cases too expensive to be implemented, and it however requires a lot of time to be designed, installed, and run for a statistically adequate time period. Therefore a qualitative evaluation of the building stock energy performance frequently represents the only viable solution.
Different authors explore methods based on the analysis of the available low-frequency energy end use data to draw conclusions on the building stock energy performance. Through a case study, Gallachóir et al. [8] assess the use of simple performance indicators, energy trends and the assessment of building energy performance. Deshko et al. [13] demonstrated the possibilities and problems of using certification to determine the university campuses energy efficiency measures.
This study tackles this issue by presenting a methodology for the assessment of energy performance of building stocks based on normalization of available energy consumption data and sample detailed energy audits. The selected case study is the University of Modena and Reggio Emilia (UNIMORE), which recently developed a Sustainability Plan setting in place target reductions in GHG emissions to 2020 and identified a framework for investment over the next 5 years to meet University targets.
The analysis starts with the evaluation of available information on building energy consumption and corresponding GHG emissions. The availability of meteorological data, building volumes, surfaces and opening hours allowed for the calculation of indicators for the short-term and long-term evaluation of the building stock energy performance and for the identification of criticalities indicating where deeper energy diagnoses are required. Results from the audits are then used as basis for the definition of different mitigation scenarios. In addition, the paper is also presenting lessons learned on the campus energy management. In contrast to most previous methods in the literature, the presented methodology is based on information at building level that is available with relative ease that guides the selection of sample detailed energy audits and the detection of low-cost energy efficiency measures. The methodology is therefore applicable also when real-time metering data or detailed energy audits are not available for all the buildings of the stock, as often occurs. The final goal is the development of a comprehensive analysis of the energy performance of educational building stocks which would support the definition of goals and objectives and the assessment of their effectiveness.
The paper is divided into five sections. After the introduction, an overview of the University energy consumption and corresponding GHG emissions is presented. The third section illustrates the methodology developed in the present study. The fourth section shows the results and the fifth section draws the conclusions.
2.1 General information of the targeted University
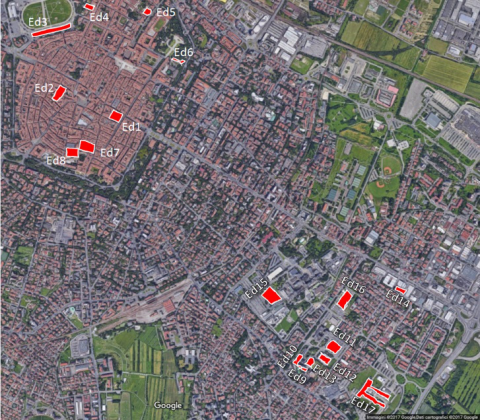
UNIMORE is composed by 14 Departments, divided in two Italian cities: Modena and Reggio Emilia. The building stock of Modena includes 22 main buildings while in Reggio Emilia there are 10 main buildings. In both cities, the buildings are located in 2 main areas, i.e. the city center and a suburban area (see Figure 1).
Figure 1. Location of the UNIMORE buildings in Modena (top) and Reggio Emilia (bottom)
2.2 University energy consumption and GHG emissions
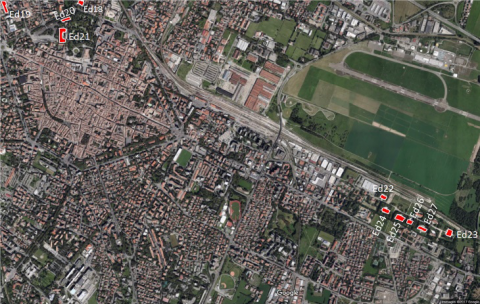
The heating systems of the buildings in Modena use natural gas, while the buildings in Reggio Emilia are connected to the local district heating network. Heating consumption data are available for the majority of the buildings with a 2-week interval as they have been collected by the system managers through meter readings. The values are thus all measured and not estimated. The seasonal heating consumption of each building is shown in Figure 2. It has to be noted that “Ed 17” refers to the aggregated gas consumption of 6 adjacent buildings for which only one gas meter is currently available.
Figure 2. Heating consumption of the UNIMORE buildings (heating season 2014-2015)
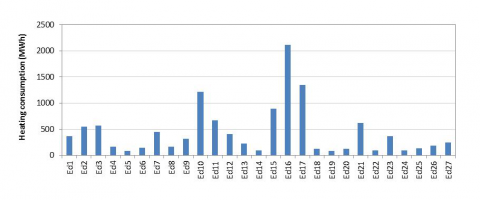
The average heating consumption of the buildings in the stock ranges between 100 MWh and 2000 MWh, showing a significant variability among the stock. Figure 3 shows the buildings share of total heating consumption of the University for the most recently available heating season (i.e. 2015-2016). It is possible to observe that the 5 largest energy consuming buildings are responsible for about 50% of the total heating consumption of the University (even though it has to be considered that “Ed 17” is an aggregated value).
Figure 3. Share of total energy consumption for heating of each UNIMORE building (heating season 2015-2016)
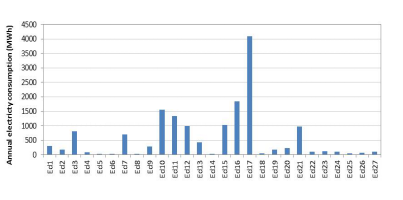
Electricity consumption data are available for all buildings from monthly energy billing and the data can refer to measured or estimated values. The annual electricity consumption of each building is shown in Figure 4 (where again “Ed 17” refers to the aggregated electricity consumption of 6 adjacent buildings for which only one meter was available).
Figure 4. Annual electricity consumption of the UNIMORE buildings (reference year 2015)
Figure 5 shows the buildings share of total electricity consumption of the University in 2015.
Figure 5. Share of total electricity consumption of each UNIMORE building (reference year 2015)
Similarly to the heating consumption, the 3 largest energy consuming buildings are responsible for 50% of the University electricity consumption.
The total yearly CO2 emissions for buildings energy consumption are about 9500 tons, considering CO2 emissions coefficients for natural gas, district heating and electricity of the Italian region Emilia Romagna, where all the buildings are located [14].
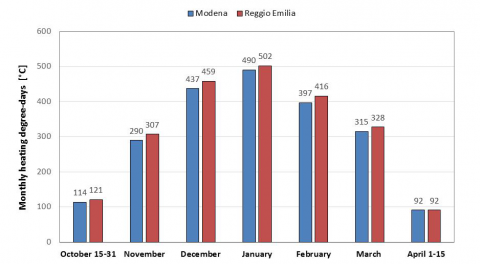
The University owns professional weather stations in both Modena and Reggio Emilia [15-16]. The hourly weather data include global radiation on horizontal, dry bulb temperature, wind speed and relative humidity. Figure 6 compares the profiles of the monthly heating degree-days for the two cities. One can verify that they are quite similar (i.e. seasonal difference in the range of 4%). Data reported in Figure 6 have been calculated with a single base temperature of 20 °C.
Figure 6. Monthly heating degree-days of Modena and Reggio Emilia (heating season 2014-2015). Elaboration from data collected by the UNIMORE weather stations.
3.1 Procedure for the selection of critical buildings
Regarding space heating, the energy consumption is generally available to the energy management as it is obtained from energy billing of meter readings and it can be used to identify the largest energy consuming buildings, responsible for a significant share of the total stock energy consumption and CO2 emissions. This analysis can be enriched with other information that would allow for a more comprehensive evaluation of the building stock in-use energy performance. In particular, a graphical method based on 2 axes plots can be used: the seasonal heating consumption (kWh) can be plotted on the x-axis while an energy performance indicator can be considered for the y-axis. By indicating axes averages, the plot area can be divided into 4 quadrants, where the top-right quadrant (Quadrant I) contains the buildings for which deeper energy diagnosis is primarily required. In fact, Quadrant I includes largest energy consuming buildings with lower energy performance according to the y-axes indicator. Quadrants II and III identify a secondary level of critical buildings while Quadrant IV includes the buildings with the lowest priority.
The commonly used weather-normalized heating consumption by volume QV (kWh/m3) can be considered as one of the simpler y-axes indicators to compare the energy performance of the different buildings in the stock:
$Q_{V}=\frac{Q}{V} \cdot \frac{G G_{r e f}}{G G}$ (1)
Since the heated volume V (m3) and degree days GG (°C) are often available for each building of the stock, this indicator should not require any additional effort for the energy management.
It has to be taken into account that heating degree-days are closely related with the concept of base temperature [17], which reflects the point at which buildings begin to need heating to maintain the required internal temperatures [18]. For the purpose of this study, a single base temperature of 20°C has been used for the degree-days calculation, representing an average value for the whole built stock and overall climate.
The benchmark based on QV is accounting for weather variability among the stock but it is not considering other influencing factors like building usage. In fact, by using QV as performance indicator, buildings with more opening hours may be incorrectly regarded as less efficient. Therefore, a proposal to improve the analysis includes an additional normalization of the energy consumption with number of building opening hours h, as defined by the following formula:
$Q_{V, n o r m}=\frac{Q}{V} \cdot \frac{h_{e f} \cdot G G_{r e f}}{h \cdot G G}$ (2)
This approach assumes a linear dependence of the energy consumption on degree-days and opening hours, in accordance with existing literature [19]. It has to be noted that QV,norm is not distinguishing for inefficiencies due to building envelope, system operation or end users behavior. More sophisticated indicators can thus be defined in the future to exclude building envelope dependence from the analysis to allow for a more effective detection of low-cost energy efficiency measures.
Concerning electricity consumption, yearly energy consumption is generally available to the energy management as it can be obtained from energy billing or low-frequency meter readings and it can be used as one of the relevant simple indicators showing the largest energy consuming buildings, responsible for a significant share of the total stock electricity consumption and CO2 emissions. The commonly used electricity consumption by surface QS (kWh/m2) can be considered as one of the simpler y-axes indicators. However, in the case of electricity consumption, the specific value provides less accurate indications on the energy performance, due to the fact that the baseload should be first identified. Therefore, the specific value for electricity may only be used to identify a first set of critical buildings in the right quadrants where high frequency data and sub-metering are necessary to further improve the analysis.
3.2 Detailed energy audits and targets setting
For the critical buildings identified primarily in Quadrant I and secondarily in Quadrants II and III, detailed energy audits are performed and targets setting is carried out. It has to be noted that some of the energy audits have been performed by University staff in collaboration with students in the framework of a university course. The analysis includes activities in the area of building management systems and dynamic energy simulation.
4.1 Application of the methodology to the case study
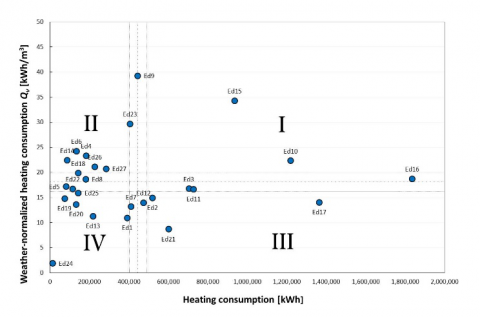
By plotting the heating consumption versus QV a first benchmark analysis can be performed for the UNIMORE buildings (see Figure 7).
Figure 7. Weather-normalized heating consumption by volume QV as energy performance indicator
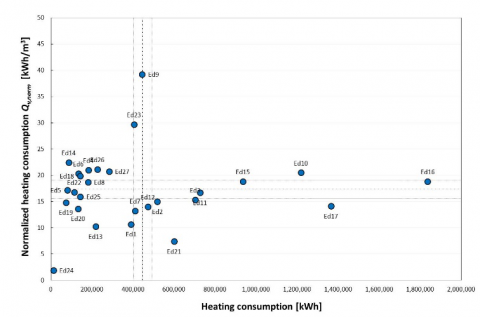
In particular, Figure 7 shows that the specific heating consumption has a significant variability among buildings, ranging from 10 kWh/m3 to 30 kWh/m3. From this first analysis, the most critical buildings appear to be Ed15, Ed10, Ed17, Ed9, Ed3, Ed11 and Ed23. Thanks to the availability of buildings opening hours, an additional normalization is obtained by the use of QV,norm as performance indicator (see Figure 8). In order to collect this information, a special tool was created to record weekly opening hours of each building.
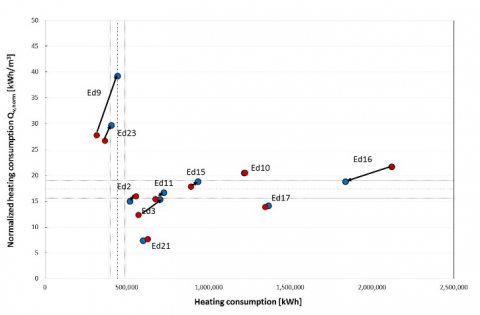
Figure 8. Normalized heating consumption by volume QV,norm as energy performance indicator
The normalization on heating degree-days does not provide significant modifications for this particular case study. This is due to the fact that the degree-days are rather similar for the two cities. On the contrary, normalization based on opening hours provides considerable modifications to some buildings relative positions. In fact, seasonal opening hours vary significantly among the buildings of the stock, as it generally occurs. Opening hours for these type of buildings can be very variable especially for the ones intermittently occupied, like museums and ceremony buildings. For example, it can be observed that for one of the largest consuming buildings (i.e. Ed15) the level of performance increases significantly when using QV,norm compared to the value obtained from the use of QV.
Figure 9. Long-term evolution of QV,norm (kWh/m3)
In addition, the long-term evolution of QV,norm is monitored for the last 2 heating seasons showing different trends for the buildings in the stock (see Figure 9). The results allow detecting for which buildings the combined effect of system inefficiencies and building use caused a significant decrease in their energy performance. Therefore the trends highlight which buildings deserve further analysis as both heating consumption and inefficiencies unexpectedly increased in the period considered.
Regarding electricity consumption, the available yearly electricity consumption per surface is used to benchmark buildings (see Figure 10).
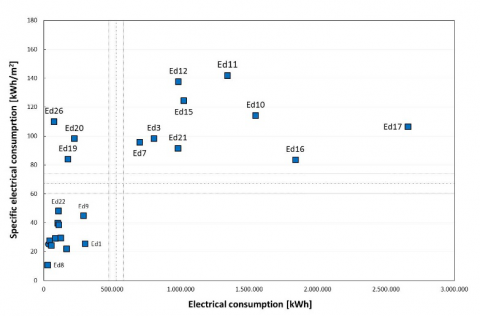
Figure 10. Specific electricity consumption QS (kWh/m2) as energy performance indicator
Figure 10 shows that the 50% largest consuming buildings are all located in Quadrant I. For all these buildings further analysis are envisaged through sub metering and high frequency data, where a monitoring system has been designed.
4.2 Target setting and lessons learned
The detailed energy audits allow identifying different low-cost energy efficiency measures that would reduce CO2 emissions by approximately 20%.
Boosting the awareness of all users involved in the building, from administrative and technical staff to professors and students, is also identified as a long-term strategy to reduce energy consumption.
The public sector should lead the way in the field of energy performance of buildings. The availability of energy consumption data, administrative data and building usage, together with the resources allocated, defines the limits for the level of accuracy of the energy performance analysis.
It is envisaged that the successful implementation of the methodology suggested in this study will enhance University energy management capabilities while reducing their energy consumption and GHG emissions.
In particular, the methodology has shown its capability to identify a first set of critical buildings where detailed energy audits, high frequency data and sub-metering are necessary to further improve the analysis. For these buildings low-cost energy efficiency measures can often be implemented reducing significantly energy consumption and GHG emissions while limiting investment costs. The methodology is based on information which is normally available and requires only a limited effort for the energy management to be collected and elaborated. The short and long-term trends of the presented indicators allow monitoring the combined effect of envelope properties, system inefficiencies and building use highlighting situations which primarily deserve further analysis for low-cost energy efficiency measures.
The assumption of a linear dependence of the energy consumption on degree-days and opening hours will be verified in future work. It will also be investigated the possibility to define a base temperature for each building taking into account internal and solar gains as well as an appropriate adjustment factor which takes into account building envelope energy performance.
The authors would like to acknowledge the UNIMORE Engineering Department “Enzo Ferrari” that partially funded this study. The authors are also grateful to the UNIMORE Buildings and Estates Office for the data provided to support this research.
|
GG |
Heating degree-days, °C |
|
h |
Opening hours, h |
|
Q |
Primary energy consumption, kWh |
|
V |
volume, m-3 |
|
h |
Opening hours, h |
|
Subscripts |
|
|
norm |
Normalized |
|
ref |
Reference |
|
v |
By volume |
[1] EU Directive 2010/31 of the European Parliament and of the Council of 19 May 2010 on the energy performance of buildings (recast). Off. J. Eur. Union. L153/13, 18.06.2010. 2010.
[2] Genco A., Viggiano A., Rospi G., Cardinale N., Magi V. (2015). Dynamic modeling and simulation of buildings energy performance based on different climatic conditions, International Journal of Heat and Technology, Vol. 33, No. 4, pp. 107-116.
[3] Delmastro C., Mutani G. and Perassi S. (2016). In use monitoring of public buildings. Case study in north Italy, International Journal of Heat and Technology, vol. 34, no. 2, pp. 266-276.
[4] Sekki T., Airaksinen M., Saari A. (2015). Measured energy consumption of educational buildings in a Finnish city, Energy Build., Vol. 87, pp. 105-115.
[5] Magli S., Lodi C., Contini F.M., Muscio A., Tartarini P. (2016). Dynamic analysis of the heat released by tertiary buildings and the effects of urban heat island mitigation strategies, Energy Build., Vol. 114, pp. 164-172.
[6] Guan J., Nord N., Chen S. (2016). Energy planning of university campus building complex: Energy usage and coincidental analysis of individual buildings with a case study, Energy Build., Vol. 124, pp. 99-111.
[7] Mata É., López F., Cuchí A. (2009). Optimization of the management of building stocks: An example of the application of managing heating systems in university buildings in Spain, Energy Build., Vol. 41, No. 12, pp. 1334-1346.
[8] Gallachóir B.P.Ó., Keane M., Morrissey E., O’Donnell J. (2007). Using indicators to profile energy consumption and to inform energy policy in a university - A case study in Ireland, Energy Build., Vol. 39, No. 8, pp. 913-922.
[9] Gul M.S., Patidar S. (2015). Understanding the energy consumption and occupancy of a multi-purpose academic building, Energy Build., Vol. 87, pp. 155-165.
[10] Bernardo H., Antunes C.H., Gaspar A., Pereira L.D., da Silva M. G. (2017). An approach for energy performance and indoor climate assessment in a Portuguese school building, Sustain. Cities Soc., Vol. 30, pp. 184-194.
[11] Cascio E.L., Ma Z., Borelli D. (2017). Schenone C., Residential building retrofit through numerical simulation: A case study, Energy Procedia, Vol. 111, pp. 91-100.
[12] Escobedo A., Briceño S., Juárez H., Castillo D., Imaz M., Sheinbaum C. (2014). Energy consumption and GHG emission scenarios of a university campus in Mexico, Energy Sustain. Dev., Vol. 18, pp. 49-57.
[13] Deshko V.I., Shevchenko O.M. (2013). University campuses energy performance estimation in Ukraine based on measurable approach, Energy Build., Vol. 66, pp. 582-590.
[14] Regione Emilia-Romagna - Servizio Energia, Indicazioni metodologiche per l’applicazione dei fattori di conversione al metodo di calcolo di cui alla DGR 967/2015 e alla DGR 1275/2015, 2015. [Online] . Available: http://energia.regione.emilia-romagna.it/entra-in-regione/norme-e-atti-amministrativi/certificazione-energetica/certificazione-energetica/DOC_INDIRIZZO_fattoridiconversione_2.pdf.
[15] Lombroso L. (2012). Annuario delle osservazioni meteoclimatiche dell anno 2012 registrate dall Osservatorio Geofisico di Modena., Atti SocNatMat Modena.
[16] Magli S., Lodi C., Lombroso L., Muscio A., Teggi S. (2015). Analysis of the urban heat island effects on building energy consumption, Int. J. Energy Environ. Eng., Vol. 6, No. 1, pp. 91-99.
[17] Lindelöf D. (2017). Bayesian estimation of a building’s base temperature for the calculation of heating degree-days, Energy Build., Vol. 134, pp. 154-161.
[18] ISO, ISO 15927-6:2007 - Hygrothermal performance of buildings -- Calculation and presentation of climatic data -- Part 6: Accumulated temperature differences (degree-days). [Online] . Available: https://www.iso.org/standard/35564.html. [Accessed: 10-Apr-2017] .
[19] Corgnati S.P., Corrado V., Filippi M. (2008). A method for heating consumption assessment in existing buildings: A field survey concerning 120 Italian schools, Energy Build., Vol. 40, No. 5, pp. 801-809.