OPEN ACCESS
During the whole history of the planet, astronomical factors (orbital and solar variability) have determined the energy balance of the Earth and generated natural climate oscillations affecting the life of plants, animals and human beings at all time scales. During the last decades, severe concerns have been raised about whether human activities could have been so influential as to deeply modify the natural variability of the global climate and, in particular, could have caused a significant warming since the beginning of the 20th century. To properly address the latter issue, it is required to understand the phenomenology of the natural climate fluctuations. These are well emphasized by several climate indexes such as the Atlantic Multidecadal Oscillation, the Pacific Decadal Oscillation, the El Niño–Southern Oscillation and others. This complex natural dynamic is still not reproduced by the general circulation models (GCMs) supporting the Anthropogenic Global Warming Theory (AGWT), which is mainly advocated by the Intergovernmental Panel on Climate Change (IPCC). In this “part 1” of our work we briefly introduce the general topic and statistically compare observed and GCM modeled global surface warming trends from 1860 to 2016. We find that the models have significantly overestimated the observed warming during the historical record. In addition, we compare observed and modeled temperature trends of three significant periods: from Jan/1922 to Dec/1941, from Jan/1980 to Dec/1999 and from Jan/2000 to Dec/2016. We find that only during the 1980-1999 period the observed and synthetic records show compatible warming trends within the 95% confidence level. The severe discrepancy between observations and modeled predictions found during the 1922-1941 and 2000-2016 periods further confirms, according to the criteria proposed by the AGWT advocates themselves, that the current climate models have significantly exaggerated the anthropogenic greenhouse warming effect.
climate change, post 2000 temperature standstill, climate models, natural climatic oscillations
Weather and climate are different concepts: the former is related to short-term and small-scale strong fluctuations of the atmospheric conditions (e.g. temperature, humidity, pressure, rain, etc.) of the planet or of a local region, while the latter regards the long-term average of the same parameters. While it is well known that weather changes significantly day after day, the environmental situation and the climate along the history of our planet have also changed, but moderately: in brief, the Earth has never been in equilibrium conditions [1]. Solar activity and orbital variations have been the main driving factors of the natural climatic oscillations yielding to periods far hotter or cooler than those of present times [2]. However, the mechanisms and the interactions explaining these changes have not yet been completely understood, in spite of the progress of science and technology.
Although on short time scales climatic changes may appear minor compared to weather fluctuations, they have long-term major effects in determining whether entire regions of the Earth will get warmer or cooler, wetter or drier. Thus, the history of mankind has been deeply influenced by climatic and environmental occurrences [3]. Nobody disputes that people have contributed to modify local environment, but it would be misleading to assume that mankind has been the main actor of a significant global climate change without a full comprehension of the physical related issues. A lot of parameters are involved in the climatic and environmental history. Understanding the causes of climate changes, their connections and their feedbacks is a great challenge.
The extreme difficulty to link and match all involved factors would suggest cautiousness in declaring our certitudes about future climate developments for deciding policies. However, in the last decades some organizations and groups of scientists and politicians, even at the highest levels, seem to have been and still be very sure of their alarming climate scenarios, which have been advocated mostly by the United Nations Intergovernmental Panel on Climate Change (IPCC) [6, 7, 8]. In particular, the most widespread opinion is that the 20th century climate warming has depended almost completely on human activities and will continue to do so in the future: this is known as the Anthropogenic Global Warming Theory (AGWT). The AGWT statements have been dominating both the scientific literature and the political decisions, including grants for research funds and economic incentives, which are mainly oriented towards initiatives that follow the “politically correct” majority current of thought. However, since knowledge is continuously progressing, scientists should also fairly acknowledge uncertainties and consider novel scientific findings.
Figure 1. [A] Northern hemisphere proxy temperature reconstruction, known as the Hockey Stick, published by the IPCC in 2001 after Mann et al. (1999). [B] Northern hemisphere proxy temperature reconstructions published after 2005 showing a millennial oscillation [12-15]
Before attempting to predict the future, it is necessary to test whether the past climate changes have been properly understood and integrate the information that can be drawn from multiple sources including historic archives and testimonies, such as archaeological findings, artistic creations, geological sediments, physics and astronomy. The whole information needs to be used to produce and evaluate proxy reconstructions of the past climate. Then, all information must be integrated to properly interpret the instrumental global climatic records, which are globally available only since 1850.
For example, as already extensively explained elsewhere [7, 8, 9], the AGWT was globally advocated by the IPCC in 2001 because it appeared to be supported by the ‘infamous’ Hockey Stick temperature reconstructions by Mann et al. [10] and by specific computer climate models mainly based on radiative forcings [4,11]. Those temperature reconstructions claimed that only a very modest change in the Northern Hemispheric climate had occurred during the pre-industrial times from A.D. 1000 to 1900, while an abrupt warming did occur just in the last century: see Figure 1A. Energy balance and general circulation climate models (GCM) were used to interpret the Hockey Stick climatic pattern as due mostly to anthropogenic greenhouse gas emissions such as CO2 because of coal and oil fuel consumption, which has been accelerating since the beginning of the 20th century [11].
However, since 2005 novel Northern Hemisphere proxy temperature reconstructions were published [12-15] revealing the existence of a large millennial oscillation that contradicts the Hockey Stick temperature pattern: see Figure 1B. The new findings were consistent with alternative climatic and solar activity records showing that a quasi-millennial oscillation occurred throughout the entire Holocene for the last 10,000 years [16, 17]. Thus, the existence of a large millennial climatic oscillation would definitely question the reliability of the climate models used to support the AGWT by suggesting that a significant percentage, about 50%, of the warming observed since 1850 could be natural [7, 8].
Historic research helps greatly to evaluate the credibility of the two above alternative climate proxy reconstructions for the last millennia. Our historical testimonies, mainly referred to the European and Mediterranean area, are qualitative and indirect: they mostly regard climatic effects on the life of populations in the various regions [3]. Ancient settlements were established in areas relatively rich of water and characterized by mild to warm climate: these environmental conditions favored agriculture and allowed the people to have sufficient amount of food. When the climate became less favorable, new regions were explored and colonized.
The ancient testimonies often mention phenomena that had a remarkable influence on the life of a given (small or big) community. Many accounts are referred to negative, sometimes catastrophic events such as long periods of drought or low temperature, causing scarcity of food, famine and then little resistance to illness, epidemic and poverty. Whereas warm periods have generally been more favorable. We can check this statement looking at the main climatic periods of the Mediterranean and European area that can be derived from chronicles and other records:
The aforementioned historical climatic inferences are quite generic but they are definitely sufficient to question the Hockey Stick temperature reconstructions used to validate the climate models that, in fact, have supported the AGWT since 2001 by the IPCC. They clearly support the reliability of the most recent climatic reconstructions that reveal the existence of large quasi millennial natural climatic oscillations, as Figure 1B shows.
Furthermore, the above historical inferences are today supported by a wide body of scientific literature. It has been established that the Medieval Warm Period (MWP) was globally extended [18,19]. The MWP, from the IX to the XIII century, seems to have been equivalent to or even exceeded the A.D. 1961-1990 mean temperature level in the extra-tropical Northern Hemisphere [14].
In this regard, note that the Medieval temperature reconstructions are based on proxy models and should not be directly compared against the modern instrumental temperature records as Mann et al. [10,13] did because recent proxy records diverge from instrumental temperatures that show higher readings when compared against proxies [20]. This is known as the “divergence problem” and suggests that un-modeled non-linearity characterizes the relation between instrumental temperatures and proxies. Consequently, the real Medieval temperature could have been higher than what currently estimated using linear proxy models.
A lot of bucking phenomena cause unexpected modifications, indicating that the climate is the result of a very complex series of phenomena. There are also catastrophic climatic events caused by violent meteorite impacts and volcano eruptions. An example is the big eruption of Mount Tambora (Indonesia) that occurred in April 1815. Its impact ravaged in the entire Northern Hemisphere for about two years [21]. In the August of the subsequent 1816, which was called “the year without a summer”, the average temperature fell down of a few Celsius degrees, keeping agriculture from supplying sufficient food and causing poverty and famine in an Europe already upset by the Napoleonic wars. However, since 1850 only modest volcano eruptions occurred causing minor and short cooling spikes.
The climate is also characterized by an important multi-decadal variability. Since 1850 several 30-year trend-reversals have been observed such as: a warming from 1850 to 1880; a cooling from 1880 to 1910; a warming again from 1910 to 1940; a cooling from 1940 to 1970; then the temperature increased again from 1970 to 2000. Finally, for almost 20 years since 1998, the global surface temperature has been relatively stable: this period has been called the “pause” or the “global warming hiatus” by the AGWT advocates [22, 23]. This label was chosen to indicate that the observed temperature stand-still period results from an unforced internal fluctuation of the climate that the computer climate models were claimed to occasionally reproduce without contradicting the AGWT paradigm [22, 23] In addition to the above evident quasi 60-year oscillation, the climate is also characterized by other fluctuations caused mostly by in terannual, decadal and bidecadal oscillations [7, 8].
In the following, we will discuss the trend divergences observed during some specific periods between the climate models predictions and the temperature records. First, we compare the trends involving the entire historical global surface temperature record from 1860 to 2016 to evaluate the overall performance of the climate models in reproducing the observed warming. Then, we focus our attention on three specific two-decadal periods.
Two of these periods (1922-1941, 1980-1999) were selected because they are characterized by a strong and compatible warming rate but by very different anthropogenic emission rate. By contrast, the 2000-2016 period is characterized by a very strong increase of anthropogenic emissions while the temperature has been quasi stationary.
The importance of evaluating the performance of the climate models in reproducing the observed 20-years-long trends is because the probability that the predictions could repeatedly differ from the observations as due to some internal climatic variability dynamic for periods longer than about 15 years becomes vanishingly small. In fact, Meehl et al. [22] showed that GCMs could simulate hiatus periods by occasional deep-ocean heat uptake, by simulating, at random times, an up-to-a-decade of steady temperature despite an increasing anthropogenic forcing. In 2009 AGWT advocates acknowledged that: “Near-zero and even negative trends are common for intervals of a decade or less in the simulations, due to the model's internal climate variability. The simulations rule out (at the 95% level) zero trends for intervals of 15 year or more, suggesting that an observed absence of warming of this duration is needed to create a discrepancy with the expected present-day warming rate” [24]. Thus, according to the AGWT advocates own criteria, a divergence between observations and climate models occurring at the bi-decadal scale would provide strong convincing evidences that the GCMs used to support the AGWT are severely flawed.
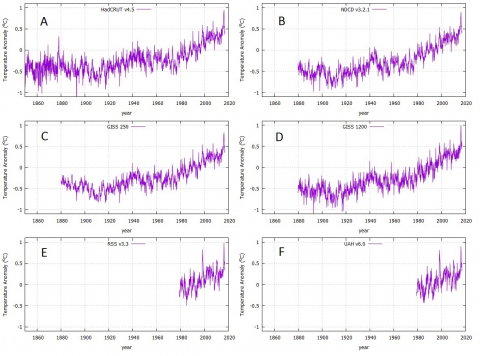
The following climatic and GCM records are used for this study. All records were downloaded from KNMI Climate Explorer (https://climexp.knmi.nl): see Figures 2 and 3. Three global monthly average land and sea surface temperature records are available: HadCRUT, NCDC and GISS. The HadCRUT record is available since 1850 and is produced by a cooperative effort between the Hadley Centre for Climate Prediction and Research and the University of East Anglia's Climatic Research Unit (CRU), UK [25]. The NCDC record is available since 1880 and is prepared by the National Climatic Data Center [26], USA. The GISS record is available since 1880 and is made available by the Goddard Institute for Space Studies (GISS), at Columbia University, New York City, USA [27]. The GISS record is available in two formats according to a 250 km and a 1200 km spatial interpolation, respectively.
Figure 2. The six temperature records herein analyzed with a monthly resolution
Two satellite based monthly average global lower troposphere temperature records are available: UAH and RSS (28, 29). The UAH record is available since December 1978. It is provided by the National Oceanographic and Atmospheric Administration (NOAA) TIROS-N satellite both at the Global Hydrology and Climate Center, University of Alabama at Huntsville, USA [28]. The RSS record is available since January 1979 and uses remote sensing systems data obtained by the National Oceanographic and Atmospheric Administration (NOAA) TIROS-N satellite [29].
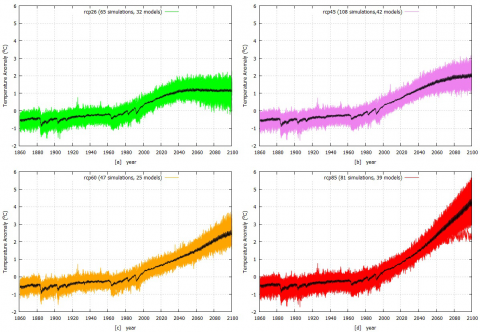
We adopt the general circulation model simulations of the Coupled Model Inter-comparison Project Phase 5 (CMIP5) (http://cmip-pcmdi.llnl.gov/) prepared under the World Climate Research Program (WCRP) and the Working Group on Coupled Modelling (WGCM). These climate simulations have been used by the IPCC Fifth Assessment Report [6]. The records herein considered are 301 GCM simulations from 1860 to 2100 using historical radiative forcings from 1860 to 2006 and four alternative emission representative concentration pathways (RCP): RCP26, RCP45, RCP60, and RCP85, which are named after a possible range of radiative forcing values in the year 2100 relative to pre-industrial values (+2.6, +4.5, +6.0, and +8.5 W/m2, respectively). The following run members are available: for RCP26, 65 simulations from 32 models; for RCP45, 108 simulations from 42 models; for RCP60, 47 simulations from 25 models; for RCP85, 81 simulations from 39 models.
The six temperature records herein analyzed are nearly identical. These records highlight that since 1850 the global surface temperature has increased by about 0.9oC. However, the warming has not been monotonic. The 1850-1880, 1910-1940 and 1970-2000 have mostly been warming periods. The 1880-1910 and 1940-1970 have mostly been cooling periods, while since 2000 the temperature has mostly remained nearly stable. The above empirical evidence yields to a quasi 60-year oscillation modulating a warming trend [7, 8].
Figure 3 shows the four sets of GCM simulations. From 1860 to 2006 the GCMs were forced with the known historical radiative forcings and, therefore, the four mean simulations indicated in the black curves appear identical. Since 2006 the curves diverge because of the different adopted RCP scenario for each set. These GCM simulations show a quite monotonic warming from 1860 to 2100, which is briefly interrupted by cooling episodes related to major volcano eruptions such as Krakatoa (1883), Santa María (1902), Mount Agung (1963), El Chichón (1982) and Mount Pinatubo (1991).
Note that the GCM volcano signature is overestimated relative to the observations. For example, the GCM Krakatoa modeled cooling signature in 1883 and following years is hardly visible in the temperature records depicted in Figure 2. Also, the quasi 60-year oscillation clearly observed in the temperature record is missing in the GCM records.
Figure 3. The four sets of GCM simulations from the CMIP5 GCMs herein analyzed. Each set refers to a different RCP radiative forcing curve for the period 2006-2100
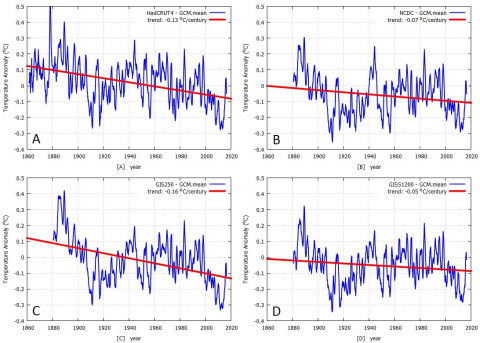
Figure 4 depicts the discrepancy between each of the four secular surface temperature records depicted in Figure 2A-D and the GCM mean simulation curve shown in Figure 3 with the black lines. Each record was low-pass filtered with a 12-month moving average. The zero level in the graphs represents the 1980-2000 average. The four diagrams are obtained by simply subtracting the average GCM simulation from the temperature data. The figures highlight the natural variability of the climate system not reproduced by the GCMs. In fact, the observations differ significantly from the computer simulations. The fast inter-annual oscillations due to the ENSO variability are clearly not reproduced up to a maximum divergence of +0.5 oC observed at the occurrence of the 1878 super El-Niño event. Moreover, divergences up to ± 0.3 oC are also observed at the decadal scale. In particular, the GCMs fail to reproduce upward or downward trends of 30-year intervals as observed in the 1850-1880, 1880-1910, 1910-1940 and 2000-2017 periods. The period 1940-1970 is poorly reproduced at the decadal scale, while only the 1970-2000 period appears better reproduced by the GCM-mean simulation. The four diagrams also show a clear secular negative trend, which indicates that since 1860 (for the HadCRUT) and since 1880 (for the NCDC and the two GISS records), the GCM simulations have predicted a secular global surface warming that is 0.10 ± 0.05 oC/century larger than the observed one. Thus, the evaluated discrepancy in the secular warming trend between the observational records and the CMIP5 GCM mean prediction has a 95% confidence.
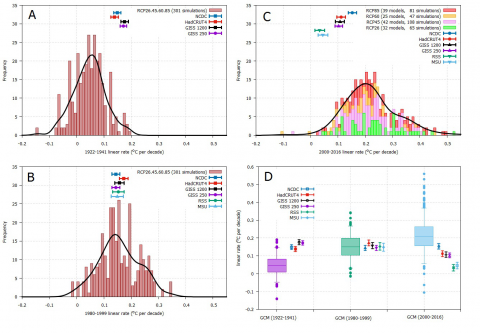
Figure 5 depicts the statistics of the variability in the decadal linear rate between the available 301 monthly resolved individual GCM simulations and the 6 monthly temperature records in three relevant time intervals suggested by the results depicted in Figure 4: 1922-1941 and 1980-1999 and 2000-2016. The diagrams 5A and 5B refer to the GCM simulations in the intervals 1922-1941 and 1980-1999: these use the same historical forcing functions.
The diagrams 5C refer to the GCM simulations in the interval 2000-2016 and are separated according to the four RCP scenarios. The diagram D depicts boxplots of the three sets of linear decadal rate shown in 5A-C. The quartile boundaries are determined such that 1/4 of the points have a value equal or less than the first quartile boundary, 1/2 of the points have a value equal or less than the second quartile (median) value, and 3/4 of the points have a value equal or less than the third quartile boundary. The two whiskers span from 5% to 95% of the 301 points in each of the three sets. All points that lie outside the range of the whiskers are considered outliers. Each diagram also depicts the decadal linear rate trends of the six temperature records shown in Figure 2 in each of the three intervals. Table 1 summarizes the various results. Note that the trends reported in Figs. 5C-D and in Table 1 referring to the 2000-2016 period are those calculated after that the El Niño–Southern Oscillation signature is removed from the data as explained in Ref. [32].
Figure 5 and Table 1 reveal that in the three selected time intervals (1922-1941, 1980-1999, 2000-2016) the GCM simulations show a progressively increasing warming rate, which is essentially consistent with the accelerating increase of the radiative forcing, mostly driven by CO2 emissions.
However, the temperature records show a different behavior. The observed mean global temperature trend for the period 1922-1941 is significantly higher than the GCM predictions with a statistical confidence larger than 95%, with that observed 60 years later in the period 1980-1999. In the period 1980-1999 the observed global temperature rate trend is compatible with that of the GCM predictions. In the period 2000-2016, the observed mean global temperature rate trend is lower than those observed in 1922-1941 and 1980-1999, and is significantly lower than that of the GCM predictions with a statistical confidence larger than 95%. The statistical confidence was calculated on a simultaneous mean and variance Student-t test comparison [30].
Figure 4. Diagrams showing the discrepancy between the temperature records (Fig. 2A-D) and the mean GCM simulation (Fig. 3). We simply subtracted the model average prediction from the temperature data. The “zero” represents the 1980-2000 average value
Table 1. Statistics of the linear rate
|
|
1922-1941 |
1980-1999 |
2000-2016 |
|
|
oC/decade |
oC/decade |
oC/decade |
|
GCMs (5%) |
-0.470 |
0.031 |
0.056 |
|
GCMs (25%) |
0.008 |
0.102 |
0.155 |
|
GCMs (50%) |
0.046 |
0.151 |
0.209 |
|
GCMs (75%) |
0.083 |
0.199 |
0.265 |
|
GCMs (95%) |
0.146 |
0.268 |
0.369 |
|
Mean GCM |
0.046 ± 0.058 |
0.156 ± 0.073 |
0.219 ± 0.096 |
|
MSU |
|
0.149 ± 0.022 |
0.045 ± 0.018* |
|
RSS |
|
0.153 ± 0.021 |
0.033 ± 0.018* |
|
GISS.250 |
0.172 ± 0.012 |
0.144 ± 0.014 |
0.103 ± 0.014* |
|
GISS.1200 |
0.176 ± 0.014 |
0.157 ± 0.017 |
0.107 ± 0.016* |
|
HadCRU4 |
0.139 ± 0.014 |
0.173 ± 0.016 |
0.112 ± 0.016* |
|
NCDC |
0.149 ± 0.014 |
0.144 ± 0.014 |
0.153 ± 0.015* |
|
Mean Temp. |
0.159 ± 0.022 |
0.153 ± 0.020 |
0.092 ± 0.048* |
Note 1. The rows 1-5 report the percentiles of the linear rate trend of the GCM simulations in the three-time intervals Jan/1922-Dec/1941, Jan/1980-Dec/1999 and Jan/2000-Dec/2016. The rows 6-10 report the linear rate trend of the six temperature records in the same three-time intervals. Data depicted in Figure 5A-D. (*) The trend is calculated after removing the ENSO temperature signal [32] as proposed in Scafetta et al.
Data analysis of the instrumental temperature records evidences that the climate has warmed by about 0.9oC since 1850. However, in the light of a quasi-millennial natural climatic cycle, the presence of a global warming since 1850 can still be partly explained as the natural tendency of climate to recover from the 1600-1700 Little Ice Age. There is no doubt that human activities have become more and more important during the last century but climatic models need to be properly evaluated in particular if they are employed to predict future climate scenarios so to justify particularly expensive policies.
As a matter of facts, we found that the current GCMs are quite unsatisfactory. While the anthropogenic emissions and, in particular, CO2 have been monotonically increasing, the warming observed since 1850 has not been monotonic. This yields to our first finding (Figure 4) that from 1860 to 2016 the CMIP5 GCMs simulations predict an excessive warming relative to the four available long global surface temperature records: see Figure 4.
We have also explicitly compared the observed and simulated warming trends during three selected time intervals (1922-1941, 1980-1999, 2000-2016) and found out that while the temperature of the globe warmed in an equal way during the 1922-1941 and 1980-1999 periods, the climate simulations predict a significantly lower warming in 1922-1941 than in 1980-1999 (Figure 5). The simulations mirror the well-known fact that the anthropogenic emissions accelerated after 1950 [5,6,7] but here we showed that the climate deviates from the simulations with a statistical confidence larger than 95%. The fact is that there was a strong warming during the first half of the century from about 1910 to 1940 that cannot be explained by the anthropogenic emission alone or by the radiative forcings used in the models taken into account by the IPCC.
During the period Jan/2000 to Dec/2016, the anthropogenic emissions were still accelerating and the CMIP5 simulations predicted a warming rate even stronger than what experienced in the 20th century. Instead, all six available global temperature records depicted in Fig. 2 showed on average just a modest warming that again differs significantly from the GCM simulations with statistical confidence larger than 95%.
Figure 5. [A, B, C] Distribution of the linear rate trends of the 301 GCM individual simulations versus the six temperature records in the three time intervals Jan/1922 - Dec/1941, Jan/1980 - Dec/1999 and Jan/2000 - Dec/2016. [D] Percentile diagrams of the same: the statistical intervals of the boxplots are 5%, 25%, 50%, 75% and 95%
Statistical analysis clearly shows that the observations and the CMIP5 GCM simulations significantly differ in at least two periods of 20 years (1922-1941) and 17 years (2000-2016). This is sufficient to conclude that the CMIP5 models used by the IPCC [6] to advocate the AGWT are flawed according to the same criteria established by the AGWT advocates themselves. In fact, a few years ago it was acknowledged that whether such discrepancies had to occur for more than 15 years, that would have questioned the physical reliability of the used climate models [22, 24].
We note that among the global surface temperature records, the one that manifests a 2000-2016 warming trend closer to that of the CMIP5 GCMs is the NCDC: it shows a decadal trend of 0.193 ± 0.018oC/decade (without removing the ENSO signal) and 0.153 ± 0.015oC/decade (removing the ENSO signal) versus a mean GCM trend of 0.219 ± 0.096oC/decade. However, the behavior of the NCDC records is clearly inconsistent with that observed by the other records, and the divergence is maximum versus the satellite based UAH and RSS records. Indeed, it has been recently found that errors in the NCDC temperature model have produced a spurious warming trend [31].
In conclusion, the temperature records clearly manifest several fluctuations from the inter-annual scale to the multi-decadal one. Detailed spectral analyses have determined the likely existence of harmonics at about 9.1, 10.5, 20 and 60-year periods [7, 8, 9]. By contrast, the CMIP5 GCMs simulations (Figure 3) used by the IPCC (2013) to advocate the AGWT show a quite monotonic accelerating warming since 1860, which is at most temporarily interrupted by volcano eruptions and only slightly modulated by aerosol emissions. Thus, the models are not able to reproduce the natural variability observed in the climate system and should not be trusted for future energy planning [33].
It has been suggested that non-radiative physical processes connected with solar activity and the “resonant” orbital motions of the moon and the planets can cast light on the otherwise incomprehensible temperature fluctuations [34, 35]. In fact, the magnetic activity of the sun and, probably, also the planetary motions modulate both the solar wind and the flux of the cosmic rays and interstellar dust on the earth with the result of a modulation of the clouds coverage.
[1] Fergus G. (2015). Temperature of planet earth, from http://gergs.net/2015/06/updating-the-geological-temperature-plot/all_palaeotemps/, accessed on 31/08/2017
[2] Hoyt D.V., Schatten K.H. (1977). The Role of the Sun in the Climate Change, Oxford Univ. Press, New York.
[3] Guidoboni E., Navarra A., Boschi E. (2011). The Spiral of Climate: Civilizations of the Mediterranean and Climate Change in History, Bononia University Press, Bologna Italy.
[4] Intergovernmental Panel on Climate Change (IPCC). (2001). Climate Change 2001: The Physical Science Basis: Third Assessment Report.
[5] Intergovernmental Panel on Climate Change (IPCC). (2007). Climate Change 2007: The Physical Science Basis: Fourth Assessment Report.
[6] Intergovernmental Panel on Climate Change (IPCC). (2013). Climate Change 2013: The Physical Science Basis: Fifth Assessment Report.
[7] Scafetta N. (2013). Solar and planetary oscillation control on climate change: hind-cast, forecast and a comparison with the CMIP5 GCMS. Chapter in “Mechanisms of Climate Change and the AGW Concept: a critical review”, Energy & Environment, Vol. 24, No. 3-4, pp. 455-496. DOI: 10.1260/0958-305X.24.3-4.455
[8] Scafetta N. (2013). Discussion on climate oscillations: CMIP5 general circulation models versus a semi-empirical harmonic model based on astronomical cycles” Earth-Science Reviews, Vol. 126, pp. 321-357. DOI: 10.1016/j.earscirev.2013.08.008
[9] Scafetta N. (2016). Problems in Modeling and Forecasting Climate Change: CMIP5 General Circulation Models versus a Semi-Empirical Model Based on Natural Oscillations, International Journal of Heat and Technology, Vol. 34, No. Sp. 2, pp. S435-S442. DOI: 10.18280/ijht.34S235
[10] Mann M.E., Bradley R.S., Hughes M.K. (1999). Northern hemisphere temperatures during the pastmillennium: inferences, uncertainties, and limitations, Geophys. Res. Lett., Vol. 26, pp. 759-762. DOI: 10.1029/1999GL900070
[11] Crowley T.J. (2000). Causes of climate change over the past 1000 years, Science, Vol. 289, pp. 270-277. DOI: 10.1126/science.289.5477.270
[12] Moberg, A., Sonechkin, D. M., Holmgren, K., et al. (2005). Highly variable Northern Hemisphere temperatures reconstructed from low and high resolution proxy data, Nature, Vol. 433, pp. 613–617. DOI: 10.1038/nature03265
[13] Mann M.E., Zhang Z., Hughes M.K., et al. (2008). Proxy-based reconstructions of hemispheric and global surface temperature variations over the past two millennia, PNAS, Vol. 105, pp. 13252-13257. DOI: 10.1073/pnas.0805721105
[14] Ljungqvist F.C. (2010). A new reconstruction of temperature variability in the extra-tropical Northern Hemisphere during the last two millennia, Geogr. Ann. A, Vol. 92, pp. 339-351. DOI: 10.1111/j.1468-0459.2010.00399.x
[15] Christiansen B., Ljungqvist F.C. (2012). The extra-tropical Northern Hemisphere temperature in the last two millennia: reconstructions of low-frequency variability, Clim. Past, Vol. 8, pp. 765-786. DOI: 10.5194/cp-8-765-2012
[16] Bond G., Kromer B., Beer J., Muscheler R., et al. (2001). Persistent solar influence on North Atlantic climate during the Holocene, Science, Vol. 294, pp. 2130-2136. DOI: 10.1126/science.1065680
[17] Kerr R.A. (2001). A variable sun paces millennial climate, Science, Vol. 294, pp. 1431-1433. DOI: 10.1126/science.294.5546.1431b
[18] Idso S.B., et al. (2017). Medieval Warm Period Project, from http://www.co2science.org/data/mwp/mwpp.php, accessed on 31/08/2017.
[19] Luening S., Vahrenholt F. (2017). Mapping the medieval climate anomaly, from http://t1p.de/mwp and https://www.researchgate.net/project/Mapping-the-Medieval-Climate-Anomaly, accessed on 31/08/2017.
[20] D'Arrigo R., Wilson R., Liepert B., Cherubini P. (2008). On the 'divergence problem' in northern forests: A review of the tree-ring evidence and possible causes" (PDF), Global and Planetary Change, Vol. 60, pp. 289-305. DOI: 10.1016/j.gloplacha.2007.03.004
[21] Stothers R.B. (1984). The great tambora eruption in 1815 and its aftermath, Science, Vol. 224, No. 4654, pp. 1191-1198.
[22] Meehl G.A., Arblaster J.M., Fasullo J.T., Hu A., Trenberth K.E. (2011). Model-based evidence of deep-ocean heat uptake during surface-temperature hiatus periods, Nat. Clim. Change, Vol. 1, pp. 360-364.
[23] Fyfe J.C., et al. (2016). Making sense of the early-2000s warming slowdown, Nature Climate Change, Vol. 6, pp. 224-228. DOI: 10.1038/nclimate2938
[24] Knight J., Kenned J.J., Folland C., Harris G., Jones G.S., Palmer M., Parke D., Scaife A., Stott P. (2009). Do global temperature trends over the last decade falsify climate predictions? In “State of the Climate in 2008”, Bull. Am. Meteorol. Soc., Vol. 90, No. 8, pp. S1-S196.
[25] Brohan P., Kennedy J.J., Harris I., Tett S.F.B., Jones P.D. (2005). Uncertainty estimates in regional and global observed temperature changes: a new dataset from 1850, Journal of Geophysical Research, Vol. 111, p. D12106. DOI: 10.1029/2005JD006548
[26] National Climatic Data Center (NCDC). from https://www.ncdc.noaa.gov/temp-and-precip/ghcn-gridded-products/, accessed on 31/08/2017.
[27] Hansen J., Ruedy R., Sato M., Lo K. (2010). Global surface temperature change, Rev. Geophys., Vol. 48, p. RG4004. DOI:10.1029/2010RG000345
[28] Christy J.R., Norris W.B., Spencer R.W., Hnilo J.J. (2007). Tropospheric temperature change since 1979 from tropical radiosonde and satellite measurements, Journal of Geophysical Research, Vol. 112, p. D06102. DOI: 10.1029/2005JD006881
[29] Mears C.A., Wentz F.J. (2009). Construction of the RSS V3.2 lower tropospheric dataset from the MSU and AMSU microwave sounders, Journal of Atmospheric and Oceanic Technology, Vol. 26, pp. 1493-1509. DOI: 10.1175/2009JTECHA1237.1
[30] Rohatgi V.K. (2003). Statistical Inference, Dover Publication, New York. pp. 537-538.
[31] Bates J. (2017). Climate scientists versus climate data, from https://judithcurry.com/2017/02/04/climate-scientists-versus-climate-data/, accessed on 31/08/2017
[32] Scafetta N., Mirandola A., Bianchini A. (2017). Natural climate variability, part 2: Interpretation of the post 2000 temperature standstill, International Journal of Heat and Technology, Vol. 35.
[33] Mirandola A., Lorenzini E. (2016). Energy, environment and climate: From the past to the future, International Journal of Heat and Technology, Vol. 34, pp. 159-164. DOI: 10.18280/ijht.340201
[34] Scafetta N., Milani F., Bianchini A., Ortolani S. (2016). On the astronomical origin of the Hallstatt oscillation found in radiocarbon and climate records throughout the Holocene, Earth-Science Reviews, Vol. 162, pp. 24-43. DOI: 10.1016/j.earscirev.2016.09.004
[35] Scafetta N. (2014). Discussion on the spectral coherence between planetary, solar and climate oscillations: a reply to some critiques, Astrophysics and Space Science, Vol. 354, pp. 275-299. DOI: 10.1007/s10509-014-2111-8