OPEN ACCESS
This study aims to analyze in same period the irreversible bi-univocal aggregated flows of identical macro goods between different EU-regions. The analysis is intended to justify some possible use of statements validated in other scientific fields – but noticed in a unique reality. The trade flows are evaluated on the two validated statements of the constructal law for economic processes, i.e. profit and value added (utility) maximization. The present research found a surprising fact: the flow irreversibility may be validated only in a weak way. According to the international trade database the same goods (but different copies), measured at different levels of aggregation, are transferred between each other in the same period and between same regions. The trade flows of elementary and macro economic process are right explained using comparative and absolute advantage principles (CAAPs). The design of the economic processes is also based on statement of minimum effort and other five principles, which anthropomorphically rationalize new territories through exchanges and foreign direct investments. The Manoilescu generalised scheme of CAAPs becomes an analytical solution for explaining reciprocal flows between countries of the same “macro” good. A property of statistic average of macro prices allows us to infer the research results at the micro-empirical goods. The scheme metrics can be used for smart specialization within EU Single Market. Contrariety between profit maximization and consumption minimization for mineral resources is still maintained within a range of dynamic stability of economic systems and require new statements for constructal law in Economics. For decoupling of resources we ought to have a right simultaneously metrics for the same unique micro and macro process. Under these findings, the main economic flows of trading goods between territories are easily slipping toward a new design.
Trade flow irreversibility, Comparative advantage as chemical economic reaction, Manoilescu generalised scheme, Economics, Constructal law.
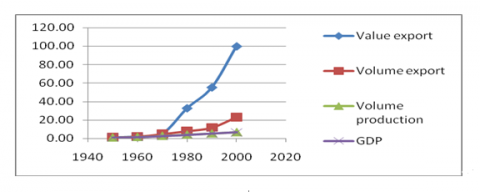
The increased speed characterizing the flow of goods between countries or regions, as compared to the one proper to the world production [1-2] requires a more detailed explanation for the economic process of exchange. The world export values, and consequently in mirror the world import increased during 1950-2000 by 100 times, volume export by 22.9 times, production by 6.9 times and GDP by 6.5 times (Figure 1).
Figure 1. The evolution of world trade exports, production and gross domestic product (GDP), 1950-2000
Note: Our calculus with base 1950=1. Gross domestic production (GDP) is the sum of value added, depreciation of fixed assets and indirect taxes and subsidies on products.
Recent measurements of the total added value (VA) transfer between countries or regions [3-5] show a growing interest in the goods’ flow. The VA measurement indicates the necessity for undertaking an analysis regarding this characteristic of the flow of goods The disaggregated, i.e. empirical, goods exchange (flow) of firms is based on a discrete calculation scheme [6] that seems to be simple if considered from the individual agent’s unilateral point of view: making a profit, as part of VA[1]. Nevertheless, for a country or a region the purpose of maximization keeps even for the whole VA.
The economic process as a whole appears today as a huge cluster of goods where traders are concerned to maximize total profit. In its more general form, profit began to be gradually termed as gains from trade [7] or, in a more general form, as comparative advantages for the exchanges between countries. The VA for the flow of goods was observed for a given period of time without any analysis of the correlation on both levels: total VA or profit as part of VA. The mentioned exception – [8] also included in [6], the latest version of the scheme – was considered irrelevant at that time by critics or reduced to polemical discussions extended into the dialectic field – therefore, outside of metrics. Under these conditions, it is necessary to study a correlated flow analysis between the two levels of VA. In a more complete analysis there appears to be a necessity for observing the flows’ general design, taking into account, along with VA, two additional characteristics: quantity and price.
Some emerging/developing countries, such as Brazil, have stated the use of Manoilescu’s scheme. Other developed countries are tacitly using this scheme (see further the statement of Samuelson) under stable internal markets, and VA per capita increases systematically (Figure 2).
Figure 2. The evolution of Gross Domestic Product, between 1 (back) and 2010 year (in front), different years, countries group, GK$1990
Source Table 8. Note: Gross Domestic Production (GDP), GK$1990, is the sum of value added (VA), depreciation of fixed assets and indirect taxes and subsidies on products.
The actual interest in this area, as mentioned above, is an important step forward taken in what concerns the economic analysis.[2] Some recent studies in the field of constructal law have revealed the possibility of extending this law to economic processes [9]. Challenges to explain the economic process from outside the economic research itself have been increasingly numerous for the last century [10-13]. Other studies go toward improving the explanation of the economic process in its most general form, by means of the already known laws, as for instance the entropy law.
This law is considered to be the one with the most economic characteristics among the laws of physics [14]. As a consequence, the return to the simple analysis of the irreversible flows of consumption, in the physical terms of mineral resources and energy, was an expected direction [15-16]. Its starting point is the relation between environment and the actual economic process, through the need to reverse production, for example, in the reverse of recipes in the case of food or energy due to the growing scarcity of resources: 5-6 decades ago, some food was produced out of fossil fuels, and now fuel is obtained out of renewable sources – e.g. plant mass, waste (food residues included) [14, in Introduction, last paragraph], in the introduction. The flows of mineral resources and energy in the economic process gain in importance as macro flows [17], which should be taken into account in any economic (non-monetary) analysis. However the increased (nominal) flows of VA, measured in monetary form only, stimulate an accelerated increase to the irreversible consumption of mineral resources and energy flows in Nature.
The analytical steps originally taken in the last two centuries, in order to explain simultaneously production and exchange (supply) as essential partial processes within the economic process, identified the principles of absolute advantage [18] and those of the comparative advantage – on the individual side [19] and on the collective side [6]. Similarly, the principle of both individual (Smith, Ricardo) and collective (Manoilescu) interest were identified.
Other fundamental principles which explain more integrated the economic process are: the principle of minimum effort (rationality), the one of cooperation, of individual economic interest and of collective interest, of the economic process’ entropy, the principle of (intergenerational) equity. These principles have been summarized in order to provide an integrated explanation of the economic process. They were summarized and explained in a system that can ensure their normative and positive consistency [20-21] in analitical science.
The two sides – individual and collective – take into account that science deals with communities [22], so that not only the individual side covers the analytical requirement of the Whole, and it is supported by the necessity of synthesis, to observe the community. It includes its individuals. The two sides were identified in time starting with the occurrence of political economy and they refer to: the individual interest and collective interest; the individual comparative advantage and collective comparative advantage; absolute advantage; cooperation; minimum effort / rationality; equity principle; entropy of the economic process. The relation between competition-competitive and cooperation should be explained in the next decades according to the next visions about the anthropomorphic relations: “Competitive implies that an organisation/institution/company aims at constantly improving itself in relation with the other. This requires intensive cooperation in which each party has its own specialization” [23]. The comparative and absolute advantage principles (CAAPs) ought to play a main role.
In the area of exchange flows the efforts of analytical compressibility – i.e. as basic principle in science – were undertaken until the last few decades. There was a lot of literal presentation of CAAPs including or not the descriptions with examples. A proof is the literal presentation of the comparative advantage still found nowadays in major databases [24-25]. The two principles have emerged with the new science, political economy, registering in time a split into Economics and Political Science. They have been verified in practice without a discrete model (formula system) similar to the empirical measurement for the generated VA. The model with the two principles is useful to sustain the right measurement-based decisions by companies. Without measurement, every company can think about having won more than their partner in a bilateral exchange [26]. In their literal form, however explained, lacking an adequate synthesis, the two principles have caused the wasting of high intellectual energy and tons of ink [27-29].
Accordingly, the researchers from other areas have raised the compressibility problem and hence the correct – yet not exact [14] – aggregate measurement limits in Economics. The Nobel laureate Paul A. Samuelson was once challenged by the mathematician Stanislaw Ulam to “name [me] one proposition in all of the social sciences which is both true and non-trivial”. It was several years later that he thought of the correct response – the comparative advantage: “that it is logically true need not be argued before a mathematician; that it is not trivial is attested by the thousands of important and intelligent men who have never been able to grasp the doctrine for themselves or to believe it after it was explained to them.” [30].
The challenge of the mathematician Stanislaw Ulam facing Paul Samuelson shows less confidence in Economics, parted meantime from the political economy, in testing the existence of certain theoretical principles. The theoretical feature is defined here according to Georgescu-Roegen, of non-contradictory meaning. Samuelson’s non-quantified argument when facing Stanislav Ulam’s challenge was later supported by more accurate measurements [31-35], by the relations of inequality, in order to identify the exact direction of the goods’ flows between partners / countries, based on CA. The measurement of individual VA was made based on equations, pertaining to exchange flows of barter [36-37]. So it is simultaneously ensured the identification of the direction between the two traders of the two exchanged goods or goods paid with money. In parallel, the measurement of relative CA and the one of total monetary amount was separated for each partner under these terms. It remains to be clarified by explanations the simultaneous presence of both opposed directions of the aggregated flows, which seems to be contradictory to the single direction of flows validated by the clear CA principle (see further explanations).
The analytical efforts to identify the exchange direction went on with partial explanations about CA, without considering the exchange process as a final sub-process – and the most important in the social area – of cooperative anthropomorphic type. Some disputes on CA and/or AA validity have been keeping on undermining or at least not contributing in the completion of the theoretical foundation of CA. Some solutions [38-41] justify accepting the exchanges’ operability within real processes, simultaneously on the basis of CA and AA principles. The solution is confirmed by the simultaneous manufacturing and the related exchange, based on the CA and AA. The AA complementarity is identified through foreign direct investments (FDI) by (re) location of more efficient technologies into the new regions. A relocated CA can be found in the new space, but such CA will also produce effects similar to the ones of AA because it acts toward domination for some manufactured products – further produced by the former partner – in a new space, at the expense (at the disadvantage) of this (former) partner.
Based on the CA requirements the mentioned space was previously exclusively used by the former partner before placing the FDI. Under these terms the CA principle can be justified, weakly, as the new inhabitant of the region where it was located based on prevalence similar to the one of AA. According to this situation, there cannot be proven the existence only of a single one-way exchange of the same (empirical) commodity between the two spaces. There is a wealth of analyses of FDI effects, but there are missing the detailed explanations about the transfer of VA between spaces, in relation with AA. The analysis of flow direction can provide a more precise explanation of CA limits, as well as of its validity, and an explicit separation of this facet from the one of AA. At the same time the lack of disaggregated data about the production at both ends (in the two regions) by the same company, with one single interest, requires further explanation.
The synthesis-directed endeavors taken by other sciences, with a pursuit to measure especially by mathematical means, were sometimes excessively assumed by Economics [14, chapters 9, 10 and 11]. The results of calculations have not been simultaneously accompanied by the right explanations regarding the effect of conflicting individual or collective interests of different companies, regions and / or communities.
The limits of quantitative aggregation for the two main features – i.e. quantity and price – of the existing or the new products, with structures submitted to changes over time and by information loss through aggregation raise the significance of aggregated data at different levels. Their new reorganization at the lower disaggregated level, can follow the structure of clusters, for example. It is a step further taken in the analytical research to support the objectives of the EU convergence and cohesion and in accordance with the directions of the smart specialization into several groups of goods.
The choice in production-based decisions, underlying the measuring of VA feature of the goods following the EU regional specialization – appears as a solution beneficial to two parties, both the companies and the collectivities. The observation in the present paper with respect to the elementary commodity flows’ single direction and the aggregated commodities’ two-fold direction – the latter one being analyzed for the case of collectivities – will fill the information gap with literal explanations and figures. In this way it can show the goods’ flow streamlining in accordance with the constructal law. The analytical synthesis of flow aggregation as expressed through compressibility [14] must be accompanied by the proper understanding of explanations referring to the initial empirical (non-aggregated) flows.
The analytical purpose of this paper consists in studying how to explain in rational terms, behind the biunivocal aggregated flows, the unique direction of the flow of the empiric good, measured between two areas over a given time period. The examples of actual exchanges of goods are perpetually kept in mind, as required by the necessity of saving those resources that are consumed by trade costs [42], especially for the transportation of goods. The empathic observation is made on CA and AA requirements, based on the understanding of goods’ transfer between two areas and finding similar (empiric) goods on the same market found in stores, (wholesale) warehouse, companies and households. At the aggregated level the similar goods are considered as identical ones. By external addition [14] these goods become a single aggregated good. It is the basic requirement of identity principle of Aristotle for aggregation in Economics.
The methodological aim is to explain and to measure for filling the analytical gap between the unique direction of the flow of one single commodity and aggregated data (less numerous) of the same commodities. The bi-univocal flows (in pair) of the same aggregate good (site PRODCOM classification, for example) seem to cancel the CA validity of single (elementary) good. The consequences of the two-fold direction of the flow of same elementary good are clear: they generate the CA decrease through higher trade costs generated by unjustified transportation (back and forth) of the same commodity between two points in the same period. In two different periods and/or between different areas (even of the same region), the change of direction is justified by the periodic change for the prices’ ratio [43]. Through aggregation, the country becomes a point in space, and the period – one year, usually –, a moment (dimensionless) on the time axis. By reselling the same good the price becomes higher and we are adding new trade costs to the manufacturing initial prices. In a rough form, trade costs represent a difference between the initial price / cost of production and the final price. What remains between the two prices after deducting the trade costs is CA, measured by profit.
To sum up, the purpose of this paper is to identify the main directions of trends regarding the flow of goods between large regions, explained mainly on the basis of individual VA based on profit (CA) scheme. The used characteristics are value added, at total and disaggregate level, for companies and countries (EU27), as well as the price and quantity. The measurements have been performed for EU-28 countries.
1In this research we analyze only VA which is the difference between GVA and depreciation of fixed assets. GVA contains about 60-65% salaries and wages, 20% depreciation, 5-10% profit and the difference contains different taxes for the local and central budgets. The interest related to wages and salaries is considered in this research to be a collective one.
2Some inaccuracies of MM’s scheme need to be reported. The major one consists in the confusion of quantitative productivity for an exchanged quantity and this can blur the actual sense of Manoilescu’s scheme. However the scheme itself is basically valid.
Flows operate in the external exchanges of empiric goods on the basis of CA principle [39], whether this principle can be proved or not by (aggregate) measuring in analytical terms [24, 30]. The same rule is found for the internal trade of a region [44]. The easy operation of the unique direction of the flow of goods between two regions or two partners is a characteristic given by the CA. The direction of the flow has more nuanced explanations, when starting to understand the aggregate figures about the empirical goods. Therefore a design of the economic exchange flow will be observed and described in detail. In the present article we set an analytical framework based on the economic CA principle – in particular, and also on aggregate flows from databases. The analysis uses stylized facts and provides a systematic understanding of the exchange, at basic and aggregate levels simultaneously.
The next explanations are about the CA scheme in empirical exchange, i.e. elementary flows. A trader exports to another partner from another region a commodity and he is interested to import another commodity, using the same means of transport (for the sake of efficiency). The transport term seems a forced assumption and will be removed when increasingly detailed explanations are given. However, it should be considered in commercial partnerships negotiated between countries or regions.
Trade and other economic activities are specialized. As a matter of fact, traders, who are specialized in the production or the marketing of goods, systematically look for one another in order to identify effective exchange opportunities and to increase their profits, whether the exchanges take place outside or inside the region. In the absence of an analytical model the traders’ calculations may take hours on account of a negotiated (asymmetric or equal) distribution of the total profit in the case of a multiple goods’ exchange.
The final target is to fulfill the smart specialisation between EU region, not inside of every EU country, through the convergence and cohesion objectives. The exchange framework established between two regions – for example located within the European Union (EU) to achieve a quicker convergence – is a multiple with the commodities and export flow direction for each one. The calculus can be made easily by scheme below described.
Within the simple analytical description of CA, the fundamental point of reference is barter with two goods, between two traders, located in two different areas. In this case, the model is based on the simultaneous identification of the exchange direction, on the relative total CA and of the one of each partner, and on the total value of the comparative advantage and on the one of the partners. The two individual interests are considered with respect to the negotiation of a proper international price (see explanation below). Behind these individual interests the collective interest of the two regions / countries is achieved in the case of developed countries or it may be achieved in the case of developing countries [45]. Conversely, in normal terms each of these national/regional collective interests is related to and is based on the individual interests of their companies. This dual fact is the main key to explain the real trade flows between different (EU) regions.
Given only the domestic prices, one can identify on the basis of the CA scheme the exact direction of trade flows of each good between two areas where the two trading companies are located. As pointed above, AC is sometimes called gains from trade and is a form of profit in normal competitive economies. Some companies may be located in both areas, including the one of his partner (ex. FDI). In this case the flows of CA (profit) have also a reverse way compared to the initial normal direction of that explicitly shown by the CA initial scheme. This is the new case of AA described below.
The exact calculation of CA, in its simple analytic form of barter is included in the generalized scheme of Manoilescu, in the corresponding algorithm. Other advanced forms of exchange may be developed from the algorithm barter. These are: the money algorithm [46], the algorithm with trade costs [42], the algorithm of CA in internal exchange [44], and the algorithm of a purely nominal exchange between two quantities of currencies.
The basic quantitative data about the requirements of a barter exchange can be summarized in the following table 1.
Table 1. The analytical coordinates of prices and quantity, two goods and two countries
|
Enterprise/ Country/Region |
Product (Pr) |
Internal prices |
Quantities |
|
E |
Pr1 |
pe1 |
qe1 |
|
Pr2 |
pe2 |
qe2 |
|
|
I |
Pr1 |
pi1 |
qi1 |
|
Pr2 |
pi2 |
qi2 |
To summarize, in order to start negotiating the advantage of one of two countries / regions or companies – E and I, given are two products – Pr1 and Pr2, four domestic prices, pe1, pe1 and pi1 and pi1, as well as two international negotiated prices for the two products, P1 and P2. Under these terms one can measure the total relative advantage, AvrT of the two parties in a trading agreement.
From the perspective of country E:
AvrT(E) = (pe2/ pe1): (pi2/ pi1)(1)
The Pr1 is considered to be the first exported in I, and a value-equivalent importation of Pr2 resells in E.
From the perspective of country I:
AvrT(I) = (pi1/pi2) : (pe1/pe2)(1')
In this scheme E start up the exchange by exporting the product 1. The reverse way in this analytical scheme, is possible and can be proved through the periodical change of the ratio between the internal prices ratio and the external prices ratio - Godley hypothesis, in [43].
The starting point in improving the former exchange flow or non-flow case (autarchy) is represented by inequality (2).
qe2* pe2 > qe1* pe1(2)
The condition for triggering the exchange is that the CA rate should be higher than sum of the bank’s interest rate and the risk rate of the currency investment, including foreign terms.
The amount of Product 2 is then deducted according to the value of the proposed transaction volume (qe1* pe1) and the relative price pi2/ pi1.
The equivalence of exchange qe1* pe1 with qi2* pi2 refers to the most important qualitative leap within the trading process, that could be compared to a „chemical reaction” in the economy. The equivalence qe1* pe1 ≡ qi2* pi2 does not have a quantitative or mathematical meaning, as shown by Ludwig von Mises. This relation transcends – through not complying with – the requirements of the laws of thermodynamics and closed systems, because it has the potential to exchange antropomorphic energy [26]. It accomplishes a Schumpeterian qualitative leap [47].
The relation (2) is the engine of the economic evolution [26] and it enables to measure any possible anthropomorphic exchange. This exchange may be accomplished within Nature where examples of such (chemical) reactions are numerous.
The AvrT for CA is identified in any human exchange involving two goods, except for the case when the value of AvrT is 1. In this case we may witness a kind of thermodynamic economic death (of maximum enthropy). Another exception is the case when the comparative advantage (gains from trade) is low (near 1) and hence it would not cause the start of trade flows based on an individual low or non-existent interest. The trade exchange flows are not mechanical movement but have an anthropomorphic purpose which ought to be identified, explained and used in the interest of communities, and thus of the majority, if possible of all individuals. The constructal law has a specific characteristic in Economics to detect flow consistency. In the real exchange it wil include the trading costs that reduce the relative level of CA in AvrT.
Based on these explanations for the exchange significance, one can make a separate calculation for the relative advantages of the two partners E and I, AvrE și AvrI [36].
AvrE = (pe2/ pe1): (P2/ P1)(3)
Country I
AvrI = (pi1/ pi2): (P1/ P2)(4)
Each partner has an associated relative advantage, which is a part from AvrT.
AvrE* AvrI = AvrT(5)
In the currency-based algorithm of exchange a similar calculation is made for AvrE.
AvrE = Rech :(pe1/ P1)(6)
Rech - the rate of exchange for E-country’s currency in relation to another currency. Rech is a relative price, equivalent to the relative price pi2/ P2 in barter exchange algorithm.
The CA absolute value is determined through multiplying the relative CA gain of each party (AvrE/I -1) value by the amount of the transaction value (qe1* pe1; qi2 * pi2).
The collective comparative advantage is measured in VA. A hierarchy of productivity measured by VA/employee, PVAi, for each sector or commodity indicates the priorities in terms of trade flows’ efficiency, as established in accordance with the collective interest. This succession – PVA1, PVA2, PVAi , … where 1, 2, .. i is the commodities’ queue according to the efficient exchange order for one country. It shows the correct riverbed of the „economic river”, with trade flows, according to the identified collective interest. This scheme contains the metrics for measuring the convergence and cohesion objectives within the EU.
The coupling of the decisions based on individual interest with decisions based on collective interest is similar to joining the main riverbed of secondary riverbeds. The secondary economic riverbeds have many meanders before simultaneously applying the CA scheme for serving both individual and collective interests using measures of the infant industry type. The meanders are the goods exchanges which do not simultaneously meet the two criteria of CA collectively and individually. Similarly as transport routes we find in the same the simple routes in parallel to highways. A exchange with optimum CA between two countries or regions will be focused on the building of economic highways for efficient speeds for both directions. The gains form trade of companies and simultaneously the VA for the both countries with these economic highways will be more large.
In one country the exchange order for same products is different for other countries. This is an outstanding fact enabling partners to take part in the exchange activity, due to the 4 magic numbers [30] – the four internal prices from formula (1).
Let us give a complete explanation of the aftermath: unlike individual CA in empirical exchanges are not simultaneously measured by means of the formula system (1) - (6), we do not have an optimal solution in terms of all goods. Similarly, Mechanics also does not use the most efficient lever system in all cases, but one that can be useful in certain given conditions. As a matter of fact, in parallel with the individual CA, the collective CA is usually a mere norm, with casual effective transposition in empirical exchanges only for developed countries, due to their negotiating power and economic stability provided by the existence of competitive economic sectors, with a high VA per capita/employee [48-57].
In order to analyze the flows design based on the calculations of CA we consider the PRODCOM aggregate products of 6-digit as basic products. We consider the export between two countries, Germany and France, for the all PRODCOM products. The relative prices pe2/ pi2, pe1/ pi1, are calculated. We will divide after the lowest and the highest ones. (tables 2 and 3).
Table 2. The largest relative prices and trade value, EU28, Germany and France, 21 goods, 2013 (pe2/pi2)
|
Products |
Value EU 28 |
Value Germany |
Value France |
Relative price |
|
Hydraulic jacks and hoists for raising vehicles (excluding those for use in garages) |
740,059 |
324542 |
221774 |
88.30 |
|
Electric machines and apparatus for resistance welding of metal |
1,243,585 |
464688 |
99277 |
61.49 |
|
Slates and boards with writing or drawing surfaces |
121,741 |
27613 |
13273 |
34.36 |
|
Fully or partly automatic electric machines for arc welding of metals (including plasma arc) |
526,264 |
127308 |
20641 |
30.71 |
|
Converters, ladles, ingot moulds and casting machines of a kind used in metallurgy or in metal foundries |
1,301,661 |
383193 |
60324 |
30.19 |
|
Machinery and apparatus for filtering or purifying air (excluding intake filters for internal combustion engines) |
2,079,620 |
674169 |
270738 |
22.00 |
|
Radio navigational aid apparatus (including radio beacons and radio buoys, receivers, radio compasses equipped with multiple aerials or with a directional frame aerial) |
1,340,861 |
197535 |
423155 |
18.41 |
|
Umbrellas, sun umbrellas, walking-stick umbrellas, garden umbrellas and similar umbrellas (excluding umbrella cases) |
129,954 |
35302 |
9352 |
17.61 |
|
Scarifiers and cultivators |
490,699 |
264621 |
9511 |
15.71 |
|
Positive displacement pumps, rotary (including peristaltic, rotary lobe and helical rotor pumps) (excluding hydraulic units, gear pumps, vane pumps, screw pumps) |
609,296 |
224438 |
94985 |
15.19 |
|
Multi-purpose machines where the workpiece is manually transferred between operations, for working wood, cork, bone, hard rubber, hard plastics or similar hard materials |
150,000 |
82589 |
9397 |
11.55 |
|
Reciprocating displacement compressors having a gauge pressure capacity ≤ 15 bar, giving a flow ≤ 60 m³/hour |
272,147 |
63038 |
15184 |
11.39 |
|
Phosphinates (hypophosphites) and phosphonates (phosphites) |
8,418 |
2182 |
34 |
11.28 |
|
Lightning arresters, voltage limiters and surge suppressors for a voltage > 1 kV |
206,411 |
99358 |
56822 |
10.51 |
|
Ophthalmic instruments and appliances |
487,474 |
228306 |
40226 |
9.35 |
|
Motor boats and motor yachts, for pleasure or sports (excluding outboard motor boats) |
4,654,563 |
1098053 |
212583 |
9.20 |
|
Insecticides based on organophosphorus products, put up in forms or packings for retail sale or as preparations or articles |
202,174 |
17559 |
23194 |
8.80 |
|
Refractory ceramic goods, n.e.c. |
392,231 |
89993 |
2256 |
8.68 |
|
Self-propelled boring or sinking machinery |
850,047 |
270699 |
38739 |
8.08 |
|
Other wrist-watches, pocket-watches and other watches, including stop-watches |
163,440 |
87517 |
50374 |
8.03 |
|
Non-numerically controlled bending, folding, straightening or flattening machines for working flat metal products (including presses) |
347,363 |
245440 |
25639 |
7.81 |
|
Total 21 products from above (million euros) |
16,318 |
5,008 |
1,697 |
|
|
Total (million euros) 368 products |
614,949 |
168,931 |
73,818 |
|
Note: Relative price - pe2GE/pi2FR. The 368 products have the relative prices greater as 1.1. The good relative prices performance is relatively at the goods relative prices from table 3. The initial figures are from PRODCOM database, EUROSTAT. The values are in thousands euros.
In this case an agreement negotiation between the countries or regions for the products found in this situation it would be generated the highest AvrT. Based on the results we can determine each country’s specialization design for VA profit, in fact the CA for companies.
Table 3. The lowest relative prices and trade value, EU28, Germany and France, 21 goods, 2013 (pe1/pi1)
|
Products |
Value EU 28 |
Value Germany |
Value France |
Relative price |
|
Frozen poultry livers |
93577 |
3932 |
27248 |
0.0775 |
|
Manostats |
471324 |
286331 |
64943 |
0.0762 |
|
Electronic gas or smoke analysers |
500000 |
157320 |
93830 |
0.0708 |
|
Flexible tubes, pipes and hoses of plastics, not reinforced or otherwise combined with other materials, with fittings, seals or connectors |
219083 |
53521 |
47707 |
0.0691 |
|
Fans (excluding table, floor, wall, ceiling or roof fans with a self-contained electric motor of an output ≤ 125 W, axial fans, centrifugal fans) |
770630 |
519018 |
31112 |
0.0670 |
|
Worked monumental or building stone and articles thereof (excluding of granite or slate, tiles; cubes and similar articles; of which the largest surface area is < 7 cm²) |
1345864 |
121746 |
13764 |
0.0650 |
|
Bare multilayer printed circuit boards |
3200000 |
493102 |
109905 |
0.0607 |
|
Other bases for electric control, distribution of electricity, voltage ≤ 1 000 V |
7680000 |
3528023 |
548152 |
0.0540 |
|
Other process control valves, temperature regulators |
175802 |
41921 |
14452 |
0.0474 |
|
Tubes and pipes, of circular cross-section, seamless, of stainless steel (excluding line pipe of a kind used for oil or gas pipelines and casing, tubing and drill pipe used for oil or gas drilling) |
1765909 |
228938 |
114677 |
0.0427 |
|
Hats and other headgear, knitted or crocheted or made-up from lace, felt or other textile fabric in the piece (but not in strips); hair-nets of any material |
139437 |
13417 |
12885 |
0.0403 |
|
Other machines and mechanical appliances of HS 84, n.e.c. |
13180800 |
8126196 |
149994 |
0.0386 |
|
Other wind instruments |
134854 |
54737 |
66292 |
0.0344 |
|
Other apparatus for connections to or in electrical circuit, voltage ≤ 1 000 V |
1908876 |
1210565 |
221099 |
0.0264 |
|
Instruments and appliances for aeronautical or space navigation (excluding compasses) |
3300000 |
184349 |
1441525 |
0.0197 |
|
Sails |
78225 |
1233 |
32036 |
0.0165 |
|
Inductors (excluding induction coils, deflection coils for cathode-ray tubes, for discharge lamps and tubes) |
830270 |
385665 |
21476 |
0.0162 |
|
Electromagnets and electromagnetic lifting heads, and their parts (excluding magnets for medical use); electromagnetic or permanent magnet chucks, clamps and similar holding devices and their parts, n.e.c. |
871406 |
568259 |
91693 |
0.0067 |
|
Electronic instruments and apparatus for meteorological, hydrological and geophysical purposes (excluding compasses) |
902920 |
47123 |
540117 |
0.0060 |
|
Acyclic amides and their derivatives, and salts thereof (including acyclic carbamates) |
891714 |
552790 |
45154 |
0.0052 |
|
Electronic instruments, appliances and machines for measuring or checking geometrical quantities (including comparators, coordinate measuring machines (CMMs)) |
1815043 |
1377080 |
73049 |
0.0024 |
|
Total (million euros) 21 products from above |
40,276 |
17,955 |
3,761 |
|
|
Total (million euros) 532 products |
1,106,511 |
259,575 |
147,166 |
|
Note: Relative price - pe1GE/pi1FR. The 532 products are with relative prices lowest as 0.9. The good relative prices performance is relatively at the goods relative prices from table 2. The initial figures are from PRODCOM database, EUROSTAT. The values are in thousands euros.
The assumed production in the specialization through CA, representing the sum of the two former domestic productions – before the exchange, i.e. so called the autarchy case – can be achieved in one country in more factories at reduced price or cost (table 4). In the economic processes the price becomes cost and vice versa [21].
Table 4. The most advantageous exchanges, two products and two regions scheme, Germany and France, PRODCOM 2013 figures
|
Products |
Maximum value (000 euros) |
Germany |
France |
Rp |
|
1. Hydraulic jacks and hoists for raising vehicles (excluding those for use in garages) |
546,316 |
324,542 |
221,774 |
88.30 |
|
2. Electric machines and apparatus for resistance welding of metal |
563,965 |
464,688 |
99,277 |
61.49 |
|
3. Inductors (excluding induction coils, deflection coils for cathode-ray tubes, for discharge lamps and tubes) |
407,141 |
385,665 |
21,476 |
0.0162 |
|
4. Electromagnets and electromagnetic lifting heads, and their parts (excluding magnets for medical use); electromagnetic or permanent magnet chucks, clamps and similar holding devices and their parts, n.e.c. |
659,952 |
568,259 |
91,693 |
0.0067 |
Note: Rp- relative price : pe2/pi2 and pe1/pi1. Maximum value (thousand euros) is for one country after specialisation.
For only the four products the maximum AvrT is 13179.1 for the exchange between Product 1 and Product 4 and the minimum AvrT is 1.4 for the exchange between Product 1 and Product 2 (table 5). Every company /country which wil trade these products is possible to gain half or asymmetric part from the AvrT. The trade costs will decrease AvrT by transportation costs and other trade (tariffs and other expenses).
Table 5. The best AvrT for four products, Germany and France, 2013
|
Position |
Products |
AvrT |
|||
|
1 |
Hydraulic jacks and hoists for raising vehicles (excluding those for use in garages) |
1 |
|
|
|
|
2 |
Electric machines and apparatus for resistance welding of metal |
1.4 |
1 |
|
|
|
3 |
Inductors (excluding induction coils, deflection coils for cathode-ray tubes, for discharge lamps and tubes) |
5450.6 |
3795.7 |
1 |
|
|
4 |
Electromagnets and electromagnetic lifting heads, and their parts (excluding magnets for medical use); electromagnetic or permanent magnet chucks, clamps and similar holding devices and their parts, n.e.c. |
13179.1 |
9177.6 |
2.4 |
1 |
Note: Every metrics form table is AvrT for the first product on the column (with initial level 1) and next products. Also is assumed as colective interest was fulfill by infant industry measures.
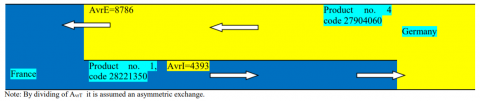
The highway of trade flows of two PRODCOM goods, code 28221350 Product 1 and code 27904060, Product 4 show us the easiest way to gain the CA for two countries (Figure 3).
Figure 3. The highway of trade flows, two PRODCOM goods, two countries (maximum CA), 2013
Note: By dividing of AvrT it is assumed an asymmetric exchange.
In the figure the direction width on the highway, could measure the gross AvrE si AvrI, as result of the negotiation and shows us by comparison the share from total AC. In these circumstances the flows between regions are calculated in terms of lasting trends, when prices do not change significantly – the Godley hypothesis, in [43].
The analysis is based only by aggregated quantities and prices. Following the properties of statistic average of prices there can be shown that among the empirical invoiced products of an aggregate product a majority of trade volume can fulfill the CA criteria. The products meet the criteria to have the prices above the aggregate relative price. Under these terms for every of these empirical products the AvrT is over level 1.
In the second stage (the main one) of the Manoilescu Genralised scheme the productivity level would be consequently analyzed. The secondary riverbeds are meet main riverbed of stable flows. This represents the water reserve and therefore it cannot be drained due to the qualitative leap [47]. We take into consideration here the case of two identical Ford plants located in UK and Germany and after a period they have had different levels of productivity (X efficiency item, The New Palgrave Dictionary of Economics, 1987, tome four).
The higher productivity in developed countries represents a form of AA. In which way? The goods are sold at a lower price, and the relative consumption of mineral resources is implicitly low. The AA is higher, being driven by an increased productivity. In fact, the concept of gains from trade was originally formulated for small countries, tacitly assuming a higher AA in other countries. The correlation phase between the level of relative prices and the ones of productivity (higher) was only briefly investigated in this study. This correlation, whilst having regard to all economic principles, provides the saving of mineral and energy resources, simultaneously with the convergence through the increase in VA for every region (the Pareto optimal).
The other main situation analyzed is about a small products group including similar products - similar regarding the manufacturing recipe, and which have closely-related PRODCOM codes. The table 6 indicates a missing of (average) prices and of total quantities. In this case prices can be calculated using the dummy method [58], by example. In this case also there can be secured a specialization based on relative prices.
In order to have an integrated picture of a sequence of similar products we calculate relative prices to some chemicals from the group with the codes 20163060-20164090 (chemicals sector). An analysis of “cluster” on products group to assess the exchange have has the following morphology for the value flux, quantity, price and AC intensity from exchanges. The last feature is measured as relative price by the relative size of intensity.
Table 6. The main characteristics, value, quantity and price, for some chemical cluster, PRODCOME serie, 2013
|
Indicators\ Code Prodcom |
V/Q |
63060 |
63090 |
64013 |
64015 |
64020 |
64030 |
64040 |
|
Value EU28 |
V |
8.8E5 |
2.2E5 |
6.0E5 |
2.8E6 |
6.0E5 |
1.1E6 |
2.5E6 |
|
Volume EU28 |
Q |
7.3E4 |
1.4E5 |
2.1E5 |
2.1E6 |
1.7E5 |
7.6E5 |
1.4E6 |
|
Median EU28 |
p |
16.61 |
2.47 |
2.98 |
1.71 |
3.09 |
4.31 |
2.53 |
|
Unit value UE28 |
p |
13.39 |
2.31 |
2.86 |
1.67 |
3.87 |
2.06 |
2.28 |
|
Ratio of rp EU 28 |
Rp28 |
1.24 |
1.07 |
1.04 |
1.02 |
1.25 |
2.10 |
1.11 |
|
Germany |
V |
:C |
:C |
:C |
7.4E5 |
4.8E4 |
4.2E5 |
6.2E5 |
|
Spain |
V |
:C |
0.0 |
1.7E3 |
:C |
:C |
2.6E4 |
6.5E5 |
|
France |
V |
2.3E5 |
:C |
1.3E3 |
:C |
:C |
:E |
:E |
|
Germany |
Q |
:C |
:C |
:C |
5.9E5 |
1.3E4 |
3.0E5 |
:C |
|
Spain |
Q |
:C |
0.0 |
3.8E2 |
:C |
:C |
8.7E3 |
3.0E5 |
|
France |
Q |
1.5E4 |
:C |
1.6E2 |
:C |
:C |
:E |
8.6E2 |
|
Germany |
P |
|
|
|
2.21 |
3.86 |
|
|
|
Spain |
P |
|
|
4.56 |
|
|
2.99 |
2.20 |
|
France |
p |
14.00 |
|
9.62 |
|
|
|
|
|
Germany/Spain |
rp |
|
|
|
|
|
|
|
|
Germany/France |
rp |
|
|
|
|
|
|
|
|
Value EU28 |
V |
7.2E5 |
2.2E6 |
6.2E5 |
1.1E6 |
2.2E5 |
2.1E6 |
|
|
Volume EU28 |
Q |
5.3E5 |
2.1E6 |
2.0E6 |
6.0E5 |
2.0E5 |
1.4E6 |
|
|
Median EU28 |
p |
1.69 |
1.22 |
1.31 |
1.81 |
2.06 |
2.12 |
|
|
Unit value UE28 |
p |
1.44 |
1.05 |
0.34 |
1.90 |
1.11 |
1.80 |
|
|
Ratio of rp EU 28 |
Rp28 |
1.17 |
1.16 |
3.83 |
1.05 |
1.85 |
1.18 |
|
|
Germany |
V |
2.0E5 |
6.3E5 |
3.1E4 |
6.3E4 |
4.7E4 |
5.6E5 |
|
|
Spain |
V |
5.7E4 |
:C |
:C |
9.5E4 |
:C |
2.6E5 |
|
|
France |
V |
5.6E4 |
:E |
0.0E0 |
1.7E5 |
8.8E4 |
2.4E4 |
|
|
Germany |
Q |
2.1E5 |
5.2E5 |
2.4E4 |
3.6E4 |
9.0E3 |
4.8E5 |
|
|
Spain |
Q |
3.3E4 |
:C |
:C |
5.7E4 |
:C |
1.1E5 |
|
|
France |
Q |
1.8E4 |
:E |
0.0E0 |
9.7E4 |
5.3E4 |
4.9E3 |
|
|
Germany |
P |
0.96 |
1.22 |
1.32 |
|
5.19 |
1.60 |
|
|
Spain |
P |
1.91 |
|
|
1.74 |
|
2.46 |
|
|
France |
p |
1.92 |
|
|
1.89 |
1.65 |
2.81 |
|
|
Germany/Spain |
rp |
0.50 |
|
|
|
|
0.65 |
|
|
Germany/France |
rp |
0.50 |
|
|
|
3.14 |
0.57 |
|
Note: 1. The code PRODCOM wil be understand/read with 201 before: 20163060 instead of 63060. Similarly, the figure 6.0E5 (scientific form) will be read 6.0E+05; 2. V- Value (thousands euro); Q-Quantity (thousands kg); (r)p – (relative) price (without measurement unit; neutral figure); price (euro) 3. All confidential data and all national estimated data is suppressed (:C)=Confidential, (:CE)=Confidential Estimated, (:E)=Estimated.
Table 6. Annex The list of codes for some PRODCOM products (chemical sector)
|
Code |
Products |
|
20163060 |
Fluoropolymers |
|
20163090 |
Polymers of halogenated olefins, in primary forms, n.e.c. |
|
20164013 |
Polyacetals, in primary forms |
|
20164015 |
Polyethylene glycols and other polyether alcohols, in primary forms |
|
20164020 |
Polyethers, in primary forms (excluding polyacetals, polyether alcohols) |
|
20164030 |
Epoxide resins, in primary forms |
|
20164040 |
Polycarbonates, in primary forms |
|
20164050 |
Alkyd resins, in primary forms |
|
20164062 |
Polyethylene terephthalate in primary forms having a viscosity number of ≥ 78 ml/g |
|
20164064 |
Other polyethylene terephthalate in primary forms |
|
20164070 |
Unsaturated liquid polyesters, in primary forms (excluding polyacetals, polyethers, epoxide resins, polycarbonates, alkyd resins, polyethylene terephthalate) |
|
20164080 |
Unsaturated polyesters, in primary forms (excluding liquid polyesters, polyacetals, polyethers, epoxide resins, polycarbonates, alkyd resins, polyethylene terephthalate) |
|
20164090 |
Polyesters, in primary forms (excluding polyacetals, polyethers, epoxide resins, polycarbonates, alkyd resins, polyethylene terephthalate, other unsaturated polyesters) |
A brief observation of country specialization in the EU shows us that there is no concordance or at least a difference for Germany case between the smart specialisation priorities and the ones based on CA measurement (table 7).
Table 7. Priorities for Germany as Encoded in the “Eye@RIS3” Tool
|
Description |
Capabilities |
Target Markets |
EU Priorities |
|
Digital economy & society (industry 4.0, smart services, smart data, cloud computing, digital networks, digital science, digital education & digital life worlds) |
1. Information & communication technologies (ICT) |
1. Information & communication technologies (ICT) |
1. Digital Agenda |
|
Civilian security (civilian security research, cyber-security, IT-security & secure identities) |
1. Information & communication technologies (ICT) |
1. Public administration, security & defence |
1. Digital Agenda |
|
Intelligent mobility (intelligent traffic infrastructure, innovative mobility concepts and networks, e-mobility, automotive technologies, aeronautics & maritime technologies) |
1. Information & communication technologies (ICT) |
1. Transporting & storage |
1. Sustainable innovation |
|
Healthy life (combating common illnesses, individualised medicine, prevention and nutrition, innovative care, research on active substances & innovative medical technology) |
1. Human health & social work activities |
1. Human health & social work activities |
1. Public health & security |
|
Innovative work environment (work in a digitalised world, innovative services for future markets & e-Skills and digital competences) |
1. Services |
1. Services |
1. Service innovation |
|
Sustainable economy & energy (energy research - energy storage, electricity grids, photovoltaic construction & energy efficient cities, green economy, bio-economy, sustainable agricultural production, securing provision of raw materials, future city, future construction, sustainable consumption) |
1. Energy production & distribution |
1. Manufacturing & industry |
1. Sustainable innovation |
The judgments for the average property in the chaining of the AvrT on the different aggregated levels – with literal explanations or with measurement – are useful for the comparison of Avrt with the more general priorities (the very general level) found for Germany, from the above table.
In this case there is no benefit from the most subtle and accurate economic instrument, CA, used in the analysis of any economic process: the exchange. The exchange process contains also the self-consumption (own production from household), which is specific to developing countries. The VA contains self-consumption in the developing (emerging) countries, between 25-30% from VA, which decreases the true figure of the VA. The concept of self-consumption is defined here as an exchange between the sectors of production and consumption. Whether CA is used or not for measurement, the trade flux will flow based on AC and AA. As shown above the two principles are complementary and can explain any situation involving exchange.
The large flows of exchange between developed countries have no even the analytical appropriate explanations on the basis of the productivities’ hierarchy, according to the scheme of Manoilescu (Manoilescu, 1929). In the world the further supported increase of VA per capita of the countries (table 8) is the indirect proof of the (partial) use of Manoilescu’s scheme.
Table 8. The evolution of Gross Domestic Product, between 1820-2010, main countries group, GK$1990
|
Country Group\ Year |
1820 |
1940 |
1950 |
1970 |
1990 |
2010 |
|
12 W. Europe |
1,528 |
4,988 |
4,944 |
10,853 |
16,793 |
21,793 |
|
14 small WEC |
956 |
3,824 |
3,846 |
7,399 |
14,445 |
19,872 |
|
30 W. Europe |
1,455 |
4,551 |
4,517 |
10,108 |
15,905 |
20,889 |
|
USA |
1,361 |
7,010 |
9,561 |
15,030 |
23,201 |
30,491 |
|
W. Offshoots |
1,302 |
6,838 |
9,268 |
14,560 |
22,346 |
29,564 |
|
7 E. Europe |
683 |
1,969 |
2,088 |
4,350 |
5,427 |
8,678 |
|
F. Yugoslavia |
|
|
1,428 |
3,945 |
5,646 |
6,693 |
|
F. Czechoslovakia |
|
|
|
|
8,513 |
13,020 |
|
F. USSR |
|
2,144 |
2,841 |
5,575 |
6,894 |
7,733 |
|
8 L. America |
639 |
2,122 |
2,696 |
4,309 |
5,461 |
7,770 |
|
15 L. America |
667 |
|
1,723 |
2,531 |
3,244 |
4,772 |
|
21 Caribbean |
636 |
|
2,533 |
4,948 |
6,322 |
9,043 |
|
L. America |
628 |
2,042 |
2,505 |
3,985 |
5,065 |
6,767 |
|
China |
600 |
|
448 |
778 |
1,871 |
8,032 |
|
India |
|
686 |
619 |
868 |
1,309 |
3,372 |
|
Japan |
|
2,874 |
1,921 |
9,714 |
18,789 |
21,935 |
|
16 E. Asia |
588 |
|
667 |
1,420 |
2,704 |
6,375 |
|
24 Sm. E. Asia |
556 |
|
1,385 |
2,082 |
2,543 |
0 |
|
30 E. Asia |
556 |
|
710 |
998 |
1,350 |
3,108 |
|
15 W. Asia |
672 |
|
1,776 |
3,999 |
4,859 |
7,231 |
|
Asia |
591 |
1,080 |
716 |
1,530 |
2,783 |
6,307 |
|
Total Africa |
486 |
|
889 |
1,335 |
1,425 |
2,034 |
|
Total World |
712 |
2,181 |
2,104 |
3,725 |
5,149 |
7,814 |
The VA measurement generated by the goods exchange between regions was considered useless in the last eight decades until recently. Now it is a first step in using the cooperation potentials to simultaneously maximize collective and individual CA. The collective CA is maximized in operational terms when the goods’ priority is the same for individual and collective CA, the latter being of higher importance. To achieve consistency between the two comparative advantage types for companies and collectivities the tariff and non-tariff, i.e. infant industries measures are used. These measures applied correlated (integrated) simultaneously ensure reducing the distance between the two optima of the minimum unit cost and the total maximized profit and are the decisive step in eliminating the contrariety between individual and collective interests in each region or country.
The negotiations between EU regions can ensure convergence and cohesion – at least to reduce contrariety among regional collective interests –, through cooperation and choice of exchanged product flows for every region. The beneficial effects on reducing consumption of mineral resources, energy and VA, through joining of two micro-economic optima mentioned above [59], exceed the objectives put forward by this research. The simultaneous attempt to merge the two optima and trade flow between regions through such measures have as trend an optimum optimorum for regions, companies and individuals.
To describe a simplified framework (stylized facts) of exchange serves here to setting the reference framework by taking into account the trend of energy saving and resources and an extensive cooperation, required by the decision makers within the EU by diverse common strategies.
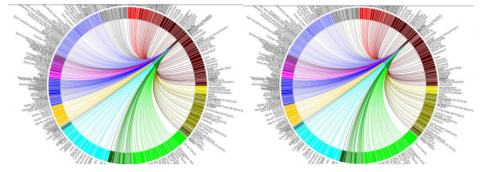
After the recent VA measurements developed by EU and OECD, the design of trade volume in million euros between NUTS2 regions for EU25 represents an important step (Fig.4).
Figure 4. The design of export (left side) and import (right side) flow trade between Region Berlin and EU25 NUTS 2 regions, 2010.
Source: PBL Netherlands Environmental Assessment Agency, http://themasites.pbl.nl/eu-trade/index2.html?vis=chord, accesed on 14.04.2015.
It is thus the lacking of simultaneous measurement of individual and collective CA. Based only on these two levels of CA, the effects of simultaneous convergence of all regions will be evaluated as Pareto optimum in weak sense. Under these terms it is further ensured a relative simultaneous stability regarding the direction of the goods’ flow between companies and between regions, as well as a proper decoding of the significance of the trade’s direction. The new exchange processes can be considers as final sub-processes which assure the Lyapunov dynamic stability of economic systems, where all individual and collective interests meet. If the Pareto optimum of the collective exchange, based on the cooperation, supports and determines the individual interests (of firms) to be less contrary, then an increase in the total added value will be achieved. The projection function of management of VA flows in the economic riverbed is fundamental for the relationship between science and the decision-making process for increasing the income convergence of communities. The constructal law that underlies the changing design of economic exchange flows – i.e. allotting of structural funds in the EU – ensures the appropriate analytical framework.
The observation and measurement of single-direction exchanges for goods considered unique before aggregation become more difficult due to the increasing number of similar products and services on the time arrow. Under these circumstances, even starting from empirical exchanges, there can be found the existence of biunivocal flows for the same empirical product – generally minimally differentiated. The distinction here is not necessarily in the sense proposed by [60], to achieve superior differentiated products but few, instead of a common product but in large quantity (at low price). Thus in any food shop in the EU there are assortments stocks of butter from France, Germany, Holland etc.; of wine from Chile, France, Romania, Italy etc. The analytical necessity of the identity principle following the Aristotelian logic cannot stop the diversification; in the best case it stimulates the fulfillment of a minimum quality standard for all similar products that could be considered identical in economic aggregation.
The CA cannot be studied in strong way thoroughly by means of aggregated data, but only within the actual elementary processes; or it can be made on the basis of minimum effort, i.e. a facet to rationality in economy. The equivalence of similar goods, in the view of comparing and aggregating them, can be done for instance on the basis of the hedonic price theory (or some simple equivalence factors). The case of using the equivalence factors to pairs of shoes, all reduced at the size 42 (28 cm), suits, bakery products, sugar-based products (% equivalent sugar) and clothing (size 48), offers a picture of the degree of diversity approximation. In these circumstances, the identity principle can be considered as being met in weak sense – without discussing the issue of changing the structure of the aggregated goods every year and for every country.
The individual flow of one product with a lower price and an adequate relative price has a CA-based projected flow design. It is supported by the individual interest of companies to maximize profit from exchanges. In these circumstances it is obvious that the flows of the same product will follow the easiest way, in accordance with the individual interest and the ultimate decision of firms – not of region and of country one – with respect to the further selecting of goods for supply.
But the flows noticed in the economic research are aggregated according to the second scientific criterion, the one of compressibility [14]. In fact, they are aggregated based on data confidentiality as a basic requirement to use empirical private data. The one-way flow requirement of a single commodity, in elementary exchange, was explained based on the principles of CA and minimum effort (rationality), together with the deduction of the above equations.
The two opposite flows of the same aggregated good come from similar basic goods, with same code of 6 digits level in our research. At the aggregated level the similar but different elementary goods changed between countries are based on the CA scheme in the same year and are added in the same unique amount for the same aggregated commodity. To see also for comparison, the analyze of sameseness [14] – distinctively for export and import. For these reasons the two opposite flows of the same aggregated good are sometime similar in size.
Under these terms there is no evidence of the correlation between lower prices and larger quantities in a strong way so as to sustain a CA-based linear specialization through the unique flow direction (export or import separately) of each aggregated good. In reality every country could be specialized in one or more groups of sub-aggregated goods, but not exclusively.
The average level of prices sustains the decisions to identify the main sense on the economic highway for the aggregated products. To identify the empirical products the statistic average criteria is necessary to be fulfill.
Some of these flows also include those of AA (FDI) and generated flows that typically have a reverse direction compared to the previous exchange before placing FDI. The case is compared with the classic one of CA between two spaces and partners, and developed in the same period.
Under these conditions the same aggregated product flows there are in both directions and seem to double the flow of the same aggregate good between partners and countries. Thus, the understanding of CA as a scientific principle is not met in the absence of an exact purpose of aggregation and of a sense of this aggregation.
The multiple flows in both directions of some empiric commodities invoiced by partner companies are aggregated inside of the same aggregate commodity – according to the classifications of the goods at the different levels of aggregation can not be justified according to the CA scheme. The change of rate between relative elementary prices under or above level 1, in the same period in two regions, is the only case in which the flow direction reversal is justified for some elementary good. In other cases, the reversed direction is generated by new locations of capital on the basis of AA.
The aggregated flows within the economic process, will take the same easiest path as entailed by dominant (majority) elementary flows, with the lowest relative price (statistic average criterion). According to another interpretation, distinct from the understanding of AC at the basic level, explained in the above scheme, we may fall in the case of the aberration of misplaced general, similar with the aberration of misplaced concreteness – according to Whitehead, in [14]. The opposite interests, the permanent negotiation of conditions, the discovery of new resources and the emergence of new technologies make these elementary and aggregated streams have consistently exact directions according to CA requirements. AA (FDI) analytical requirements can be integrated in terms of calculations in those of the CA.
The easiest way to identify the efficient riverbed of the commodity flow from one region to another region is CA. The CA scheme measures and identifies the riverbed by its relative prices as compared to another (price) commodity, which has a reverse flow. The trading costs and negotiation of international prices finally design the riverbed. It can thus be said that the moving directions of goods’ flows of a region result from the four gold numbers/prices, international prices or rates of exchange. These unique way flows are disrupted or mixed by other regions’ investments coming in the noticed region. Based on these flow movements within the economic process, in a specific way, the constructal law is validated in Economics, in weak sense.
Trade analysis based on the collective CA point of view can be consistently supported by countries and regions through total VA, aggregated at the country and sector levels across the EU, and partially at global level (WIOD project). The objectives of convergence and cohesion (just partly), currently promoted by the EU, require the simultaneous use of both aggregated levels of VA measurement in order to determine the efficient utilization of collective (structural) funds allotted to each country (NUTS 0 level) or region NUTS 2 level. In this case only the negotiations between regions, based on preliminary calculations and followed by appropriate decisions can support the consistency of profit-based (AC) individual interests with collective interests, based on the maximization of the total VA (for exchanged goods). Individual interest is included in the first one (collective) and can be harmonized in terms of correlation through measures of an infant-industry type.
So, these tariff or non-tariff measures – as structural funds in EU – simultaneously also promote the profit optimum coming closer to the optimum of minimum unit cost. In this case the energy and mineral resources are saved and the VA growth is tempered. In this case we do not encourage increasing consumption of resources and energy by VA consumption. Under the current circumstances, specialization may be achieved within various structures, for commodity groups, sub-sectors, clusters or mix due to globalized trade relations. The exchange process may thus be subject to a common normative decision on grounds of the cooperation principle so that the collective VA transfer would increase at the same time in all EU regions in line with the principles of convergence and cohesion.
Therefore the same empirical commodity flows are dynamic and may be reversed periodically, at a large change of the ration between prices. The fact that these directions can change – a less common feature in flows from other natural and biological processes, studied by other sciences – is specific to the constructal law on economic processes. The aggregated flows and associated VA represent, for now, the limit of the general analysis. In this case the biunivocal flows it can be similar or equal but without having a powerful meaning. The matter and energy analysis of physical flows currently starts to become a landmark to the irreversible consumption of natural resources, and to their increasing scarcity as well [17].
The weak significance of aggregated flows generated by the flow compensation diminushes the explanation related to individual conflicting interests. The conflicting feature is also found in relations between countries that have not taken into consideration the collective interest between them. The mitigation of this contrariety has the same solution as that between individual and collective AC in the same country: establishing appropriate anthropomorphic rules.
The lack of an analysis regarding the interest does not mean that the contrary interests, not contradictory, would disappear. It could be a reverse case of amplifying the interests.
So, the Dialectics that can explain the movement of economic flows under the constructal law is based on an accurate metrics of basic flows in accordance with CA and AA principles. Essentially the CA domination based on the lowest relative price reveals the economic gravitation within the movement of disaggregated flows of goods. At different aggregation levels the flows are noticed simultaneously as wave and corpuscle (back and forth). The economic capillarity of FDI has its role in feeding complementary flows of absolute advantage. However to develop in Economics a M physics theory about goods flows seems to still have to wait. Before, it is necessary to have a unitary explanation about different aggregate levels in the economic process.
In the case of empirical processes with unique goods, diversity does not seem to have played its full part yet as regards every individual’s arrogant yearning for having different goods and thus being different from others. Insufficient information of traders/consumers, partially because of unjustified high level of data aggregation, completes the explanations of the bi-univocal transfer of identical goods.
The metrics of nominal monetary flows of VA could help us for the decoupling in one unique case: to have simultaneously the understanding of the flows of energy and materials in the same process. The major importance of a stable design of economic flows, identified by the constructal law, is related to the management of VA transfers between regions or countries and perhaps in the near future of the flows one of mineral resources.
The author gratefully acknowledges funding by the Romanian Programme POSCCE, under grant agreement no. PO102418/ 5124 / 22.05.2014, code SMIS 50328.
1. World Trade Organisation, International trade statistics 2001, Geneva, 2001.
2. World Trade Organisation, World Trade Report 2013 Factors shaping the future of world trade, Geneva, 2013.
3. Timmer, M.P. (Ed.). The World Input Output Database (WIOD): Contents, Sources, and Methods. Unpublished manuscris, April 2012. Working Paper Number 10.
4. Timmer, M.P., Dietzenbacher, E., Los, B., Stehrer, R. and de Vries, G.J., “An Illustrated User Guide to the World Input–Output Database: the Case of Global Automotive Production,” Review of International Economics, 2015. DOI: 10.1111/roie.12178.
5. Dietzenbacher, E., Los, B., Stehrer, R. Timmer, M.P., de Vries, G.J., The construction of world input-output tables in the WIOD project, Economic Systems Research, 25:1, 71-98, 2013. DOI: 10.1080/09535314.2012.761180.
6. Manoilescu, M., The National Productive Forces and the External Trade. The Theoretical Scheme of International Trade (Fortele Nationale Productive Si Comertul Exterior. Schema Teoretica A Comertului International, (in Romanian), Romanian Academy Publishing, 1929/2012.
7. Coe, V.F., “The Gains of Trade,” Canadian Journal of Economics and Political Science/ Revue canadienne de economiques et science politique, 1, 588-598, 1935. DOI: 10.1017/S0315489000023677.
8. Manoilescu, M., “Die theoretische Problematik des Aussenhandels. Synthese-Beweisfuhrung Polemik,” Weltwirtschaftliches Archiv, 51(1), Jena, ian. 1940.
9. Bejan A., “Why we want power: Economics is physics,” International Journal of Heat and Mass Transfer, 55, 4929–4935, 2012. DOI: 10.1016/j.ijheatmasstransfer.2012.05.046.
10. Bejan, A., Lorente, S., “The constructal law and the evolution of design in nature,” Physics of Life Reviews 8, 209–240, 2011. DOI: 10.1016/j.plrev.2011.05.010.
11. Bejan A., “Entropy generation minimization, exergy analysis, and the constructal law,” Arabian Journal for Science and Engineering, 38(2), 329–340, 2013.
12. Capra, Fr., The Turning Point: Science, Society, and the Rising Culture, Simon and Schuster, 1982.
13. Soddy, Fr., Wealth, Virtual Wealth and Debt, London, G. Allen & Unwin Ltd., 1926.
14. Georgescu-Roegen N., The Entropy Law and the Economic Process, Harvard University Press, Cambridge, Massachusetts, 1971.
15. Georgescu-Roegen, N., Energy Analysis and Economic Valuation, Southern Economic Journal, 45(4), 1023-1058, 1979.
16. Georgescu-Roegen N., ”Energetic dogma, energetic economics, and viable technologies,“ in Moroney J. (ed), Advances in the Economics of Energy and Resources, vol. 4, JAI Press, Greenwich Conn, 1-39, 1982.
17. EUROSTAT, Economy-wide Material Flow Accounts (EW-MFA), Compilation Guide 2013, Luxembourg, 2013.
18. Smith, A., An Inquiry into the Nature and Causes of the Wealth of Nations, Oxford, Clarendon Press, 1776.
19. Ricardo, D., “On the principles of political economy and taxation,” 1817, in P. Sraffa (ed), The Works and Correspondence of David Ricardo, vol. I, Cambridge University Press, 1951.
20. Dogaru V., “The necessity of basic principles in Economics,” Paper presented at ISSA International Conference, Faculty of Politics Science, West University of Timisoara, Timisoara, 18-20 May 2012, unpublished paper, 2012.
21. Dogaru, V., Introductory Study, in 6, 1-62, 2012.
22. Manoilescu, M., Some esays in the Philosophy of Economic Science (in Romanian), Monitorul Oficial Publishing House, 1938.
23. Staff Department of the Flemish Government, Flemish Strategy for Sustainable Development, Pushing back Frontiers Together - Vision 2050, http://www.sd-network.eu/pdf/country_profiles/BE_Vision%202050%20Sustainable%20Development%20Strategy%20Flanders.pdf, 2011, accessed on 17.04.2015.
24. World Trade Organisation, https://www.wto.org/english/res_e/reser_e/cadv_e.htm, acceded on 14.04.2015.
25. Lamy, P., “Comparative Advantage is Dead? Not at all. Facts and Fictions in International Trade Economics,” Conference on Trade and Inclusive Globalization, Paris School of Economics, http://www.wto.org/english/news_e/sppl_e/sppl152_e.htm,accessed on 17.04.2015, 12 April 2010.
26. Mises, L. von, Human Action, San Francisco, Fox and Wilkes, 1996. https://mises.org/sites/default/files/Human%20Action_3.pdf .
27. Viner, J., Studies in the Theory of International Trade, New York, Harper and Brothers Publishers, 1937.
28. Maneschi, A., Comparative Advantage in International Trade. A Historical Perspective, Edward Elgar, Cheltenham, 1998.
29. Irwin D. A., Against the Tide. An intellectual History of Free Trade, Princeton University Press, 1998.
30. Samuelson P.A., “The way of an economist,” in Samuelson, P.A. ed., International Economic Relations: Proceedings of the Third Congress of the International Economic Association, Macmillan, London, 1-11, 1969.
31. Deardorff A., “The general validity of the law of comparative advantage,” Journal of Political Economy 88, 941-57, October 1980.
32. Deardorff A., “How robust is comparative advantage?,” Paper prepared for a session of the 2005 AEA meetings, “On the 75th Anniversary of the Opportunity Cost Formulation of Comparative Advantage,” January 7, 2005.
33. Ruffin, R., “David Ricardo’s Discovery of Comparative Advantage,” History of Political Economy, 34(4), 727-748, winter 2002. DOI: 10.1215/00182702-34-4-727.
34. Gehrke, C., “Ricardo’s discovery of comparative advantage revisited February 2014,” Graz Economics Papers GEP-2014-02, http://www-classic.uni-graz.at/vwlwww/forschung/RePEc/ wpaper/2014-02.pdf, February 2014.
35. Meelis Kitsing, “mind the gap: misrepresentation of comparative advantage in international relations textbooks,” Proceedings of the American Political Science Associations, Annual Meeting Conference, 30 August -2 September 2007, Chicago, 2007.
36. Dogaru, V., “The theoretic scheme of the international trade,” The generalizing of the Manoilescu’s formula, Revista Romana de Statistica (Romanian Statistics Journal), (in Romanian), 45-64, July 2000.
37. Dogaru, V., “The Comparative Advantage in Generalised Manoilescu Scheme,” Romanian Journal for Economic Forecasting, no 3, 91-113, 2005.
38. Dogaru, V., “The Relationship between the Comparative and Absolute Advantage – a Note,” in Proceedings of the 2nd International Scientific Conference Economy and Globalisation, tome I, Universitaria Publishing House, 35-40, Craiova, 2005
39. Dogaru, V., “The general validity of comparative advantage in trade exchanges,” Romanian Economic Review, Romanian Academy, tome 49-50 (in Romanian), Bucharest, (in English, http://mpra.ub.uni-muenchen.de/6882), 2004-2005.
40. Dogaru, V., “Schema generalizata Manoilescu privind schimbul international de bunuri – o prezentare generala,” Probleme Economice, nr. 226-227, Bucharest, 2006.
41. Dogaru, V., “some remarks on the demythification of the comparative advantage usage according to Manoilescu Generalized Scheme,” Oeconomica, 8, 111-140, June (in English, http://mpra.ub.uni-muenchen.de/6918), 2005.
42. Dogaru, V., “The trade costs algorithm in Manoilescu Generalised Scheme,” Annals of the Oradea University, Fascicle of Management and Technological Engineering, Volume VI (XVI), 2558-2571, (http://mpra.ub.uni-muenchen.de/6919), 2007.
43. Coutts, K.J., “Average Cost Pricing, J. Eatwell, M. Milgate, P. Newman (eds.),” The New Palgrave, A Dictionary of Economics, vol. 1, Macmillan London, 158, 1998.
44. Dogaru, V., “The comparative advantage in internal exchange and the production possibility frontier,” Revista Romana de Statistica, (in Romanian), 4, 66-83, 2003.
45. Dogaru, V., Some analytical trends in trade flows from developing countries – some calculus with stylized facts, in The Proceedings of the International Conference The Research World of Interconnection, November 13-14, 2015 Timisoara, Romania.
46. Dogaru, V., “Algorithm of the Currency Exchange in Manoilescu Generalised Scheme,” Annals of the Oradea University, Fascicle of Management and Technological Engineering, Volume VI (XVI), 2549-2557, (http://mpra.ub.uni-muenchen.de/6917), 2007.
47. Schumpeter, 1949, Theory of Economic Development, Cambridge, Mass, 1949.
48. Amin, S., L’échange inégal et la lois de la valeur, Paris, 1973.
49. Bhagwati, J., Lectures on International Trade, MIT Press, Cambridge, Mass, 1998.
50. Emmanuel, A., Unequal Exchange. A study of Imperialism of Trade, New York, London, 1972.
51. Findlay, R., „Terms of Trade,” in: J. Eatwell, M. Milgate, P. Newman (eds.), The New Palgrave. A Dictionary of Economics, vol. 4, Macmillan London, pp.623-626, 1998.
52. Korten, D. C., “Agenda for a new economy. From phantom wealth to real wealth,” The People-centered Developed Forum, 2009.
53. Prebisch, R., The Economic Development of Latin America and Its Principal Problems, New York: ECLA, UN Department of Economic Affairs, 1950.
54. Reich, U.P., “Inequality of value in international trade. An input-output approach,” Szigma XXXI, 107-119, 2000.
55. Singer, H.W., “Terms of trade and economic development,” in: J.Eatwell, M. Milgate, P.Newman (eds.), The New Palgrave. A Dictionary of Economics vol. 4, Macmillan London, pp.626-628, 1998.
56. Brolin John, “The Bias of the World. Theories of Unequal Exchange in History,” Lund Studies in Human Ecology 9, Lund University, 2006.
57. Reich, U.-P., „Inequality in exchange: the use of a world trade flow table for analyzing the international economy,” Economic Systems Research, 19, S. 375-396, 2007. DOI: 10.1080/09535310701698449.
58. Kravis I. B., Kenessey, Z., Heston, A., Summers, R., A System of International Comparisons of Gross Product and Purchasing Power, The John Hopkins University Press, Baltimore, 1975.
59. Dogaru, V., “Some arguments for an integrated tool in economic and energy valuation,” 361-373, chapter 24, in Reddy, B. Sudhakara, Ulgiati, Sergio (Eds.) Energy Security and Development: Global Context and Indian Perspective, Springer, 2015.
60. Porter, Michael, The Competitive Advantage of Nations, The Free Press, New York, 1990.