OPEN ACCESS
In the past, to make the city liveable, the urban morphology has always be considered taking into account the climate, the buildings’ density and characteristics, the type of inhabitants and their social condition. On the contrary, recently in the urban planning process the morphological aspects are no more included even if they influence the energy consumption, the thermal comfort of the urban spaces and the district air quality. Moreover, the socio-economic conditions of inhabitants might strongly affect the lifestyle choice and behavior of building occupants and thus, the probability of success of urban planning measures for energy conservation. The present study aims to: 1) identify the correlation between thermal energy consumption for space heating and urban variables and 2) investigate the role of socio-economic variables in energy savings potential.
The city of Turin is suitable for these analyses because it is characterized by different urban forms and urban spaces and by various characteristics of the population. By using a GIS tool, the district 3, chosen as a case study, has been divided into different urban textures considering their urban and socio-economic characteristics. The results of this study show that the measured energy consumption of single building depends on the physical building features (f.i. thermal insulation level, the compactness, the energy system efficiency etc.) but also on the urban form and the streets’ orientation. Another important result is that the social and economic situation of inhabitants has a relevant role in the success of sustainable policies. These conclusions may support urban planners in the definition of new urban areas with some “preliminary” energy savings measures at no cost and in formulating tailored policies according to socio-economic conditions from district to district. (Presented at the AIGE Conference 2015)
Energy consumption, Space heating, Urban form, Energy savings, Socio-economic variables.
Urban areas are gaining more and more importance for strategic long-term energy planning since the urbanization phenomenon is raising the demand of new services and energy needs. As indicated by the IPCC [1], about the 70% of the energy demand is requested by cities; and, in 2050, according to United Nations [2], cities will host 2.5 billion people more.
As in the past, the urban form has an important role for the liveability of the city, the outdoor urban spaces and the indoor comfort. Besides, buildings envelopes and orientation were studied to limit heat dispersions and increase solar heat gains.
In recent years, in densely populated and urbanized areas the relationships between urban variables - like morphology, density and solar exposure - and buildings characteristics, have been analysed in order to identify their correlations and to estimate simplified models for space heating thermal energy consumption.
Considering that most of EU buildings pre-dates the ‘80s and are in compelling need of renovation, urban morphology can also help in the definition of energy savings strategies reducing the fossil fuel consumptions and then pollutant emissions.
Also, socio-economic variables of inhabitants such as income, education level, ownership of the house etc. can highly impact on the real feasibility and implementation of energy buildings’ retrofit.
The aim of the present study is to analyse the impact of both urban form and socio-economic variables on buildings’ energy consumptions in urban areas in order to help policy makers in planning new cities and in promoting tailored policies according to real built contest and inhabitants characteristics. This work ensues from previous researches in Italian urban contest [3, 4].
The city of Turin is suitable for these analyses because it is composed by ten districts built in different periods and, consequently, characterized by different urban forms, urban spaces and socio-economic conditions of inhabitants.
In the “state of the art” section, an overview on the main studies about the influence of urban form in heating energy energy-use and on socio-economic variables has been drafted. In the “methodology” section, a “case study”, characterized by a sample of buildings in the city of Turin, supports the analysis. The key results and the final statements are reported in the last paragraphs “results and discussions” and “conclusions”.
In the next two sub sections, an overview on the state of art of researches focused on the relationships among urban form and energy consumptions as well as on the impact of socio-economic demographic variables on energy conservation is provided.
2.1 Urban morphology
Analyses on buildings form archetypes have been performed since the ‘60s, especially for pointing out the relationship between urban form and land use [5, 6]. In these years many researches were focused on evaluating the environmental performance of the urban texture, f.i. daylight availability [7], thermal comfort [8, 9], climate [10] etc. Main works to refer and the field of application are summarized in Tab.1.
Table 1. Main researches related to urban form
|
Application field |
Main references |
|
Land use |
[5,6] |
|
Environment, climate, thermal comfort |
[7, 8, 9, 10, 11, 12, 13, 14, 15] |
|
Daylight availability and solar potential |
[7, 15, 16, 17, 18, 19, 20, 21] |
|
Energy consumption in: |
|
|
mobility |
[16, 22, 23, 24, 25, 26, 27] |
|
buildings |
[15, 27, 28, 29, 30] |
In these analyses usually the city is dived into building blocks/textures with group of private/public buildings, open spaces and streets. The division allows defining the urban metric [31] which is extremely useful to define parameters for measuring physical quantities related to environmental monitoring [12] and for energy efficiency analysis [32]. More recently, the links between urban form and energy consumption has been evaluated by many researches especially focusing on mobility energy consumption.
Anyway, some researchers have also been focused on searching the correlation with building energy-use and urban morphology. Related to buildings energy consumption at individual building level, many studies have been concentrated on the quality and quantity of the urban building, extremely important for space heating and cooling energy demand [33, 34, 35]. These analyses do not consider the shape of urban built environment and the different aggregation and configuration of building types, but anyway have been a basis for further correlation to urban form and building energy consumption. In fact, at the urban scale, the configuration of cities affect climate (indoor and outdoor) and have direct effects on the energy-use. Researches related to the urban configuration and building energy use – operational and embodied – has been carried on in recent years (Tab.1). The results of these researches highlight that: one of the main sensible parameter connected to the urban texture is the fenestration ratio [28]; urban morphology can impact on heat energy demand up to a factor of six [29]; tall and compact buildings are characterized by higher energy efficiency while detached houses by the lowest [29]; urban compactness affects household energy-use and the relative carbon emissions [26]. The latter point, concerning the relationship among compactness and sustainability, is still under debate, as in the past, compact urban forms with high densities have been considered suitable for reaching sustainability targets [22, 8] and to improve energy efficiency [36].
Moreover, with the growing concerns on climate change, the research started to focus also on the potential penetration of renewable energy sources in cities; in particular the relationship between solar renewable technologies potential and daylight availability on building facades, built forms and density considering different design criteria have been investigated. Results show that random configurations and scattered layouts both horizontally and vertically represent good solution for exploiting solar energy technologies on building facades. Results pointed out that: in dense cities the contribution of solar energy decrease by 10-75% [18, 19]; right urban configuration can determine a potential improvement of 24% in solar energy production in Maceio`(Brazil) [20]); solar irradiation of roofs could be increased by 9%, while that of façades could increase by up to 45% in London [21]; changes in building height are the most sensitive parameters affecting the exposure to the sky and solar irradiation [14].
To conclude, from previous studies can be highlighted that sky view factor at ground level has impacts on heat island effect, air pollution and surface energy balance [15]; the aspect ratio (the greater it is and the lower is the solar irradiation exposure and the outdoor air flow movement), the distance between buildings in both axes (the greater it is and the greater is the daylight luminance level), the albedo (the greater it is and the lower is the heat island effect), the building width and the surface to volume ratio are the variables with higher impact on solar gains potential [20]; that climate highly impacts on the buildings’ energy-use and, in arid climatic areas, the courtyards configuration has a better response to environmental variables compared to pavilion types which are not suitable for humid/tropical zones [13]. In general, the most influent identified parameters for energy consumption in cities are built density, heated volume, urban morphology, the street type and their connectivity [27]. Moreover, for many researchers, compact urban blocks consistently perform better compared to detached houses, but the debate is still on going.
Most of previous studies on the relationship between energy-use and morphology focused on transport, energy sources and solar potential; just few analyses evaluate how energy consumption for buildings’ space heating is affected by the urban form. In this work the influence of urban form on residential energy consumption is analytically evaluated comparing real consumption data with blocks of buildings urban variables.
2.2 Socio-economic demographic variables
Studies focused on the penetration of sustainable “green” issues depending on social conditions of population have been performed in recent years; they underlined that buildings’ characteristics, their inhabitants and the social contest can influence the success of green policies. Burger and Gochfeld [37] and Gamba (1994) [38] assessed on recycling correlated with green behaviour of inhabitants and their social relationships, often linked to the neighbourhood emotional tie [39] and the probability to establish standards regulating the energy conservation measures [40]. Xu et al. (2012) [41] studied the effect of energy performance at blocks of buildings scale and verified the improvements in terms of energy performances as eco-feedback benefits. Anyway, all these studies were focused on social behaviour impacts on energy conservation in terms of energy savings and penetration of “green” lifestyles.
The research proposed in this paper aims to investigate how socio-economic variables influence social behaviours in terms of buildings’ retrofit investment feasibility. Previously, this topic was analysed in Mutani et al. (2013) [42] assuming the main socio-economic variables affecting the building renovation potential for the Metropolitan City of Turin in Italy. The considered variables were: age, educational level, work occupancy, buildings ownership and type of family. All the parameters were correlated to the probability of investing/participating in retrofit measures. Accordingly, with the influence of each variable in the retrofit feasibility, different weights have been assigned. Then four feasibility classes were defined and associated to different buildings retrofit measures, estimating the energy savings potential. The same methodology has been applied by Delmastro et al. (2015) [43] to investigate the energy savings potential of a district powered by a refurbished district heating network.
In this research, the study of [42] has been taken as a basis for investing the potential and feasibility of energy savings measures. The proposed paper uses the historical database of energy performance certificates to validate and improve the assumed model for feasibility buildings’ retrofit.
Results can help, together with occupant behaviour analysis [44, 45] in improving people awareness in energy saving measures and greener lifestyle. Several studies underlined an important variability in energy-use in terms of operation and management of systems’ settings, where ‘behaviour’ is central key in energy consumption [46, 47, 48]. How the occupant behaviour is influenced by socio-economic conditions is still to be analysed.
The case study refers to a district in the city of Turin, in the North-West part of Italy, in the temperate continental climatic zone (2617 HDD at 20°C). Turin is characterized by 10 districts, about 40,000 residential buildings (most of them built before the ‘80s) and 3839 census sections. The case study is composed by a sample of 300 residential buildings selected in the district called “District 3”. In order to evaluate the urban characteristics, the district has been divided into 484 different urban block of buildings (census parcels) by using a GIS tool.
Streets orientation, building density, building heights, building coverage ratio, aspect ratio and average albedo coefficient have been considered, and the socio-economic variables (instruction level, average age, work occupancy, number of person per family, buildings ownership, period of construction and heated volume) have been associated to each census parcels.
The local district heating company provided space heating consumption data and the heated volume for the selected buildings. The energy-use data have a monthly detail, for three consecutive heating seasons: 2011/2012, 2012/2013 and 2013/2014.
In Fig.1 the yearly space heating data have been normalized considering the standard Heating Degree-Days (2617 HDD, UNI 10349:1994). It can be detected that there is not a great variation of the buildings’ energy-use and the relationship among building heated volume and energy consumption can be linear. Sample building volumes are between 3,000 and 30,000 m3 while consumption is between 55 and 240 kWh/m2/yr.
In order to consider only buildings with similar characteristics in terms of compactness, typology and construction period (from 1946 to 1980), 97 big condominiums with low values of surface to volume ratio were selected. Then, the variation in annual energy-use could be associated to the different urban contests (Eq. 1).
$\left.\frac{k W h}{m^{2}}\right|_{\text {measured}}=\left.\frac{k W h}{m^{2}}\right|_{\text {building}} \pm\left.\frac{k W h}{m^{2}}\right|_{\text {urban contest}}$ (1)
Figure 1. Yearly energy consumption of sample buildings for the heating seasons 2011/2012, 2012/2013 and 2013/2014 (climate corrected with 2617 HDD)
In the urban context, the building stock’s energy consumption is affected by many factors that include the town planning criteria and the socio-economic factors. The most important parameters that influence buildings’ energy performance, increasing or reducing the final energy-use for both winter heating and summer cooling, are: the design of the built environment; the relationship between the buildings and the open spaces; the type of materials of the external surfaces; the socio-economic data related to population and buildings census; the type of obstructions.
The following analyses evaluate how energy consumptions might depend also on urban contest and how the socio-economic conditions may influence the feasibility of the buildings’ retrofit.
4.1 The town planning criteria
In order to take into account urban variables in residential energy consumption models, two urban factors have been calculated: the “Urban morphology” factor (U) and the “solar exPosure” factor (Ps).
The “Urban morphology” factor (Eq.2) describes the urban configuration considering the distribution of building heights (H), the relative distance among buildings (W) and the buildings’ coverage ratio (BC). This latter variable (BC) describes the relationship between the open spaces and the buildings’ footprint; it can vary from 0 (the area totally uncovered) to 1 (the area completely covered). The “height to distance” ratio (H/W) calculates the relationship of buildings’ height and their distance considering an average value characteristic of the census section.
The “Urban morphology” factor (U) includes, indirectly, two other variables: the buildings’ density (BD) and the average buildings’ distance (W):
$U=B C \cdot H / W=B D / W$ (2)
The “solar exPosure” (Ps) is function of the heights of the buildings (H) and of the main orientation of the streets (MOS).
The main orientation of the streets (MOS) influences the orientation of the overlooking buildings and the shadowing on the outdoor spaces. With East-West orientation, the solar gains are greater than with North-South orientation. To quantify this variable, a value of 1 has been attributed to orientation of 45° from South, values of 1.3 to East-West and 0.7 to South-North orientations.
In Eq. 3 the height of each building is compared with the average height of the surrounding (H/Hm) and the solar exPosure (Ps) is:
$\mathrm{Ps}=\frac{\mathrm{H}}{\mathrm{Hm}} * \mathrm{MOS}$ (3)
The “albedo” factor (A) should normally be considered because it influences the outdoor temperatures; it depends on the outdoor surfaces materials as paved streets, green areas and buildings’ facades and roofs.
Since the chosen area (District 3) is characterized by similar materials, the albedo is constant and it does not influence the variations in energy-use. Thus, in this analysis the albedo is neglected and the Global urban factor (GUPs) is evaluated as the product between the “Urban morphology” factor (U) and the “solar exPosure” factor (Ps) considering an average value (Global) on each census sections (Eq. 4).
$\mathrm{GUPs}=$ Global value $(\mathrm{U}, \mathrm{Ps})$ (4)
In this work, the energy-use for residential space heating is compared among each census section in order to evaluate the correlation between urban contest characteristics (GUPs) and energy consumption data for buildings’ space heating.
4.2 The Socio-economic factors of inhabitants
In this subsection, the methodology for defining the correlation between the feasibility of residential buildings’ retrofit and socio-economic variables is described. The procedure is based on the previous analysis performed by [42]. The socio-economic analysis aims to identify a model able to describe the citizens’ disposability and sensitivity to buildings’ refurbishment. The considered socio-economic factors are following:
1.The age factor (fa): the ratio between population with an age in the range of 25 - 69 years and the total population.
2.The employment factor (fe): the ratio between the employed part of population and the total active population.
3.The property factor (fp): the ratio between the number of families that own their apartment and the total number of families.
4.The family factor (ff): the ratio between the number of families composed by 1-2 components and the total number of families.
5.The education factor (fed): the ratio between the population with high school diploma or higher instruction level and the total population.
6.The building’s occupation factor (fo): the percentage of buildings that are occupied during the whole year.
7.The period of construction (fpc): the number of buildings built before 1945 over the total number of buildings.
Higher values of the selected socio-economic factors mean a higher feasibility of retrofit in buildings. The factors need to be comparable and thus they have been normalized with respect to their mean value. With the normalization, all the factors have an average value of 0.5.
Moreover, the impact of the different factors on the retrofit feasibility process is different according to the relevance of the parameter on the willingness and capability to invest. Thus, a different weight has to be associated to each factor.
The analysis considers the 3839 census sections of the city of Turin. In Tab. 2 the mean value and the standard deviation of each variable are reported.
Table 2. Mean and standard deviation values for the socio-economic factors before the normalisation
|
Factors |
Mean value |
Standard deviation |
|
age (fa) |
0.56 |
0.09 |
|
employment (fem) |
0.91 |
0.07 |
|
property (fp) |
0.61 |
0.21 |
|
family (ff) |
0.65 |
0.30 |
|
education (fed) |
0.47 |
0.16 |
|
building’s occupation (fo) |
0.90 |
0.11 |
|
period of construction (fpc) |
0.65 |
0.37 |
This methodology is intended to be easily replicable in other territorial contexts and allows a progressive update and improvement of the model.
By assigning the weight to each factor, a final feasibility index F can be calculated multiplying the normalized “n” socio-economic factor by a coefficient α (Eq.5):
$F=\alpha_{1} f_{a, n}+\alpha_{2} f_{e m, n}+\alpha_{3} f_{p, n}+\alpha_{4} f_{f, n}+\alpha_{5} f_{e d, n}+ \propto_{6} f_{o, n}+\alpha_{7} f_{c}$ (5)
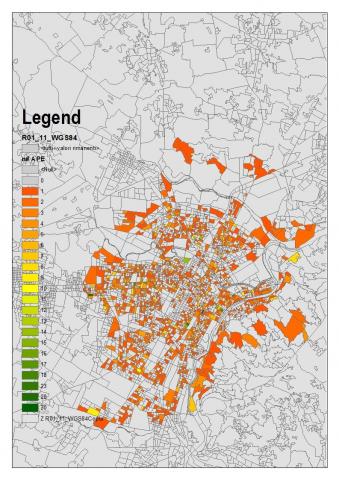
In this paper, to test the procedure based on a Multiple Linear Regression Model, the available data on building renovations derived from the energy certifications registered in the Piedmont Region from 2009 have been used. Starting from 3,839 Turin census sections with 141,085 energy performance certificates (APE), the analysis was focused on 3,510 retrofit interventions APE (2.5%) in only 1,431 sections.
The future goal is to define different values of benchmarking for energy savings to the different socio-economic groups of population. Starting from the evaluation of the feasibility index, different classes of feasibility can be defined; to each class a different level of buildings’ retrofit can be associated [42].
In this section, results of the analyses are discussed separately for urban morphology and feasibility of buildings’ retrofit.
5.1 Correlation between urban morphology and energy consumption for space heating in buildings
The “Urban morphology” factor (U) and the “solar exPosure” factor (Ps) affect the thermal energy-use for space heating of a block of buildings in two different ways:
1.If the urban coverage ratio or the buildings’ density are too low or too high, the energy-use for space heating grows because the buildings are too isolated or closed; thus, the energy-use values are low for “optimal” values of the “Urban morphology” factor U.
2.The space heating energy-use decreases if the “solar exPosure” factor Ps increases (as the solar heat gains in winter time increase).
The optimal values of “Urban morphology” factor U can be calculated by multiplying a constant Buildings’ Coverage ratio (BC) by a typical value of the aspect ratio (H/W). In urban planning practices, the typical height to distance ratio (H/W) is of 1 ± 10%. With higher values of H/W, buildings are very closed, with limited solar heat gains and a low solar exposure in urban canyon. With lower values of H/W, solar heat gains increase but the external air temperature decreases locally because the urban canyon effect is absent. The buildings’ coverage ratio can significantly vary between different districts, depending on the relationship between open areas (uncovered) and buildings (covered). Fixing the height to distance ratio equal to 1 ± 10% and the width of the streets (about 10 meters), as the typical values, the standard coverage ratio will be consequently determined. Obviously the coverage ratio depends on the buildings’ footprint: the lower is the footprint (detached houses), the lower is the coverage ratio and vice versa. Considering an average value between different configurations, the typical coverage ratio is about 33%. The global “Urban morphology” factor (GU) can be used to set three urban morphology classes for each census section:
•Class 1: GU < 0.30
•Class 2: 0.30 ≤ GU ≤ 0.36 (the optimal)
•Class 3: GU > 0.36.
The buildings’ coverage ratio and the distance between facing buildings are correlated variables, since the variation of one inversely influences the other. With lower distances between opposite buildings, the coverage ratio increases, and vice versa. In Class 1 the buildings are closer (with constant height) or, otherwise, the heights are greater with constant distances; vice versa in class 3. In both cases, the heating energy-use will be higher compared to Class 2, but for different reasons: with lower “Urban morphology” factors the solar gains are not compromised by close and high facing buildings, but the canyon effect between external walls is almost absent; with higher values, vice versa, the shadowing effects are predominant, limiting somehow also the canyon effect since the solar radiation is unable to be reflected between the facades.
Regarding the “solar exPosure” factor, with an East-West building axis, the solar heat gains are higher, since the solar radiation is available during all the daytime. This factor is represented by the main orientation of the streets (MOS). The solar exposure ratio (H/Hm), otherwise, takes into account the average shadowing component: higher or lower values mean that the buildings have different heights with more or less solar heat gains.
The optimal class has been fixed considering a range of orientations between -30° and +30° from the East-West axis, with an equivalent value of the main orientation of the streets (MOS) higher than 1.15, and a solar exposure ratio (H/Hm) higher than 1.1.
In this work the “solar exPosure” factor (Ps) has been divided in two classes: the optimal is represented by values higher than 1.26 (Eq.6).
Ps (optimal class) $=(H / H m>1.1) *(M O S>1.15)$ (6)
The Urban morphology” factor (U) and the “solar exPosure” factor (Ps) can be analyzed singularly, but their combination will provide further information about the thermal energy demand behaviour of a district.
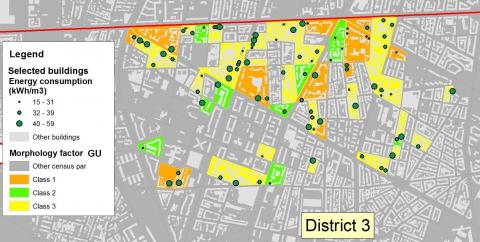
Intersecting the parameters, a final matrix composed by six cells can be obtained (Tab. 3). Districts with a standard coverage ratio, an optimal height to distance ratio (H/W = 1), with a prevalent East-West streets’ orientation and a high solar exposure, will register lower values of thermal energy-use. For each census parcel, the urban variables and the global U and Ps factors have been calculated and attributed, using a Geographical Information System (GIS) tool. The first analysis was about the classification of the parcels using the six classes of Tab. 3. In Tab. 4 the percentage of buildings for each class has been represented. The district 3 of Turin is mainly characterized by high and close buildings (66%, class 3 of U), since the coverage ratio is equivalent to the average value (0.33) considered in the definition of the optimal class for the “Urban morphology” factor. Only the 12% of the buildings is included in census sections with an optimal urban morphology (class 2 of U). Anyway, most of the sample (62%) is within the optimal class regarding the “solar exPosure” factor.
Globally, the 8% of the considered buildings has the best urban energy performances, whereas the 33% has the worst.
Finally, the comparison of the average heating energy consumption for space heating on each census section has been examined for different class of U and Ps factors. The results presented in Tab. 5 confirm the role of urban morphology and solar exposure factors on the energy consumptions for space heating in residential buildings.
In Fig. 2 the map of the energy-use for space heating for the sample of the residential buildings in district 3 in the city of Turin is represented.
Figure 2. The energy-use for residential space heating and the urban Morphology classes
Despite the first hypothesis, in which districts with a high “Urban morphology” factor and a not optimal “solar exPosure” factor were considered as high energy-use ones (Tab. 3), the data highlight a different result. In fact, the “solar exPosure” factor seems to be irrelevant in case of high density districts: this consideration has a logical reason, since the radiation in this type of urban districts, during the heating season, has a low influence, both for the limitation of the solar heat gains due to high shadowing effects and the insufficient contribution of the urban canyon effect.
Table 3. The higher (H), mean (M) and lower (L) energy-use with different combination of GU and Ps classes
|
solar exPosure Ps factor class |
Global Urban morphology GU |
||
|
Class 1 |
Class 2 (Optimal) |
Class 3 |
|
|
Not Optimal |
H |
M |
H |
|
Optimal |
M |
L |
M |
Table 4. Percentage of buildings in “Urban morphology” and “solar exPosure” classes
|
solar exPosure Ps factor class |
Global Urban morphology GU |
||
|
Class 1 |
Class 2 (Optimal) |
Class 3 |
|
|
Not Optimal |
11% |
4% |
22% |
|
Optimal |
10% |
8% |
44% |
Table 5. Average buildings’ heating energy-use (kWh/m3)
|
solar exPosure Ps factor class |
Global Urban morphology GU |
||
|
Class 1 |
Class 2 (Optimal) |
Class 3 |
|
|
Not Optimal |
39 |
36 |
36 |
|
Optimal |
34 |
29 |
36 |
5.2 Correlation between urban socio-economic factors and building retrofit feasibility
In order to define the weights of the socio-economic factors (Eq. 5) and to highlight which are the more relevant ones, a multiple linear regression model has been created to calculate the buildings’ retrofit feasibility. Then, the model correlates the buildings’ retrofit feasibility as the number of energy performance certificates APE (for buildings and for apartments) to the socio-economic variables. In Tab. 6 the resulting correlation indexes are reported for each socio-economic variable; negative correlations were neglected.
Table 6. Coefficient of correlation among socio-economic factors and energy performance certificates APE number
|
Socio-economic variables |
Coefficients of correlation |
|
|
nAPE/buildings |
nAPE/apartments . 10 |
|
|
age (fa) |
- |
0,75 |
|
employment (fem) |
0,58 |
0,59 |
|
property (fp) |
- |
- |
|
family (ff) |
- |
- |
|
education (fed) |
0.55 |
0,89 |
|
building’s occupation (fo) |
0,14 |
- |
|
period of construction (fpc) |
0,50 |
0,77 |
The multiple linear regression analysis was optimised considering only the set of variables having a strong correlation with the socio-economic variables (Tab. 6). The correlation coefficients of apartments have been multiplied by 10 because the number of APE/apartments was too low.
Comparing the real number of APE represented in Fig. 3 and the correlation coefficients in Tab. 6, the weights of the different socio-economic variables and consequently the feasibility indexes for buildings Fape/b (Eq. 7) and for apartments Fape/a (Eq. 8) - can be defined.
$F_{A P E / b}=0.421 \cdot f_{p c, n}+0.137 \cdot f_{e d, n}+0.078 f_{e m, n}+ 0.024 \cdot f_{o, n}$ (7)
$F_{A P E / a} \cdot 10=0.328 \cdot f_{p c, n}+0.278 f_{e d, n}$ (8)
Figure 3. Number of energy performance certificates (APE) per census section due to buildings’ retrofit interventions in Turin
As it is possible to observe from the multivariable linear regressions (Eq. 7 and 8), the most influencing socio-economic variables are the buildings’ period of construction and the education level of inhabitants. Only in the feasibility index per building, the inhabitants’ employment rate and the buildings’ occupation percentage are relevant.
This work highlights the importance of a good urban planning in reducing the thermal energy consumption of a district and to increase the quality of life of citizens, both inside and outside the buildings. The analysis underlines the key role of two urban variables: the height to distance ratio and the main orientation of streets and buildings. In the first case, the distance between opposite buildings is a crucial aspect in generating a positive urban canyon effect during the wintertime, increasing the absorption of solar irradiation. The height of the buildings should be planned in relation to the “optimal” distance, avoiding shadowing effects in wintertime, when the solar height is lower. Regarding the main orientation of streets and buildings, the urban design should prefer the East-West orientation, maximizing the exposure and solar heat gains. Moreover, with the new regulations on renewable energy sources (e.g. photovoltaic and solar thermal), the availability of a large south exposed pitched roof becomes an essential requirement.
These considerations are limited to the heating season, since in summertime the situation is almost the opposite. Anyway, to mitigate the solar absorption in summertime other solutions can be evaluated as: natural or artificial shields, green roofs, deciduous and broadleaf vegetation, etc.
From the results obtained with the analysis on the district 3 of Turin (Tab. 4 and Tab. 5), some considerations can be deduced. First of all, the average consumption of buildings in class 2 of the “Urban morphology” factor is considerably lower than the other classes: -14% compared to class 1 and -11% to class 3. Applying these coefficients to an entire district of about 10,000 inhabitants, the difference between the “optimal” urban model and the others amount to 4.5 GWh.
The “solar exPosure” factor represents also a key element in diversifying the space heating energy consumption: the districts with a prevalent non-optimal condition have an average energy-use of +5%. The situation changes significantly between high density (class 3) and low density districts: in the first case, the “solar exPosure” factor is almost absent, since the shadowing effects are predominant, limiting also the urban canyon effect. Therefore, the gap between the optimal and not optimal classes is negligible. Otherwise, in class 1 (very low buildings’ density), the “solar exPosure” factor become the most important parameter in diversifying the thermal energy-use, and the gap between optimal and not optimal conditions is higher of about 13%.
Comparing the best and the worst combination of urban factors the incidence of urban planning is really impressive and equal to 26% in reducing the energy-use of the buildings.
The final result confirms the centrality of urban planning in modifying the thermal energy-use of a block of buildings. These considerations should be included in the design of new urban areas, but can find an application also in the retrofit of existing neighbourhoods. During the strategy definition for energy retrofit, another important aspect to be taken into account by urban planners is the distribution of population in terms of socio-economic conditions. In Turin, the feasibility of retrofit measures depends mainly by:
•The buildings’ period of construction and percentage of heated volume and
•The inhabitants educational level and employment rate.
Results are reasonable for two reasons: the construction period affects the need of renovation of a building; education level is positively correlated to income and thus to the capability of afford the investment and to the awareness on energy savings effects on the environment or as a good economic investment.
Anyway, collecting more energy performance certificates from the Piedmont Region can improve the consistency of the feasibility model in future analyses.
Special thanks to Adelaide Ramassotto & Tatsiana Hubina (CSI Piemonte) and Francesco Fiermonte (LARTU, Politecnico di Torino) for their support in the share, development and analysis of spatial data.
1. Revi, A., Satterthwaite, D.E., Aragón-Durand, F., Corfee-Morlot, J., Kiunsi, R.B.R., Pelling, M., Roberts, D.C., Solecki, W., Urban Areas, Climate Change 2014: Impacts, Adaptation, and Vulnerability. Part A: Global and Sectoral Aspects, Contribution of Working Group II to the Fifth Assessment Report of the Intergovernmental Panel on Climate Change, Cambridge University Press, Cambridge, United Kingdom and New York, NY, USA, (2014), 535-612.
2. United Nations, http://esa.un.org/unpd/wpp/, last access: October 2015.
3. Delmastro, C., Mutani, G., Pastorelli, M., Vicentini, G., “Urban morphology and energy consumption in Italian residential buildings”, Proceeding of the International Conference on Renewable Energy Research and Applications ICRERA-2015, Palermo (Italy).
4. Delmastro, C., Mutani, G., Schranz, L., “The evaluation of buildings energy consumption and the optimization of district heating networks: a GIS-based model,” International Journal of Energy and Environmental Engineering, Special Issue of the 8th AIGE Conference, (2015), 1-9. DOI: 10.1007/s40095-015-0161-5.
5. Martin, L., March, L. (Eds.), Urban Space and Structures, Cambridge University Press, UK, (1972).
6. Gupta, V., “Solar radiation and urban design for hot climates,” Environment and Planning B: Planning and Design, 11, (1984), 435–454. DOI: 10.1068/b110435.
7. Cheung, H.D., Chung, T.M., “Calculation of the vertical daylight factor on window facades in a dense urban environment,” Architectural Science Review, 48 (2005), 81–92. DOI: 10.3763/asre.2005.4811.
8. Jenks, M., Burton, E., Williams, K., The Compact City: A Sustainable Urban Form? E & FN Spon, London, (1996).
9. Mazzotta A., Mutani G., “Environmental high performance urban landcover: experimentations in Urban Barriera”, 6th International Building Physics Conference (2015), Energy Procedia. DOI: 10.1016/j.egypro.2015.11.059.
10. Wong, M.S., Nichol, J.E., To, P.H., Wang, J., “A simple method for designation of urban ventilation corridors and its application to urban heat island analysis,” Building and Environment, 45 (2010), 1880–1889. DOI: 10.1016/j.buildenv.2010.02.019.
11. Wong, N.H., Feriadi, H., Lim, P.Y., Tham, K.W., Sekhar, C.,Cheong, K.W., “Thermal comfort evaluation of naturally ventilated public housing in Singapore,” Building and Environment, 37 (2002), 1267–1277. DOI: 10.1016/S0360-1323(01)00103-2.
12. Edussuriya, P., Chan, A., & Ye, A. (2011), “Urban morphology and air quality in dense residential environments in Hong Kong, Part I: District-level analysis,” Atmospheric Environment, 45 (27), 4789–4803. DOI: 10.1016/j.atmosenv.2009.07.061.
13. Ratti, C., Raydan, D., Steemers, K., “Building form and environmental performance: archetypes, analysis and an arid climate,” Energy and Buildings, 35 (2003), 49–59. DOI: 10.1016/S0378-7788(02)00079-8.
14. Zhang, J., Heng, C.K., Malone-Lee, L.C., Chung Hii, D.J.,Janssen, P., Shing Leung, K., Kiang Tan, B., “Evaluating environmental implications of density: A comparative case study on the relationship between density,” Urban Block Typology and Sky Exposure, Automation in Construction, 22 (2012), 90–101.
15. Svensson, M.K., “Sky view factor analysis - implications for urban air temperature differences,” Meteorological Applications, 11, (2004), 201-211. DOI: 10.1017/S1350482704001288.
16. Chen, Y., Li X, Zheng, Y., Guan, Y., Liu, X., “Estimating the relationship between urban forms and energy consumption: A case study in the Pearl River Delta, 2005–2008,” Landscape and Urban Planning, 102 (2011), 33–42.
17. Kampf, J.H., Montavon, M., Bunyesc, J., Bolliger, R., Robinson, D., “Optimisation of buildings’ solar irradiation availability,” Solar Energy, 84 (2010), 596–603.
18. Kanters, J., Horvat, M., “Solar energy as a design parameter in urban planning,” Energy Procedia, 30 (2012), 1143 – 1152.
19. Mutani G., Vicentini G., “Evaluating the potential of roof-integrated photovoltaic technologies using an open geographic information system,” 8th Energy Forum on Advanced Building Skins (2013), Bressanone (BZ), 87-92.
20. Martins, T.A.L., Adolphe, L., Bastos, L.E.G., “From solar constraints to urban design opportunities: Optimization of built form typologies in a Brazilian tropical city,” Energy and Buildings, 76 (2014), 43–56. DOI: 10.1016/j.enbuild.2014.02.056.
21. Sarralde, J.J., Quinn, D. J., Wiesmann, D., Steemers, K., “Solar energy and urban morphology: Scenarios for increasing the renewable energy potential of neighbourhoods in London,” Renewable Energy, 73 (2015), 10 -17. DOI: 10.1016/j.renene.2014.06.028.
22. Newman, P.W.G., Kenworthy, J.R., “Transport and urban form in thirty-two of the world’s principal cities,” Transport Reviews: A Transnational Transdisciplinary Journal, 11(1991), 249–272.
23. Kennedy, C., Steinberger, J., Gasson, B., Hansen, Y., Hillman,T., Havránek, M., Pataki, D., Phdungsilp, A., Ramaswam, A., Mendez, G.V., “Greenhouse gas emissions from global cities,” Environmental Science & Technology, 43 (2009), 7297–7302.
24. Yin, Y., Mizokami, S., Maruyama, T., “An analysis of the influence of urban form on energy consumption by individual consumption behaviours from a microeconomic view point,” Energy Policy, 61(2013), 909–919
25. Liu, C., Shen, Q., 2011, “An empirical analysis of the influence of urban form on household travel and energy consumption,” Computers, Environment and Urban Systems, 35, 347–357.
26. Ye, H., Yan He, X., Song, Y., Li, X., Zhang, G., Lin, T., Xiao, L., “A sustainable urban form: The challenges of compactness from the viewpoint of energy consumption and carbon emission,” Energy and Buildings, 93 (2015), 90–98
27. Salat S., Nowacki C., “De l’importance de la morphologie dans l’efficience énergétique des villes,” Liaison énergiefrancophonie (2010), 86, 141-146.
28. Touchie, M.F., Binkley, C., Pressnail, K. D., “Correlating energy consumption with multi-unit residential building characteristics in the city of Toronto,” Energy and Buildings, 66 (2013), 648–656. DOI: 10.1016/j.enbuild.2013.07.068.
29. Rode, P., Keim, C., Robazza, G., Viejo, P., Schofield, J., “Cities and energy: urban morphology and residential heat energy demand,” Environment and Planning B: Planning and Design 2014, volume 41, 138–162. DOI: 10.1068/b39065.
30. Nault, E., Peronato, G., Rey, E., Andersen, M., “Review and critical analysis of early-design phase evaluation metrics for the solar potential of neighborhood designs,” Building and Environment, 92 (2015), 679-691. DOI: 10.1016/j.buildenv.2015.05.012.
31. Hermosilla, T., Palomar-Vázquez, J., Balaguer-Beser, Á., Balsa-Barreiro, J., Ruiz, L. A., “Using street based metrics to characterize urban typologies,” Computers, Environment and Urban Systems, 44 (2014), 68–79. DOI: 10.1016/j.compenvurbsys.2013.12.002.
32. Kellett, R., Christen, A., Coops, N. C., Van der Laan, M., Crawford, B., Tooke, T. R., et al. (2013), “A systems approach to carbon cycling and emissions modelling at an urban neighbourhood scale,” Landscape and Urban Planning, 110, 48–58.
33. Wiedenhofer, D., Lenzen, M., Steinberger, J.K., “Energy requirements of consumption: Urban form, climatic and socio-economic factors, rebounds and their policy implications,” Energy Policy, 63 (2013), 696–707. DOI: 10.1016/j.enpol.2013.07.035.
34. Mata, E., Kalagasidis, A.S., Johnsson, F., “Building-stock aggregation through archetype buildings: France, Germany, Spain and the UK,” Building and Environment, 81(2014), 270-282. DOI: 10.1016/j.buildenv.2014.06.013.
35. Corgnati, S.P., Fabrizio, E., Filippi, M., Monetti, V., “Reference buildings for cost optimal analysis: Method of definition and application,” Applied Energy, 102 (2013), 983–993. DOI: 10.1016/j.apenergy.2012.06.001.
36. Holden, E., Norland, I.T., “Three challenges for the compact city as a sustainable urban form: household consumption of energy and transport in eight residential areas in the greater Oslo region,” Urban Stud., 42, (2005), 2145–2166. DOI: 10.1080/00420980500332064.
37. Burger J., Gochfeld M., “Paradigms for ecological risk assessment,” Annals of the New York Academy of Sciences, 837, (1997), 372–386.
38. Gamba, R.J., “Factors influencing community residents’ participation in commingled curbside recycling programs,” Environment and Behaviour, 26, (1994) 587–612.
39. Mesch, G.S., Manor, O., Social Ties, “Environmental perception, and local attachment,” Environment and Behaviour, 30, (1998), 504–519.
40. Mesch, G.S., “The effect of environmental concerns and governmental incentives on organized action in local areas,” Urban Affairs Review, (Thousand Oaks, CA) (1996) 346–366. DOI: 10.1177/107808749603100303.
41. Xu, X., Taylor, J.E., Pisello, A.L., Culligana, P.J., “The impact of place-based affiliation networks on energy conservation: An holistic model that integrates the influence of buildings, residents and the neighbourhood context,” Energy and Buildings, 55, (2012), 637–646. DOI: 10.1016/j.enbuild.2012.09.013.
42. Mutani, G., Vicentini, G., “Buildings’ energy consumption, energy savings and the availability of renewable energy sources in urban contexts: the potential of GIS tools,” Journal of Civil Engineering and Architecture Research, Volume 2, Number 11 (2015), ISSN: 2333-9128.
43. Delmastro, C., Mutani, G., Schranz, L., Vicentini, G., “Building Energy Assessment and Urban Form,” 7th AIGE Conference (2015), Catania (Italy), 1-6.
44. Fabi, V., Andersen, R.V., Corgnati S.P., Olesen, B.W., “Occupants’ window opening behaviour: a literature review of factors influencing occupant behaviour and models”, Building and Environment, 58 (2012), 188-198.
45. Steinbach J., Literature review of “integrating user and investment behaviour in bottom-up simulation models,” Entranze Project, Available at: http://www.entranze.eu/pub/pub-policies, accessed: March 2015.
46. Hong T., Lin, H.W., “Occupant behaviour: impact on energy use of private offices,” eds., ASim 2012 - 1st Asia Cconference of International Building Performance Simulation Association, Shanghai (2012).
47. Bordass, W., Cohen, R., Field, J., “Energy performance of non-domestic buildings: closing the credibility gap,” eds. Building Performance Congress, Frankfurt, (2004).
48. Masoso, O.T., Grobler, L.J., “The dark side of occupants’ behaviour on building energy use,” Energy and Buildings, 42, (2010), 173-17.