OPEN ACCESS
Thermo-hygrometric indoor conditions, as well known in literature, depend on the indices directly measurable in the place (Tba, Tbu, φa, va) and analytical solutions (Tmr, Top) and also on subjective assessments, metabolic activity carried out, and thermal resistance of clothing. They are tied to the subject occupied position within the work environment, substantially. In air conditioned rooms designed by systems with average parameters, it may happen that an individual, in some places or times, may feel sensations of thermal discomfort.These phenomena can be exacerbated by heat exchanges occurring in the presence of sources of radiation, such as radiant floors or ceilings or large glass surfaces sunny; these surfaces accentuate the radiative heat exchange with the body surfaces of the exposed individual. This paper proposes a "local mean radiant temperature" valid for the regular calculation of comfort in environments characterized by the presence of radiating surfaces. The present study compares the values of the parameters representing the hygrothermal comfort punctual, PMV, in environments characterized by radiating surfaces located in specific positions (ceiling, floor or walls), calculated with the local radiant temperature suggested in this study, with the corresponding values obtained with the mean radiant temperature proposed by the literature.
Thermo-hygrometric comfort, radiative exchanges, ISO7726 and ISO7730 standards, Tmr, PMV, PPD.
As witnessed by all the architectural traditions of the world, from the past to the present, man has always tried to create a comfortable thermal environment; today create a comfortable environment in terms of heat, is one of the most important objectives to be achieved in buildings’ design.
Thermo-hygrometric well-being condition, can be defined, from the psychological point of view, as the psychophysical state in which the subject expresses satisfaction with the thermal environment, or, from the thermo-sensory viewpoint, such as the condition in which the subject does not feel neither cold nor hot- a sort of neutral thermo-hygrometric condition-may influencing work efficiency.
As previous work on living and working indoor environments comfort [1,18] have shown, the literature does not always provide general equations valid for all possible situations. Sometimes these equations involve special cases which did not occur and therefore the values obtained are hardly suitable to real situations.
In particular, tables proposed by Fanger [1] suitable for the evaluation of the Predicted Mean Vote (suggested by the regulations for microclimatic comfort indoor evaluation) are set on the equality between the air temperature Ta, mean radiant temperature Tmr, and the operating temperature Top. These conditions do not always occur and therefore the values provided by the tables did not result verified; this drawback is overcome if you use the calculation program of PMV provided by ISO 7726 and ISO 7730 [10, 16].
In addition to the parameters related to the subject: metabolic activity (M) and thermal resistance of clothing Icl, this program requires the knowledge of the four environmental parameters: air temperature Ta, wind speed va, mean radiant temperature Tmr and relative humidity φa.
In order to assess of radiative trade effects on thermal comfort within a work environment, four case studies were taken into account.
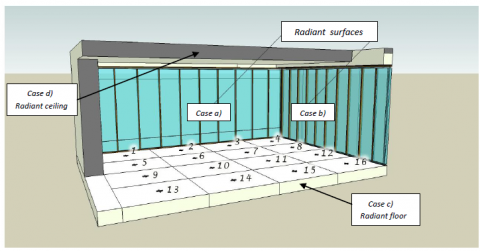
Figure 1. Open space work environment - points i = 1, ... 16 examined in this work, in the four case
The present work has considered an open-space work environment –Figure 1- characterized by the presence of a continuous glass wall located on the environment external side facing west “case a”, or on the wall facing south “case b” -during the summer period- and radiant ceiling “case c” or radiant floor “case “d” - during winter-.
The mean radiant temperature is one of the six main variables responsible for the thermal sensation.
Its measurement is not direct and it is usually carried out following different methodologies or through the use of tools whose accuracy requirements are shown in ISO 7726.
The mean radiant temperature expresses the radiative thermal exchanges between human body surface and the environment inner surfaces; it is defined as the temperature of a hollow black sphere surrounding the subject and exchanging with it the same thermal power exchanged by this last to the real environment.
Living and working environments thermal comfort conditions can be strongly influenced by the presence of potential radiation sources and by their relative position to the occupants.
Particularly an entity located in close proximity of a radiating surface (such as a sunny glass surface or a ceiling or radiant floor) is noticeably affected by the heat flow irradiated.
Assuming that environment surfaces can be considered as blacks bodies with emission coefficient close to one, the mean radiant temperature Tmr value can be calculated with the following formula:
$\mathrm{T}^{4}_{\mathrm{mr}}=\sum_{\mathrm{j}=1}^{6} \mathbf{S}_{\mathrm{j}} \cdot \mathbf{T}_{\mathbf{j}}^{4} / \sum_{\mathrm{j}=1}^{6} \mathbf{S}_{\mathbf{j}}$ (1)
Thermal comfort conditions in living and working environments can be strongly influenced by the presence of potential sources of radiation and from their position in relation to the occupants. In particular a subject located in close proximity of a radiating surface, such as a sunny glass surface or a ceiling or radiant floor, is noticeably affected by the heat flow irradiated.
The value of the mean radiant temperature Tmr can be calculated with the following formula (2), assuming that the environment surfaces can be considered as black bodies with emission coefficient next to one:
$\mathrm{T}_{\mathrm{mr}}^{4}=\sum_{\mathrm{j}=1}^{6} \mathrm{F}_{\mathrm{i}, \mathrm{j}} \cdot \mathrm{T}_{\mathrm{j}}^{4}$ (2)
Table 1. Values of the coefficients Fmax, A, B, C, D, E–EN-ISO 7726 for various configurations
|
|
F max |
A |
B |
C |
D |
E |
|
Sitting person, Fig 2/a Vertical Surf.: wall window |
0,118 |
1,216 |
0,169 |
0,717 |
0,084 |
0,052 |
|
Sitting person, Fig 2/b Horizontal Surf.: floor ceiling |
0,116 |
1,396 |
0,130 |
0,951 |
0,080 |
0,055 |
|
Standing person, Fig 2/c Vertical Surf.: wall window |
0,120 |
1,242 |
0,167 |
0,616 |
0,082 |
0,051 |
|
Standing person, Fig 2/d Horizontal Surf.: floor ceiling |
0,116 |
1,595 |
0,128 |
1,226 |
0,046 |
0,044 |
Table 2. Factor of projected area of the subject compared to the surfaces, dimensionless
|
PERSON’S POSITION |
front. back x |
right. left y |
ceiling. floor z |
|
standing |
0,35 |
0,23 |
0,08 |
|
sitting |
0,30 |
0,23 |
0,18 |
Implicitly the formula (2) takes into account the distance between the subjects located within the environment and the radiating surface, through the configuration factors Fi, j.
These factors Fi,j, for subjects sitting or standing can be calculated with the graphs proposed by Fanger in his study on indoor comfort [1], or with the equation 3) proposed by the author [8, 9] and adopted by ISO7726, [16].
Wiew factors (EN ISO 7726):
Fi,j = Fmax (1- e-(a/c)/τ) (1- e-(b/c)γ) (3)
τ = A + B · a/c
γ = C + D · b/c + E · a/c
The coefficients for calculating the projected area factor reported in Table 2 -valid for seated subjects or standing [14], [15]- have been suggested in order to take account of the
distance between the subject and the radiant surface, in the calculation of mean radiant temperature.
It is fairly well known that comfort conditions within an environment depend on the fundamental thermo hygrometric parameters’ values assume point by point. Several time, when these parameters are used in the average values, misinterpretations of the local thermal situations can occur.
On the basis of experiences in the field of air conditioning and in the occasion of a recent work on thermal comfort in open-space environments with considerable radiant surfaces [19], the radiant temperature at any environment point takes on different values in relation to the distance of the point itself from the radiating surface, despite taking into account the view factors depending on the position. Consequently, the average values -used in the calculation programs- generate PMV values quite different from the average one calculated for the whole environment.
To solve this problem, this work proposes an original formula for the calculation of the local mean radiant temperature, Tmrl. The proposed following formula 4) useful for the calculation of Tmrl, takes into account the influence of radiating surfaces, Sj, and the distance, di, between the subject and the radiating surfaces in a more explicit way, while considering the factors of view and projected area.
$\mathrm{T}^{4}_{\mathrm{mrl}}=\sum_{\mathrm{j}=1}^{6} \mathrm{F}_{\mathrm{i}, \mathrm{j}} / \mathrm{f}_{\mathrm{api}} \cdot \mathrm{S}_{\mathrm{j}} / \mathrm{d}_{\mathrm{i}} \cdot \mathrm{T}_{\mathrm{j}}^{4} / \sum_{\mathrm{j}=1}^{6} \mathrm{F}_{\mathrm{i}, \mathrm{j}} / \mathrm{f}_{\mathrm{api}} \cdot \mathrm{S}_{\mathrm{j}} / \mathrm{d}_{\mathrm{i}}$ (4)
This formula will allow an evaluation of the comfort through PMV values of the work environment point by point.
With the local mean radiant temperatures computed with the proposal formula (4) the values PMV comfort parameters have been then calculated.
The formula (4) uses the values of the view factors Fi,j calculated with the (3).
At each point of the environment considered, the mean radiant temperatures Tmr were calculated; then the values of PMV thereof derived for subjects located in the same places with the same metabolic activity and heat resistance of clothes.
The study was conducted by considering the following four cases, two (case “a" and the case “b"), representative of the summer season, and two (case "c" and the case "d") during winter:
Case a) Wall 1 consisting of a continuous window facing west, while the other 3 walls delimiting the environment do not have windows;
Case b) Wall 2 consisting of a continuous glass exposed to the south, while the other 3 walls delimiting the environment do not have windows;
Case c) Working environment ceiling consisting of a radiant ceiling;
Case d) Working environment floor consisting of a radiant floor.
The four cases investigated suggest an open-space environment, ventilated with air speed va=0.15 m/sec, occupied by individuals in standing position performing activities of Met 1, with a clothing thermal resistance amounting to 0.75 clo for the summer season (cases “a” and “b”), and a thermal resistance of 1.0 clo in cases “c” and “d”, during winter one.
In the summer cases a) and b) the evaluations have been carried out assuming for the glass walls absorption coefficients values a=0.6, and for the solar radiation incident on the glass surface values: I = 400, 500, and 600 W/m2, typical of the summer period in the Italian resort.
The mean radiant temperature values and local PMV’s ones were calculated for each point of open-space environment.
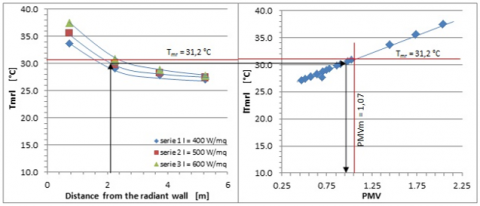
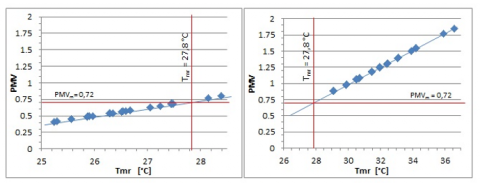
Figures 3/a and 3/b, representative of case "a", respectively, show the local mean radiant temperature trends in function of the points’ distance from the considered radiant wall and the trend of PMV, depending on the local mean radiant temperatures’ values.
Figure 3/a e 3/b. Values of Tmr, PMV and distance from radiant wall - Case “a” a = 0,6 and I = 400, 500 e 600 W/m2
It may be noted that the two graphs can be read in two ways:
1) Fixing the distance of the point from the radiant wall,
you can determine the corresponding mean radiant temperature temperatures’ values.
It may be noted that the two graphs can be read in two ways: from graph of Fig. 3/a; from this value you can derive the value of the PMV through the graph of Fig. 3/b;
2) Selecting a predetermined value of PMV in the graph of Figure 3/b, you can trace from this the corresponding mean radiant temperature, and then, through the graph of Fig. 3/a, in correspondence of that value you can trace to the corresponding points of environment through the distance read.
The two graphs of Figure 3/a and Fig. 3/b show the values of the local mean radiant temperature Tmrl, calculated with the (4) and the corresponding value of PMVm associated with it, in the center of the environment examined, calculated with the Tmr obtained with (2).
The graph in Figure 3/b shows that for points at a distance greater than 2 meters from the glass wall, local mean radiant
temperatures (Tmrl) are lower than of Tmr and then, in these points, PMV values are different from the average value PMVm calculated with Tmr.
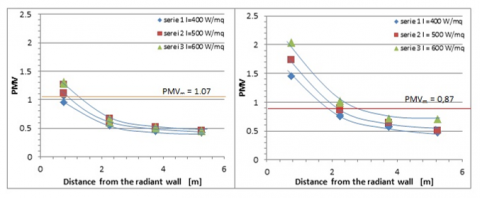
The Fig. 4/a and Fig. 4/b, respectively for the cases a) and b), show the values of local PMV, calculated for each of the points of the open-space environment considered.
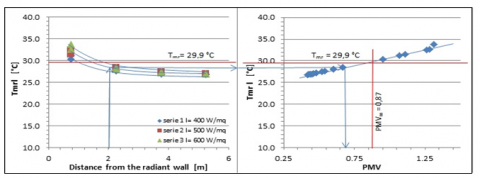
The two graphs of Fig.5/a and Fig. 5/b, report for the case b) respectively, the local mean radiant temperatures values (Tmrl) in function of the distance, and the corresponding values of PMVm associated with them.
In the graph of Fig. 5/b you can observe that even for points having distance greater than 2m, local mean radiant temperatures Tmrl are lower, and therefore in those points, PMV values results quite different from the average value PMVm calculated using the Tmr.
The Fig. 6/a and Fig. 6/b for the case "c" and "d", show respectively the values of the PMV, and their mean temperatures for each local radiant point of the open-space. Instead, the two graphs of Fig. 6/a and Fig. 6/b show respectively, for the cases "c" and "d" values of PMVm and mean radiant temperatures.
From both graphs it can be observed that all the representative points of the cases examined for the winter period (case "c" and the case "d") show local PMV values exceeding the PMVm value calculated using the mean radiant temperature Tmr.
Figure 4/a, case “a”, e Figure 4/b, case “b”. PMV function of the distance a = 0,6 and I = 400, 500 e 600 W/m2
Figure 5/a and 5/b. Tmrl, PMV values and distance from radiant wall – Case “b” b = 0,6 and I = 400, 500 e 600 W/m2
Figure 6/a, Case “c” and Figure. 6/b, case “d”. PMV Values in function of Tmr, for wall temperature Ti =24°C, and temperatures of radiant ceiling and floor ranging from 55 and 60°C
The values reported in the following table for the summer cases ("a" and "b") are related to the values of I= 500 W/m2 while for those in winter (cases "c" and "d"), the data are referred to the values of temperature Tmr = 55 ° C.
Table 3. Comparison between PMV values calculated with Tmrl and related PMVm values calculated with Tmr and their difference
|
Points i |
1 and 4 |
2 and 3 |
5 and 8 |
6 and 7 |
9 and 12 |
10 and 11 |
13 and 16 |
14 and 15 |
|
PMV case a) PMVm Diff. |
1,73 1,07 0,66 |
1,74 1,07 0,67 |
0,86 1,07 -0,21 |
0,90 1,07 -0,17 |
0,64 1,07 -0,43 |
0,64 1,07 -0,43 |
0,51 1,07 -0,56 |
0,51 1,07 -0,56 |
|
PMV case c) PMVm Diff. |
0,49 0,72 -0,23 |
0,58 0,72 -0.14 |
0,54 0,72 -0,18 |
0,68 0,72 -0,04 |
0,54 0,72 -0,18 |
0,65 0,72 -0,07 |
0,50 0,72 -0,22 |
0,57 0,72 -0,15 |
|
PMV case d) PMVm Diff. |
1,06 0,72 0,34 |
1,03 0,72 0,31 |
1.19 0,72 0,47 |
1,30 0,72 0,58 |
1,18 0,72 0,46 |
1,50 0,72 0,78 |
1,06 0,72 0,34 |
1,31 0,72 0,59 |
|
Points i |
4-16 |
8-12 |
3-15 |
7-11 |
2-14 |
6-10 |
1-13 |
5-9 |
|
PMV case b) PMVm Diff. |
1,11 0,87 0,24 |
1,26 0,87 0,39 |
0,60 0,87 -0,27 |
0,67 0,87 -0,20 |
0,48 0,87 -0,39 |
0,52 0,87 -0,35 |
0,46 0,87 -0,41 |
0,43 0,87 -0,44 |
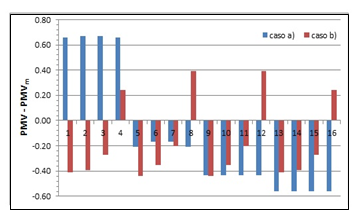
The Fig. 7/a for the cases "a" and b" shows -for the points of the considered environment- the differences between the PMV values and those of PMVm calculated with the formula (5).
Figure 7/a. Case “a” and “b” Difference between PMV and PMVm values W/m2
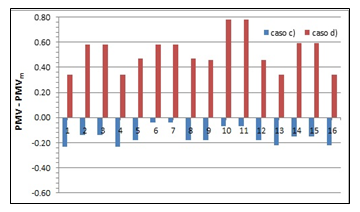
Figure 7/b. Case “c” and “d”- Difference between PMV and PMVm values
Table 3 shows the comparison between the two values of PMV and PMVm and their difference:
Difference = PMV – PMVm (5)
The values reported in the following table for the summer cases ("a" and "b") are related to the values of I = 500 W/m2 while for those in winter (cases "c" and "d"), the data are referred to the values of temperature Tmr = 55 ° C.
The Fig.7/b contains the differences of the PMV related to cases named c) and d).
The graph of Fig.7/a expresses that the PMV values are greater than the PMVm ones for both cases "a" and "b", for all points next to the radiating surface (1, 2, 3, 4 for the case "a" and 4,8,12,16 for the case "b"), while for other points belonging to the working environment this difference is negative.
This behavior confirms the findings throughout the present study and reported in the following paragraph and images of Fig. 8 (in appendix A).
Regarding cases "c" and "d", the Fig. 7/b shows that for all points the difference between the values of the PMV and the PMVm is negative for the case "c" -radiant ceiling- and positive for case "d" -radiant floor-.
This behavior can be explained for the shorter distance between the subject and the radiant floor in comparison with the one between the same subject and the radiant ceiling.
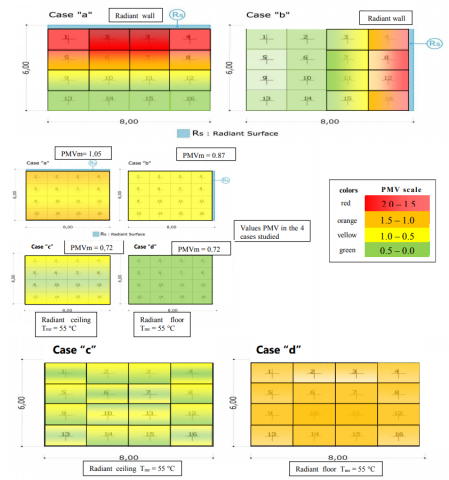
Figure 8. Colored representation of the PMV values in the 4 case studies
What is already well known in literature is supported by the results of the study: the comfort conditions depend on the parameters of the precise place where they are evaluated; therefore evaluations using average values, certainly do not represent the real thermal conditions of point.
Fig. 8, better than others, shows how a subject near the radiating surfaces - despite taking into account the view factors between the subject and the radiating surfaces- is affected by radiative exchanges between these and the surface of its body. Increasing the distance between the two surfaces, radiative exchanges decrease.
This phenomen is more marked in case a) and b) where the distance between the surface are variable, while in cases c) e d) this phenomenon is less evident because the distance between the subject and radiatiating surface remains constant, for each point of the environment studied.
By introducing the formula (4) proposed in this study, local comfort conditions can be assessed more accurately.
Once acquired data, engineering systems and domotics control can act with small adjustments on both the flow and the speed of the single air nozzle, achieving optimal local conditions’ comfort for the subject in that position.
That’s what already happens in cars with adjustment for area. All this contributes also to energy savings considering that, taking in consideration only the average values, actual conditioning implants are over dimensioned.
|
Ta |
Air temperature, °C |
|
va |
Air speed, m/s |
|
φa |
Air relative humidity, dimensionless |
|
Top |
Operating temperature, ° C |
|
Tmr |
Mean radiant temperature, °C |
|
Tmrl |
Local mean radiant temperature, ° C |
|
Tj |
Temperature of the j-th wall, ° C |
|
Sj |
j-th wall surface, m2 |
|
Fi,j |
Factor of view of a j-th subject set at the i-th location of the environment, dimensionless |
|
fapi |
Factor of projected area of the subject compared to the surfaces, dimensionless |
|
di |
distance of the point of the environment, compared to the i-th wall, m |
|
PMV |
Predicted Mean Vote, dimensionless |
|
PMVm |
Average Predicted Mean Vote, dimensionless |
|
Iclo |
Clothing thermal resistance, clo |
|
Met |
Metabolic activity, Met |
|
a |
Glass walls absorption coefficient, dimensionless |
|
I |
Solar radiation incident on the glass surface, W/m2 |
1. Fanger P.O., (1972): “Thermal Comfort”, McGraw-Hill, New York, 1972, cap. 5-6.
2. Siegel R., Howell (1972): “Thermal Radiation Heat Transfer”, McGraw-Hill, New York, 1972.
3. Olesen B.W., (1985): “Local Thermal Discomfort”, Bruel & Kjaer Technical Review, 1, 1985.
4. Bonavita F., Brunello P., Zecchin R., (1989): “Metodo di calcolo dei fattori di forma tra corpo umano e superfici interene di un ambiente”, Condizionamento dell’aria, 2, 1989, p.217.
5. Olesen B.W., Rosendahl J., Kalisperis I.N., Steinman M., Summers L.H., (1989): “Method for Measuring and Evaluating the Thermal Radiation in a room”, ASHRAE Tran.95 (1), 1989, p.1028.
6. Kalisperis I.N., Steinman M., Summers L.H., (1991): “Angle Factor graphs for a person to inclinated surfaces”, ASHRAE Tran.97 (2) 1991, p.809.
7. Kalisperis I.N., Steinman M., Summers L.H., (1991):“Expanded research on human shape factors for inclinated surfaces”, Energy and Buildings, 17, 1991, p.283.
8. Cannistraro G., Franzitta G., Rizzo G., (1991): “Algorithms for the calculation of the mean projected area factors of seated and standing persons”, Energy and Buildings, 17, 1991, p.221.
9. Cannistraro G., Franzitta G., Giaconia C., Rizzo G., (1992): “Algorithms for the calculation of the view factors between human body and rectangular surfaces in parallelepiped environments”, Energy and Buildings, 19, 1992, p.51.
10. ISO 7730 (1993) “Moderate thermal environments- determination of the PMV and PPD indices and specification of the conditions for thermal comfort”, Geneva, International Standards Organization, 1993.
11. Johnson G.T., (1994): Comment on “Algorithms for the calculation of the view factors between human body and rectangular surfaces in parallelepiped environments”, Energy and Buildings, 21, 1994, p.79.
12. G.Alfano, G. Cannistraro, F.R.D'Ambrosio, G.Rizzo: “Evaluation of Indoor Thermal Comfort Conditions: Architects facing International Standards” Proceedings 3rd International Conference, HEALTHY BUILDINGS '94, Budapest, Hungary 22-25 August, 1994.
13. G.Alfano, G. Cannistraro, F.R.D'Ambrosio, G.Rizzo: “Notes on the Use of the Tables of Standard ISO-7730 for the Evaluation of the PMV index”. INDOOR BUILT ENVINRONMENT - Karger - pagg.355-357, n°5, 1996.
14. Corrado V., Pretti M., Sacchi A., “Routine for the calculation of angle factors between human body and
car driver’s cabin”, 3rd International Conference on Vehicle Confort and Ergonomics, Bologna, marzo 1995.
15. Corrado V., Astolfi A., (1997): Sul calcolo puntuale della temperatura media radiante in ambienti di forma irregolare”, 52 Congresso nazionale A.T.I., Cernobbio, Como.
16. ISO (1998). ISO Standard 7726. Ergonomics of the thermal environment - Instruments for measuring physical quantities. International Organization for Standardization, Geneva.
17. Olesen B.W., Parsons K.C., (2002). “Introduction to thermal comfort standards and to the proposed new version of EN ISO 7730”. Energy and Buildings, 34, 537-548.
18. F. R. d’Ambrosio Alfano, B. W. Olesen, B. I. Palella, G. Riccio; “Thermal comfort: Design and assessment for energy saving”. Energy and Buildings 81 (2014) 326–336.
19. G. Cannistraro, M. Cannistraro, R.Restivo, “Some Observations on the Radiative Exchanges Influence on Thermal Confort in Rectangular Open-Space Environments”, In press on International Journal “Heat & Technology, 2014.