Maali SH. Mahmood*![]() | Isam Issa Omran | Maher A. A. Kadim
| Isam Issa Omran | Maher A. A. Kadim
© 2025 The authors. This article is published by IIETA and is licensed under the CC BY 4.0 license (http://creativecommons.org/licenses/by/4.0/).
OPEN ACCESS
The study examined how sanitary landfill waste and its leachate affected groundwater quality in the Kirkuk Governorate, Iraq. Seven sites were selected to monitor groundwater contamination from the landfill cell to the nearest residential area to calculate their samples' leachate pollution and water quality indices. Physical, chemical, and biological parameters were measured for such environmental indicators. Groundwater maps have been predicted using GIS techniques. The nine-month test period ran from February to November 2024. The results demonstrated that leachate concentrations affect groundwater properties. The amounts of Chemical Oxygen Demand (COD), Biochemical oxygen demand (BOD), SO4-2, PO4-3, NH3+, and phenol were greater than permitted by WHO recommendations. Only the vicinity of the landfill cell showed the effects of heavy metals like Cr and Ni, while the residential areas remained unaffected. The LPI results for leachate samples ranged from 25.43 to 40.52. Also, the WQI of the test sites (GW1, GW2, GW3, and GW4) revealed that they were unsuitable for human use without treatment, whereas the groundwater at the other sites (GW5, GW6, and GW7) was adequate for limited irrigation. The findings of the correlation study indicated that the majority of the parameters had a substantial association with one another. The strong negative correlation between distance and parameters indicates that pollutant concentrations decrease when the distance from the landfill increases. The research recommends adopting scientific and technological means to mitigate pollution by using special pipe networks to prevent leachate leakage from the landfill cells and using modern techniques to treat leachate before it reaches the groundwater.
index of leachate pollution (LPI), index of water quality (WQI), GIS ArcMap, special analysis IDW, correlation matrix analysis
In dry and semi-arid regions with limited surface water, groundwater is essential for meeting the water needs of several developing nations' residential, industrial, and agricultural purposes. This priceless resource is increasingly threatened due to anthropogenic activities above ground, such as uncontrolled development, continuing waste dumping, and inadequate land use management. Moreover, the chemical composition of groundwater dictates its use for people; therefore, evaluating it is essential for the social and economic development of both developed and emerging nations [1-3].
Urban trash collection and disposal is a critical challenge in municipal waste integrated management because of the rise in rubbish production per capita brought on by population growth and industrialization [4]. The predominant and most credible approach to managing municipal solid waste dumpsites (MSW) is burial in engineered landfills [5]. Landfills provide a short-term fix, but because they discharge pollutants, leachate, and landfill gas that damage the ecosystem, climate, water supplies, land, and human health, they seriously threaten the economy, society, and environment. Many contaminants in the environment are caused by MSW [6, 7].
Poorly collected, handled, and disposed of landfill leachate may seep into the soil and contaminate water aquifers, which in turn can pollute surface and groundwater sources [8, 9]. Leachate is a contaminated liquid that rises from solid waste landfills' ground level and contains suspended particles, organic and inorganic compounds, and other materials [9] and [10]. According to Rajoo et al. [11], the Leachate Pollution Index (LPI) standard value is 7.378, and its harmful environmental impact is highlighted when it is above that. During the wet season, leachate discharge may rise; during the dry/summer season, it can decrease [12]. Groundwater isn't the only thing landfills harm; they also harm the air and the soil [13]. Leachate seeps through soil particles and eventually reaches groundwater, contaminating it [3].
Hepatitis and dysentery are among the illnesses that can result from pollutants contaminating groundwater sources [14, 15]. Using a Groundwater Modelling System (GMS), the researcher [16] demonstrated that the concentrations of contaminants in the groundwater of the Karbala governorate rose over time and did not move in all directions at the same pace. According to the study [17], groundwater samples have BOD, COD, SO₄-², PO₄-3, and NO₃⁻ values that are higher than WHO specifications. The other study [18] indicated that the groundwater next to the landfill site had higher than allowed levels of physiochemical characteristics. One could suggest that groundwater pollution is virtually nonexistent due to the restricted percolation of leachate via soil throughout the summer [19].
The study aimed to test the leachate samples from the landfill site and groundwater samples extending between the landfill cell and the nearest residential area regarding physical, chemical, and biological properties and heavy metal content. Additionally, it seeks to ascertain the Water Quality Index (WQI) for groundwater samples and the LPI for leachate samples to examine leachate leakage's effect on the quality of groundwater and appropriateness for human use. Kirkuk sanitary landfill, which is newly constructed (started operation in 2008), was selected for this study. It accommodates more than 1000 tons of waste per day and extends over an area estimated at 192,915 square meters.
The Kirkuk Governorate is 90 km southeast of Erbil and 240 km north of Baghdad in northeastern Iraq. The Iraqi Planning Ministry estimates a population of around 1,726,409 and a total area of 9,679 square km as of 2021. Figure 1 illustrates the geographical position of the Kirkuk Governorate in Iraq. The region has a semi-arid climate characterized by scorching summers and moderate, humid winters, with an average annual precipitation of 250-320 mm. The sanitary landfill has a single cell of 300 by 600 m² with an average depth of 4 m, a main treatment basin for leachate, and a capacity to manage around 1000 tons of garbage daily. It is roughly 18 km south of Kirkuk City's southern and 3 km east of Tazakhurmato City. The site's operating design stipulates a ten-year lifespan for the landfill. Since its inception in 2008, the landfill is now using resources beyond the specified capacity. The site was selected to demonstrate its impact on water quality within the landfill and surrounding areas after it had exceeded its operational age. Therefore. The Universal Transverse Mercator (UTM) coordinate system provides the following coordinates for the landfill site: longitude (44°22'20.4"E) and latitude (35°18'16.9"N) 38 S.
Figure 1. Locations of Kirkuk governorate and the study area
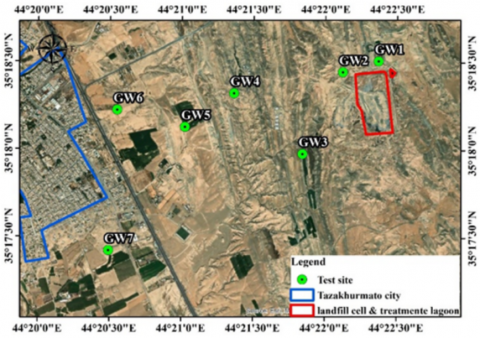
Seven locations were selected to monitor groundwater pollutant concentrations in the landfill and its surroundings. The locations distribution was based on the distance between the landfill site and the residential area, as well as the locations of the wells in the area, as indicated in Figure 2. The locations of the leachate samples were distributed as follow: four samples from the edges of the cell and two samples from the center. The purpose was to adequately express the characteristics of the leachate in situ. Groundwater and Leachate Samples were collected in a 2.0L pre-cleaned polyethylene container, maintained at 4°C in the incubator, and analyzed according to American Public Health Association (APHA) Standard Methods (23rd Edition). Various analytical techniques were used for the examination of physicochemical, microbiological, and heavy metal parameters. Parameters such as electrical conductivity (EC), pH, and total dissolved solids (TDS) content were measured during the sample using the HI1285-51 electrode. The Chemical Oxygen Demand (COD) was measured using the HI839150 COD Reactor and the HI83399-01 Water and wastewater Multiparameter Photometer. Biochemical oxygen demand (BOD) was carried out using the VELP BOD EVO Sensor. Calcium (Ca2+), potassium (K+), phosphate (PO42−), sulfate (SO42−), and ammonia nitrogen (NH3+-N) were quantified using a UV–visible spectrophotometer (Shimadzu 1800) technique. The microbiological parameter was assessed using the most probable number (MPN) approach facilitated by laminar flow (Microfilt). Heavy metals such as lead (Pb), chromium (Cr), copper (Cu), nickel (Ni), and iron (Fe) were quantified using an atomic absorption spectrophotometer (novAA 800 atomic absorption spectrometer). Garmin GPS 72TM is used to determine the coordinates of sampling sites. The solid waste Leachate pollution index (LPI) was determined at the sanitary landfill site using standard formulas and figures mentioned in previous studies [20, 21].
Figure 2. Locations of landfill and testing sites
The WQI was calculated by using (Weighted Arithmetic Water Quality Index Method), by using the Eq. (1) [22-24]:
$W Q I=\frac{\sum W n Q n}{\sum W n}$ (1)
where, Qn = quality rating of the nth water quality parameter, Wn = unit weight of the nth water quality parameter. Qn determined by Eq. (2):
$Q n=[(V n-V i d) /(S n-V i d)]* 100$ (2)
where, Vn = estimated value of the nth water quality parameter's value at a certain sample location, Vid = the ideal value for the nth parameter in pure water (Vid for pH is 7 and 0 for all other parameters), Sn = Standard allowable value of the nth water quality parameter. The unit weight (Wn) is determined using Eq. (3):
$W n=K / S n$ (3)
$K=[1 / \Sigma(1 / S n=1,2,3 \ldots . n)]$ (4)
Eq. (4) determines (K), the constant of proportionality. Table 1 shows the classification of groundwater according to the possible usages by calculating the WQI values.
Table 1. WQI classification values
|
WQI Value |
Status |
Possible Usages |
|
0-25 |
Excellent |
For drinking, irrigation, and industrial uses |
|
26-50 |
Good |
For drinking, irrigation, and industrial uses |
|
51-75 |
Fair |
For irrigation and industrial uses |
|
76-100 |
Poor |
For irrigation uses |
|
101-150 |
Very Poor |
For restricted uses of irrigation |
|
Above 150 |
Unfit for Drinking |
Treatment required before any uses |
Additionally, Geographic Information System (GIS) ArcMap, 10.8.2, was used to predict groundwater quality maps, and the results were analyzed with a special analysis tool called Inverse Distance Weighting Interpolation (IDW). To examine the complex interrelationships among many physicochemical factors, factor analysis of trace metals and Pearson's correlation were conducted using Microsoft Excel. Correlation analysis is an initial descriptive technique for assessing the extent of correlation between the variables concerned. The purpose of correlation analysis is to quantify the strength of the relationship between two variables.
In this study, two leachate samples were tested from the center of the sanitary landfill cell; their overall average was calculated and represented by sample 1, and four leachate samples at the sides of the cell were tested; their overall average was also calculated and represented by the sample 2. Table 2 presents the concentrations of the main pollutants in the untreated landfill leachate. Heavy metal analyses indicate the presence of Cu, Cr, Ni, and Pb in the leachate samples. The concentration of heavy metals was ranked as follows: Cu > Ni > Pb > Cr, from highest to lowest concentration. The detection of these metals signifies the dumping of various waste materials at the site, including steel scrap, lead batteries, lead-based paints, plastics, and pipes. LPI values exceeded the permissible limit (7.378) due to high concentrations of COD, BOD, phenol, ammonia, and heavy metals. The results of the laboratory analysis of the groundwater at the test sites represent the average numerical value of five readings for any testing location during the examination period (GW1, GW2, GW3, GW4, GW5, GW6, and GW7), which are shown in Table 3.
Table 2. Values of LPI analysis
|
Parameter |
Sample 1 |
Sample 2 |
Pi 1* |
Pi 2* |
Wi** |
Pi*Wi1 |
Pi*Wi2 |
|
PH |
7.6 |
8.3 |
5 |
5 |
0.055 |
0.275 |
0.275 |
|
Cr, (mg/l) |
0.433 |
0.618 |
4 |
5 |
0.064 |
0.256 |
0.32 |
|
Fe, (mg/l) |
7.713 |
3.685 |
5 |
5 |
0.045 |
0.225 |
0.225 |
|
Cu, (mg/l) |
10 |
5.4 |
100 |
50 |
0.05 |
5 |
2.5 |
|
Pb, (mg/l) |
0.436 |
0.2583 |
5 |
4 |
0.064 |
0.32 |
0.256 |
|
Ni, (mg/l) |
1.376 |
1.209 |
8 |
8 |
0.052 |
0.416 |
0.416 |
|
NH3+-N, (mg/l) |
1116 |
0.93 |
100 |
5 |
0.051 |
5.1 |
0.255 |
|
BOD, (mg/l) |
13020 |
7920 |
70 |
60 |
0.061 |
4.27 |
3.66 |
|
COD, (mg/l) |
31000 |
22010 |
85 |
80 |
0.062 |
5.27 |
4.96 |
|
Phenol, (mg/l) |
28.9 |
17.4 |
35 |
25 |
0.057 |
1.995 |
1.425 |
|
Coliform, (cfu/ml) |
19.3 |
14.5 |
33 |
25 |
0.052 |
1.716 |
1.3 |
|
Total |
|
0.613 |
24.843 |
15.592 |
|||
|
LPI 1 |
40.52692 |
* Pi: (represent the subindex score) from LPI curves & **Wi: (represent the weight for the ith of pollutants variable) from LPI weight tables according to the [20, 21]. $L P I=\sum_{i=1}^m W i P i / \sum_{i=1}^m W i$ (5) |
|||||
|
LPI 2 |
25.43556 |
||||||
Table 3. Values of the leachate contaminants in the groundwater of the testing sites
|
Parameters |
Allowable Limits |
GW1 |
GW2 |
GW3 |
GW4 |
GW5 |
GW6 |
GW7 |
Mean |
S.D |
|
pH |
6.5-8.5 |
8.06 |
8.17 |
7.96 |
7.65 |
7.72 |
7.72 |
7.76 |
7.863 |
0.200 |
|
TDS, (mg/l) |
1000 |
1745 |
1833 |
1628 |
1633 |
1621 |
1517 |
1512 |
1641.2 |
115.7 |
|
EC, (μS/cm) |
400 |
2816 |
2789 |
2543 |
2487 |
2483 |
2368 |
2361 |
2549.5 |
184.9 |
|
COD, (mg/l) |
10 |
117 |
97 |
88 |
67 |
53 |
50 |
44 |
73.714 |
27.50 |
|
BOD, (mg/l) |
5 |
54 |
49 |
40 |
31 |
24 |
24 |
21 |
34.714 |
13.13 |
|
Cr, (mg/l) |
0.05 |
0.092 |
0.076 |
0.061 |
0.058 |
0.044 |
0.025 |
0.016 |
0.053 |
0.027 |
|
Cu, (mg/l) |
2 |
0.921 |
0.740 |
0.436 |
0.275 |
0.129 |
0.079 |
0.047 |
0.375 |
0.342 |
|
Ni, (mg/l) |
0.07 |
0.083 |
0.075 |
0.069 |
0.042 |
0.027 |
0.019 |
0.011 |
0.047 |
0.029 |
|
Pb, (mg/l) |
0.01 |
0.009 |
0.005 |
0.002 |
0 |
0 |
0 |
0 |
0.002 |
0.003 |
|
Fe, (mg/l) |
0.3 |
0.673 |
0.584 |
0.519 |
0.466 |
0.338 |
0.267 |
0.173 |
0.431 |
0.179 |
|
CL-, (mg/l) |
250 |
424 |
417 |
371 |
319 |
283 |
244 |
197 |
322.14 |
86.66 |
|
SO4-2, (mg/l) |
250 |
681 |
677 |
563 |
491 |
427 |
383 |
275 |
499.57 |
151.5 |
|
PO4-3, (mg/l) |
0.04 |
0.397 |
0.392 |
0.319 |
0.237 |
0.186 |
0.161 |
0.124 |
0.259 |
0.111 |
|
Ca2+, (mg/l) |
75 |
1004 |
931 |
902 |
730 |
487 |
340 |
314 |
672.57 |
290.45 |
|
K+, (mg/l) |
0.5 |
5.709 |
5.315 |
3.453 |
3.378 |
3.174 |
2.674 |
2.611 |
3.759 |
1.245 |
|
NH3+, (mg/l) |
0.1 |
8.952 |
7.042 |
5.226 |
5.215 |
5.167 |
5.109 |
5.088 |
5.971 |
1.490 |
|
Phenol, (mg/l) |
0.001 |
0.253 |
0.231 |
0.209 |
0.184 |
0.136 |
0.097 |
0.070 |
0.169 |
0.069 |
|
Total no. of Bactria/ml |
500 |
11*104 |
11*104 |
109800 |
109400 |
109000 |
108000 |
108200 |
109200 |
832.666 |
4.1 Evaluation of the leachate contaminants in groundwater
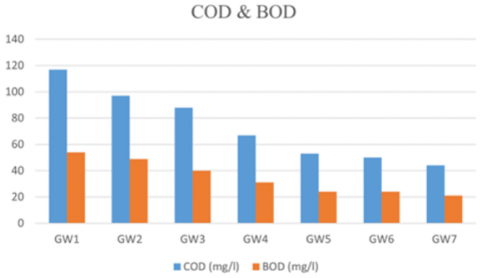
The groundwater at the testing locations (GW1, GW2, and GW3) beside the landfill showed significant concentrations of leachate contaminants, including COD, BOD, SO4-2, PO4-3, NH3+, and phenol. These concentrations start to vanish upon arriving at the residential area Figures 3 and 5-7.
Figure 3. BOD and COD values at the test locations
Figure 4. Heavy metal values at the test locations
The examination of the heavy elements identified the presence of Ni, Pb, Cr, and Cu. The concentration of heavy metals was ordered as follows: Cu > Cr > Ni > Pb, from greatest to lowest concentration. The concentration of Cu was within allowed levels at all test sites, whereas the concentration of Pb at GW1, GW2, and GW3 was also within legal limits and was not detected at the other locations. Ni and Cr concentrations above legal limits in GW1, GW2, and GW3, thereafter decreasing with distance from the landfill site, indicating that the presence of heavy metals in the regional groundwater is mostly attributable to leachate. The standard deviation (S.D.) results showed little deviation for heavy metals, while it was greater for COD, BOD, CL- and SO4-2. The data comparison in Table 3 and Figure 4 supports the above statement by showing the leachate contaminants in groundwater. Table 3 shows the amounts of inorganic elements (TDS, Cl-, Ca+2, K+, Fe) and the electrical conductivity (EC) measurements. Testing locations within and adjacent to the landfill cell showed a rise in concentrations, while sites far from the cell showed a decrease. Table 4 and Figures 8 and 9 provide analytical findings that estimate the (WQI) and its appropriateness for diverse applications. The locations (GW1, GW2, GW3) deem this water unsuitable for human consumption unless it undergoes treatment. The results from (GW4) suggest that the groundwater can be exclusively used for restricted irrigation, while (GW5) also suggests irrigation use without restriction. However, the results of the analysis for the two sites (GW6 and GW7) indicate that the water is appropriate for agriculture and industrial uses.
Table 4. WQI values for groundwater quality at the testing sites
|
Testing site |
Distance |
WQI Value |
Status |
Possible Usage |
|
GW1 |
150-meter north landfill |
246.57 |
Unsuitable for Drinking |
Treatment is required before use |
|
GW2 |
150-meter east landfill toward the city |
214.43 |
Unsuitable for Drinking |
Treatment is required before use |
|
GW3 |
650-meter east landfill toward the city |
162.94 |
Unsuitable for Drinking |
Treatment is required before use |
|
GW4 |
1300-meter east landfill toward the city |
114.53 |
Very Poor |
Restricted use for Irrigation |
|
GW5 |
1800-meter east landfill toward the city |
88.61 |
Poor |
Irrigation |
|
GW6 |
2500-meter east landfill toward the city |
72.89 |
Fair |
Irrigation and Industrial |
|
GW7 |
3000-meter east landfill toward the city |
54.80 |
Fair |
Irrigation and Industrial |
Figure 5. Phenol and iron values at the test locations
Consequently, we can infer that the influence of untreated leachate on the surrounding region can significantly extend up to 1.3 kilometers; however, its effect diminishes towards the closest residential area, about 3 km.
Figure 6. PO4-3 and NH3+ values at the test locations
Figure 7. SO4-2 and CL-values at the test locations
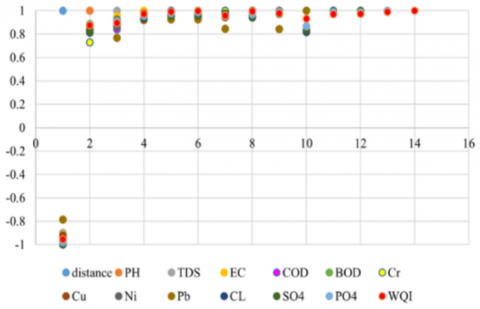
All of the parameters that have been studied have had their correlations, which show the statistical relationship between them, calculated and given in matrix form. Based on these correlation values, a correlation has been constructed for the selected criteria to be examined. Strong associations between two variables are indicated by a high correlation coefficient (near 1 or -1), whereas no link is indicated by a value near zero [25].
Figure 8. The water quality index of the groundwater in testing sites
Figure 9. Contour line's water quality index of the groundwater
According to Justus Reymond et al. [26], values over 0.6 identify the factors with strong correlations. Table 5 and Figure 10 show a strong positive correlation between tested parameters; this demonstrates that the groundwater contamination originates from the same leachate as the solid waste landfill.
The strong negative correlation between distance and parameters indicates that pollutant concentrations were likely to diminish as distance increases from the landfill site. The water quality index value also diminishes with expanding distance from the landfill location, indicating an improvement in water quality towards the nearest residential area.
Table 5. Pollutant concentration correlation matrix in groundwater
|
|
Distance |
pH |
TDS |
EC |
COD |
BOD |
Cr |
Cu |
Ni |
Pb |
CL- |
SO4-2 |
PO4-3 |
WQI |
|
Distance |
1 |
|
|
|
|
|
|
|
|
|
|
|
|
|
|
pH |
-0.79 |
1 |
|
|
|
|
|
|
|
|
|
|
|
|
|
TDS |
-0.90 |
0.82 |
1 |
|
|
|
|
|
|
|
|
|
|
|
|
EC |
-0.92 |
0.87 |
0.95 |
1 |
|
|
|
|
|
|
|
|
|
|
|
COD |
-0.95 |
0.85 |
0.84 |
0.94 |
1 |
|
|
|
|
|
|
|
|
|
|
BOD |
-0.95 |
0.89 |
0.88 |
0.96 |
0.99 |
1 |
|
|
|
|
|
|
|
|
|
Cr |
-0.97 |
0.73 |
0.89 |
0.94 |
0.95 |
0.94 |
1 |
|
|
|
|
|
|
|
|
Cu |
-0.92 |
0.87 |
0.89 |
0.98 |
0.98 |
0.99 |
0.95 |
1 |
|
|
|
|
|
|
|
Ni |
-0.98 |
0.85 |
0.86 |
0.92 |
0.98 |
0.98 |
0.95 |
0.95 |
1 |
|
|
|
|
|
|
Pb |
-0.79 |
0.84 |
0.77 |
0.92 |
0.93 |
0.93 |
0.85 |
0.96 |
0.84 |
1 |
|
|
|
|
|
CL- |
-0.99 |
0.81 |
0.91 |
0.94 |
0.96 |
0.96 |
0.98 |
0.94 |
0.99 |
0.82 |
1 |
|
|
|
|
SO4-2 |
-0.99 |
0.82 |
0.92 |
0.95 |
0.96 |
0.96 |
0.97 |
0.95 |
0.97 |
0.83 |
0.99 |
1 |
|
|
|
PO4-3 |
-0.98 |
0.88 |
0.91 |
0.96 |
0.98 |
0.99 |
0.96 |
0.97 |
0.99 |
0.87 |
0.99 |
0.99 |
1 |
|
|
WQI |
-0.95 |
0.88 |
0.89 |
0.97 |
0.99 |
0.99 |
0.96 |
0.99 |
0.98 |
0.93 |
0.97 |
0.97 |
0.99 |
1 |
Figure 10. Pollutant concentration correlation analysis in groundwater
Kirkuk sanitary landfill was selected as the research site due to its importance to the environment, community, and surrounding residential areas. The study sought to clarify the significant effect of solid waste leaching on groundwater properties. The leachate from the Kirkuk landfill has extraordinarily high values for almost all physicochemical criteria. The LPI results referred to exceeded the permissible limit by nearly 450%. The impact of leachate percolation on the adjacent groundwater is apparent. The majority of the groundwater's physicochemical characteristics were found to exceed their respective acceptable limits. Heavy metals such as Pb and Cu were below the permissible limit, while Ni and Cr exceeded the allowable limit. According to WQI, Groundwater properties were significantly affected for 1.3 km away from the landfill's outside and were unfit for human consumption unless treated. Used for drinking purposes, it leads to many health issues for humans, animals, and plants. Meanwhile, groundwater for the remaining distance (1.7 km) from the nearest residential area was unfit for drinking and could be used for limited irrigation and industrial applications. As the distance from the landfill site grows, pollutant concentrations tend to decrease, according to the matrix for correlation analysis between parameters, which indicates a significant correlation.
The study recommends adopting scientific and technological means to mitigate the impact of sanitary landfill leachate. Special pipe networks should be used to drain the leachate leaking from the landfill cells to safe sites for collection and treatment using modern treatment techniques. Future studies should also investigate the health effects of environmental pollution in the area.
This work is supported by the Building and Construction Engineering Department / Al-Mussaib Technical College, Al-Furat Al-Awsat Technical University, Babylon 51001, Iraq.
|
pH |
Degree of acidity or alkalinity of a tested sample |
|
TDS |
Total dissolved solids (mg/l) |
|
EC |
Electrical conductivity (μS/cm) |
|
COD |
Chemical oxygen demand (mg/l) |
|
BOD |
Biochemical oxygen demand |
|
Qn |
Quality rating of the nth water quality parameter |
|
Wn |
Unit weight of the nth water quality parameter |
|
Vn |
Estimated value of the nth water quality parameter's value at a certain sample location |
|
Vid |
The ideal value for the nth parameter in pure water |
|
Sn |
Standard allowable value of the nth water quality parameter |
|
WQI |
Water quality index |
|
LPI |
Leachate pollution index |
|
GIS |
Geographic information system |
|
IDW |
Inverse distance weighting interpolation |
[1] Sheriff, B. (2021). Impact of landfill leachate on groundwater quality index of some selected areas of Maiduguri Borno State, Nigeria. International Journal of Information, Engineering & Technology, 11(5): 62-80.
[2] Roy, P.K., Islam, M.M., Murshalin, T., Miah, M.S.U. (2023). Environmental impact of landfill on groundwater quality in city hut landfill area, Rajshahi. In Proceedings of International Conference on Planning, Architecture and Civil Engineering, Rajshahi, Bangladesh, pp. 605-609.
[3] Mitha M.M., Ravathi, M.C. (2020). Review paper on assessment of groundwater quality in open landfill. International Journal of Engineering and Technical Research, 9: 566.
[4] Alizadeh, M., Mirhoseini, S.A., Dolatabadi, M., Ebrahimi, A.A. (2018). Evaluation the effect of landfill leachate on the surface water quality: A case study in Tonekabon landfill. Journal of Environmental Health and Sustainable Development, 3(1): 472-480.
[5] Podlasek, A., Jakimiuk, A., Vaverková, M.D., Koda, E. (2021). Monitoring and assessment of groundwater quality at landfill sites: Selected case studies of Poland and the Czech Republic. Sustainability, 13(14): 7769. https://doi.org/10.3390/su13147769
[6] Angmo, S., Shah, S. (2021). Impact of Okhla, Bhalswa and Ghazipur municipal waste dumpsites (Landfill) on groundwater quality in Delhi. Current World Environment, 16(1): 210-220. http://doi.org/10.12944/CWE.16.1.21
[7] Azim, M.D., Rahman, M.M., Khan, R.H., Kamal, A. (2011). Characteristics of leachate generated at landfill sites and probable risks of surface and groundwater pollution in the surrounding areas: A case study of Matuail landfill site. Journal of Bangladesh Academy of Sciences, 35(2): 153-160. https://doi.org/10.3329/jbas.v35i2.9418
[8] Abd El-Salam, M.M., Abu-Zuid, G.I. (2015). Impact of landfill leachate on the groundwater quality: A case study in Egypt. Journal of Advanced Research, 6(4): 579-586. https://doi.org/10.1016/j.jare.2014.02.003
[9] Alam, P., Sharholy, M., Ahmad, K. (2020). A study on the landfill leachate and its impact on groundwater quality of Ghazipur Area, New Delhi, India. In Kalamdhad, A. (eds) Recent Developments in Waste Management. Lecture Notes in Civil Engineering, 57: 345-358. https://doi.org/10.1007/978-981-15-0990-2_27
[10] Al Raisi, S.A.H., Sulaiman, H., Suliman, F.E., Abdallah, O. (2014). Assessment of heavy metals in leachate of an unlined landfill in the Sultanate of Oman. International Journal of Environmental Science and Development, 5(1): 60-63.
[11] Rajoo, K.S., Karam, D.S., Ismail, A., Arifin, A. (2020). Evaluating the leachate contamination impact of landfills and open dumpsites from developing countries using the proposed Leachate Pollution Index for Developing Countries (LPIDC), Environmental Nanotechnology, Monitoring & Management, 14: 100372. https://doi.org/10.1016/j.enmm.2020.100372
[12] Naveen, B.P., Sivapullaiah, P.V., Sitharam, T.G., Ramachandra, T.V. (2014). Characterization of leachate from municipal landfill and its effect on surrounding water bodies. In LAKE 2014: Conference on Conservation and Sustainable Management of Wetland Ecosystems in Western Ghats, pp. 1-9. https://doi.org/10.13140/2.1.4110.3044
[13] Singh, V.P., Pandey, S., Kumar, V. (2024). Cumulative impact assessment of groundwater quality using water quality index, leachate pollution index, and GIS: A case study of Shivri Municipal Landfill Site, Lucknow, India. World Journal of Advanced Research and Reviews, 23(1): 1150-1160. https://doi.org/10.30574/wjarr.2024.23.1.2115
[14] Maiti, S.K., De, S., Hazra, T., Debsarkar, A., Dutta, A. (2015). Assessment of impact of landfill leachate generation on ground and surface water quality-A municipal solid waste landfill site, Dhapa, Kolkata case study. International Journal of Engineering Technology, Management and Applied Sciences, 3(1): 212-224.
[15] Negi, P., Mor, S., Ravindra, K. (2020). Impact of landfill leachate on the groundwater quality in three cities of North India and health risk assessment. Environment, Development and Sustainability, 22: 1455-1474. https://doi.org/10.1007/s10668-018-0257-1
[16] El-Mageed, N., and Farouk, E. (2021). Impact of landfill leachate on the groundwater quality in governorate of Karbala, Iraq. International Journal of Civil Engineering and Technology, 12(12): 16-24. https://doi.org/10.34218/IJCIET.12.12.2021.003
[17] Awaz, B.M. (2015). Leachate and ground water assessment at Kirkuk sanitary landfill site in Zindana Village, Iraq. International Journal of Environmental Research, 9(2): 457-466.
[18] Mohanty, B., Patel, Z., Shah, P., Thakkar, A., Rathod, S. (2019). Characterization and effects of municipal solid waste landfill leachate on ground water quality, case study of Gandhinagar City, Gujarat. Journal of Interdisciplinary Cycle Research, 11(10): 607-613.
[19] Jadeja, R., Joshi, H., Zala, B., Patel, J., Chauhan, A., Professor, A. (2019). Influence of leachate on groundwater near Pirana landfill site focused on heavy metal and Arsenic contamination. Journal of Emerging Technologies and Innovative Research, 6(5): 544-549. https://doi.org/10.13140/RG.2.2.29282.99528
[20] Kumar, D., Alappat, B.J. (2005). Analysis of leachate pollution index and formulation of sub-leachate pollution indices. Waste Management & Research, 23(3): 230-239.
[21] Bisht, T.S., Kumar, D., and Alappat, B.J. (2022). Revised leachate pollution index (r-LPI): A tool to quantify the contamination potential of landfill leachate. Process Safety and Environmental Protection, 168: 1142-1154. https://doi.org/10.1016/j.psep.2022.10.052
[22] Călmuc, V.A., Călmuc, M., Țopa, C.M., Timofti, M., Iticescu, C., Georgescu, L.P. (2018). Various methods for calculating the water quality index. Annals of the “Dunarea de Jos” University of Galati. Fascicle II, Mathematics, Physics, Theoretical Mechanics, 41(1): 171-178. https://doi.org/10.35219/annugalmathphysmec.2018.2.09
[23] Kotadiya, N.G., Acharya, C.A., Radadia, B.B., Solanki, H.A. (2013). Determination of water quality index and suitability of a rural freshwater body in Ghuma Village, District Ahmedabad, Gujarat. Life Sciences Leaflets, 2: 68-75. https://petsd.org/ojs/index.php/lifesciencesleaflets/article/view/501.
[24] Haingotseheno, R., Chrysostome, R.J., Robert, R., Tojonirina, A.R. (2020). Water Quality Index (WQI) calculation for the evaluation of physico-chemical quality of rainwater collected in Reservoirs Full of sand (RFS). International Journal of Advance Research and Innovative Ideas in Education, 6(6): 1050-1061.
[25] Singh, U.K., Kumar, M., Chauhan, R., Jha, P.K., Ramanathan, A.L., Subramanian, V. (2008). Assessment of the impact of landfill on groundwater quality: A case study of the Pirana site in western India. Environmental Monitoring and Assessment, 141(1): 309-321. https://doi.org/10.1007/s10661-007-9897-6
[26] Justus Reymond, D., Sudarsan, J.S., Annadurai, R., Nithiyanantham, S. (2019). Groundwater quality around municipal solid waste dump in Tiruchirappalli (South India). International Journal of Environmental Science and Technology, 16: 7375-7392. https://doi.org/10.1007/s13762-018-2063-6