Bahaa Ahmed Samir*![]() | Anmar Dherar Kosaj
| Anmar Dherar Kosaj![]()
© 2024 The authors. This article is published by IIETA and is licensed under the CC BY 4.0 license (http://creativecommons.org/licenses/by/4.0/).
OPEN ACCESS
The impacts of heavy metal pollution on the planet are among the major environmental problems, with oil facilities having been singled out as the key origin of the heavy metal emissions. Hence, the current study was conducted to investigate the levels of heavy metals in the soil of oil installations and centers for distribution of Anbar Province, Iraq. The samples of soil were done and performed by AAS (Flame Atomic Absorption Spectroscopy). Additionally, some environmental pollution indicators were measured to find their origins over space and time. The results reveal that the average heavy metal concentrations exceeded the limit value set by the World Health Organization and the U.S. Environmental Protection Agency, respectively. Pollution indicators, such as Contamination Factor (CF), Pollution Load Index (PLI), and Geoaccumulation Index (Igeo), were used to examine the level of contamination, which revealed that the area is either uncontaminated or moderately contaminated. Human activities, particularly the increase in air pollution driven by rapid population growth, have been identified as the primary contributors to soil contamination. This research sheds light on the nature and the sources of heavy metal pollution in oil facility sites, exploring the possible solutions to this environmental problem.
Flame Atomic Absorption Spectroscopy, Contamination Factor (CF), Pollution Load Index (PLI), Geoaccumulation Index (Igeo)
Soil pollution from heavy metals, especially in the vicinity of oil depots and other oil handling facilities, brings very negative consequences to both human beings and to our environment. The collection of metals that are too heavy in the soil can easily happen from natural processes as well as human activities with severe consequences of soil degradation, water contamination and creation of disturbed ecosystem. A proper knowledge of the portion and the influence of heavy metals in such ecosystems is necessary to keep the human rights and the ecological balance healthy, therefore the pollution management strategies can be designed effectively [1-4].
1.1 Contextual background
Being a part of the earth’s crust, the heavy metals (arsenic, cadmium, chromium, lead, and mercury) contrary to their name may get concentrated in the soil and water due to either geological activities or human activities. Oil storage sites and distribution facilities are the main sources of heavy metals pollution, because the emissions are contributed by the activities of fuel storage, transportation, and services. So, all these sources of heavy metals pollute the surrounding environment. The closeness of such operations to the residential areas and the agricultural lands gives an impression that environmentally sensitive groups are likely to be increasingly exposed to this route of emission and hence are likely to be adversely affected.
Recent researches show that heavy metals pollution in the soil is becoming a worldwide forum, and so it has important consequences for ecosystems’ health, safe food and human lives. Enriching the soil with the heavy metals would cause depletion of soil resulting in lower crop yields and the bioaccumulation of the metals can completely affect the plants, animals and humans. In addition, heavy metals such as lead, mercury, release upon exposure through soil, water, or food leader to lung diseases and many more types of cancer. Populations of high-risk groups like children and pregnant ladies are relatively victims who have a poor tolerance to metal toxicity [5-17].
1.2 Methodological approach
Recent research has employed a variety of methodological approaches to assess heavy metal pollution in soils, ensuring comprehensive analysis and accurate results. A commonly employed approach is Atomic Absorption Spectroscopy (AAS), characterize particularly by high sensitivity and selectivity of the identification and determination of heavy metals – lead, cadmium, nickel, etc. Several researchers have applied AAS for the detection of soil pollution in areas around industries, and hence the application of this technique in environmental monitoring and assessment of pollution [4, 9]. Another complex method includes Inductively Coupled Plasma Mass Spectrometry where one can estimate traces of metals in the samples of soil. The reasons for this lie in the methods used by ICP-MS, where multiple elements are analyzed with high accuracy and at the same time [6, 7].
To assess the level of heavy metal pollution, scientists apply pollution indices, which include Contamination Factor (CF), Pollution Load Index (PLI), and Geoaccumulation Index (Igeo). These indices are important for the differentiation of natural and man-induced sources of pollution and are used as a universal approach to evaluate the extents of environmental harm. The CF aides in determining the areas of high concentrations of metals higher than the natural background levels while the PLI and Igeo provide information on the extent of deterioration of the soils and the extent of pollution respectively [10, 18].
This study aims to examine and assess heavy metal concentration of soil samples taken from oil storage depots and distribution centers at Al-Anbar Governorate. Soil samples will be taken with standardized procedures sampled from representative locations within the facilities as well outside them. The application of analytical tools like the Atomic Absorption Spectroscopy and the inductively coupled plasma mass spectrometry will be utilized to determine the heavy metals levels in the soil samples.
The samples were collected under natural weather conditions, where the temperature ranged between 12℃ and 23°C, and wind speed was between 12 km/h and 28 km/h. The humidity ranged between 73% and 82%. The soil samples were collected from the surface soil without any depth because the contamination levels in the soil vary according to its depth. Surface soil is generally more contaminated compared to subsurface soil as the former is more affected by solar radiation, temperature, humidity, and evaporation, which increase the concentration of pollutants. A small shovel was used to collect the soil samples, which were then placed in tightly sealed transparent polyethylene containers to preserve their condition for analysis.
To estimate a heavy metals pollution level, we will use the pollution indices which are like the Contamination Factor (CF), Pollution Load Index (PLI), and Geoaccumulation Index (Igeo). Such indices will yield measurements of the contamination level and crucial identification of metal pollutant’s sources. This will provide data that will guide informed choices and pollution control measures.
1.3 Potential impacts
A variety of research studies have investigated the effects of heavy metal pollution in soils which have numerous effects on the environmental health and socio-economic status. Environmentally, heavy metal causes pollution in the soil and hence reduced fertility and destruction of the ecosystem. Heavy metals can be long-lasting in the environment and toxic to plants and microbes thus showing potential for chronic pollution. This form of contamination presents potential threats to the continued sustainability of the ecosystem and species richness [5, 11].
There are significant health consequences linked to increased concentrations of heavy metals such as respiratory disorders, cancer, and developmental issues in children. Heavy metals like lead and mercury are considered to be highly dangerous due to their toxic effects and ability to accumulate in the biological systems of organisms. There is possibility of having contact with contaminated soil, having contaminated food and water and even inhaling contaminated dust [12, 15].
From the economic and social point of view, soil contamination reduces the yields of agricultural production, thus having the most immediate effect on people’s nutrition and their economies. Efficient cleaning of contaminated areas is costly, and the management of the sites entails huge costs. Furthermore, polluted regions incur lower land value and higher healthcare costs due to the effects of pollution diseases. It can therefore be concluded that remediating heavy metal contaminated soils is not only an environmental need but also an economic and health necessity [2, 16].
Incorporating methods like multispectral analysis and ICP-MS with the evaluation of pollution indices offers a solid methodological basis to determine the level of contamination of heavy metals in soils. Understanding the potential environmental and health impacts is crucial for developing effective mitigation strategies and informing policy decisions. This research therefore seeks to contribute to the existing literature by offering quantitative information on the extent of heavy metal pollution in the soil surrounding oil depot facilities and distribution centers to help stakeholders develop appropriate measures to reduce pollution risks and fostering sustainable development in the area.
1.4 Research gap and contribution
Soil pollution from industrial activities including oil-related facilities have already been previously recognized [1]. To complete this gap in information as it relates specifically to operations in the Al-Anbar Governorate, research in this area needs to be done. Thus, this investigation tries to cover this gap by obtaining empirical data about the level and consequences of heavy metals contamination within the soil in the vicinity of oil depot sites and distribution centers. In this case, the study will close this knowledge gap, so to educate all stakeholders, policymakers, and the scientific community about the environmental and public health risks associated with oil activities, thus enabling them to implement relevant strategies to mitigate pollution hazards and promote sustainable development in the region.
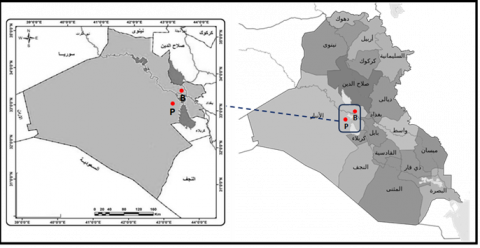
2.1 Study area sites
As shown in Table 1, the study area included two oil depots, namely the New Anbar Oil Depot and the Haditha Oil Depot (see Figure 1). Additionally, the study encompassed distribution centers for petroleum products, specifically the Ramadi Oil Distribution Center and the Fallujah Oil Distribution Center (see Figure 2).
2.2 Sample collection
Samples were collected from various locations within each area. Three samples were collected from each site: tank area, loading area, and pump area, resulting in three samples for examination from each site. A small shovel was used to collect soil samples from the designated areas, and the soil was placed in tightly sealed transparent polyethylene containers. After collection, the samples were transported to the Pollution Laboratory at the Faculty of Applied Sciences at Anbar University for preparation for examination.
Table 1. Coordinates of study areas
|
Site Name |
Site Code |
Location |
|
|
Longitude |
Latitude |
||
|
New Anbar Oil Depot |
M |
43.25066969 |
33.40106282 |
|
Haditha Oil Depot |
W |
42.35996411 |
34.06683476 |
|
Ramadi Oil Distribution Center |
P |
43.30061565 |
33.43597768 |
|
Fallujah Oil Distribution Center |
B |
43.76105480 |
33.34846155 |
Figure 1. Locations of oil depots
Figure 2. Locations of oil distribution centers
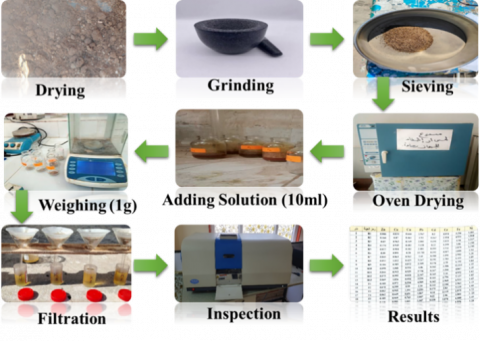
2.3 Sample preparation
Following the representation in Figure 3, after collecting the samples, a mixing process was conducted for samples belonging to each study site to obtain twelve samples for heavy metal analysis. All samples went through to the electric furnace and drying stage, after that grinder was used to produce powders that were later sieved to obtain the desired impurity-free substance. The detailed importance of the heavy metal examination requested dough digestion of these samples. Three acids (HCl, H2SO4, HNO3) of different strengths are used for the digesting of samples. And 1g of each sample is weighed and put into a 100ml beaker, a special solution is added which is the mixture of the 2ml of nitric acid (HNO3), the 3ml of hydrochloric acid (HCl) and the 2ml of sulfuric acid (H2SO4).
This later was then well-mixed with the temperature being brought to about 45 minutes of a heating reaction until the mixture turned into a solid form when the added acid reacts with the other chemicals. Next, the mixture was cooled and then distilled water was added after which the mixture was filtrated using filter paper. Distilled water, placed in a beaker, was used to wash the beaker, and then added to the filter paper until the filtered sample reached 50ml. The sample (50ml) was bottled in polyethylene containers for future examination.
Figure 3. Stages of the digestion process
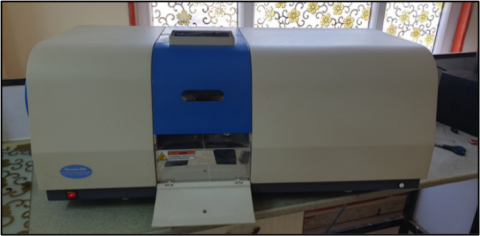
2.4 Sample analysis
Concerning the analysis of the prepared samples beforehand, Atomic Absorption Spectrophotometer (AAS) instrument was utilized to ascertain the quantities of heavy metals present in the collected samples. The spectrophotometer used in this study is from Australia as displayed in Figure 4, located in the Chemistry Department of the College of Science at Anbar University. It was utilized to measure heavy metals present in liquid form, such as (CO, Cr, Cd, Cu, Fe, Zn, Ni, Mn, Pb). These elements are measured after the samples have been prepared and digested.
Figure 4. Image of Atomic Absorption Spectroscopy (AAS) device
To assess the level of pollution in the study area and determine whether the concentrations of heavy metals calculated are high or not, the following indices are used:
3.1 Contamination Factor (CF)
The Contamination Factor is defined as the concentration of heavy metals in the soil exceeding the natural abundance present in the earth’s crust. It is an effective tool for monitoring heavy metal pollution and is used to evaluate the degree of pollution resulting from human activity. Additionally, it can be used to distinguish between the origin of heavy metals, whether they are of anthropogenic origin or from natural sources. The Contamination Factor categorizes the level of heavy metal pollution in soil and dust samples based on the division of the concentration of each element in the sample by the concentration of the natural background for that element as revealed in Table 2. Eq. (1) is used to calculate the Contamination Factor (CF) as follows [19]:
$C F=\frac{Cm)_{sample}}{(Cm)_{Background}}$ (1)
where, $(Cm)_{sample}$ is concentration of any element in the studied sample and $(Cm)_{ Background}$ is the concentration of the same element in the earth’s crust.
Table 2. Contamination Factor (CF) levels [20]
|
Contamination Factor (CF) |
Pollution Level |
|
CF<1 |
Low pollution |
|
1≤CF<3 |
Moderate pollution |
|
3≤CF<6 |
High pollution |
|
CF>6 |
Very high pollution |
3.2 Pollution Load Index (PLI)
Pollution Load Index (PLI) is a widely used indicator to assess the degree of pollution in soil. The PLI is calculated by multiplying the Contamination Factors (CF) of various heavy metals. The Contamination Factor (CF) for each metal is the ratio of its concentration in the soil to its background concentration (baseline level). The basis for employing PLI is that the obtained value gives an additive expression for the general level of contamination of the soil by heavy metals, taking into account the specific index of contamination by a number of metals. This index aids in determining the extent of soil degradation by heavy metals, thus providing information of the environmental status of the area. PLI can be divided into six categories as illustrated in Table 3, and it can be calculated using the following Eq. (2) [18]:
$\mathrm{PLI}=\left(\mathrm{CF}_1 \times \mathrm{CF}_2 \times \mathrm{CF}_3 \times \ldots \times \mathrm{CF}_{\mathrm{n}}\right)^{1 / \mathrm{n}}$ (2)
where, CF is the Contamination Factor for each metal calculated from Eq. (1), and n is the number of metals considered. This multiplicative approach provides a comprehensive measure of the pollution load, as it accounts for the combined effects of all heavy metals present in the soil.
Table 3. Pollution load index indicator [21]
|
Degree |
PLI Value |
Pollution Level |
|
1 |
PLI ≤ 1 |
Not polluted |
|
2 |
1 ≥ PLI ≥ 2 |
Slightly to moderately polluted |
|
3 |
2 ≥ PLI ≥ 3 |
Moderately polluted |
|
4 |
3 ≥ PLI ≥ 4 |
Moderate to highly polluted |
|
5 |
4 ≥ PLI ≥ 5 |
Highly polluted |
|
6 |
5 < PLI |
Extremely highly polluted |
3.3 The Geoaccumulation Index (Igeo)
It is one of the most commonly used indicators for quantitatively measuring the level of metal pollution. This indicator is widely used to assess the levels of heavy metal pollution in urban soil by comparing current concentrations with reference background concentrations. The calculation of the Geoaccumulation Index in soil is as demonstrated in Table 4, and the calculation of the Geoaccumulation factor is performed using Eq. (3) [22]:
Where ${Ci}_{sample}$ is concentration of the element being assessed for accumulation (sample under study), and ${Ci}_{Background}$ is original concentration (reference sample) of the element multiplied by 1.5 to account for variability in the original value in the environment.
$I_{geo}=\log _2\left(\frac{C i_{sample}}{1.5 \times C i_{Background}}\right)$ (3)
Table 4. Seven levels of the Geoaccumulation Index [9]
|
Degree |
Level Value of Igeo |
Pollution Level |
|
0 |
0 ≥ Igeo |
Not polluted |
|
1 |
1 < Igeo ≤ 0 |
Not polluted to moderately polluted |
|
2 |
2 < Igeo ≤ 1 |
Moderately polluted |
|
3 |
3 < Igeo ≤ 2 |
Moderately to highly polluted |
|
4 |
4 < Igeo ≤ 3 |
Highly polluted |
|
5 |
5 < Igeo ≤ 4 |
Highly to severely polluted |
|
6 |
5 < Igeo |
Severely polluted |
4.1 Heavy metal concentrations
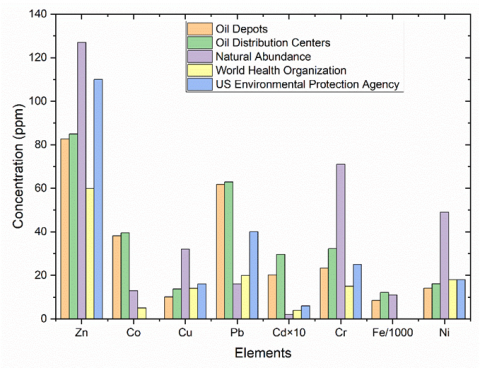
Table 5 and Table 6 illustrate the concentrations of heavy metals in the study areas, including oil storage facilities and oil distribution centers. The average concentrations of heavy metals (Ni, Fe, Cr, Cd, Pb, Cu, Co, Zn) in the oil storage facilities were (82.709, 38.17, 10.116, 61.753, 2.023, 23.326, 8447.3, 14.125) ppm respectively. Similarly, the average concentration of heavy metals (Ni, Fe, Cr, Cd, Pb, Cu, Co, Zn) in the oil distribution centers were (84.9725, 39.508, 13.725, 62.898, 2.963, 32.245, 12135.33, 16.131) ppm respectively. These values exceeded the natural abundance levels of heavy metals (Fe, Cd, Pb, Co). Additionally, the concentration of all metals exceeded the permissible limits set by the World Health Organization [23], except for copper (Cu). The high concentrations of these elements in the soil samples in the study area compared to the permissible limits set by the World Health Organization clearly indicate significant and substantial levels of pollution. The results clearly demonstrate that human activities are the primary source of soil contamination.
The increase in concentrations of these elements can be attributed to several factors, including natural processes and geological inputs from weathering and erosion of exposed rock layers on the Earth’s surface, agricultural activities, and various anthropogenic sources [24]. In order to perform a comprehensive mechanism analysis of the test results, it is essential to examine external factors in the sampling area. These factors include [25, 26]:
(1) Industrial Activities: Periodic oil spills are also common around areas that surround storage depots and distribution centers, which can lead to soil pollution. Fumes from neighboring industries, petrochemical processing plants, and other manufacturing plants can spread heavy metals on the ground.
(2) Traffic Emissions: Vehicles passing near oil depots and distribution centres retain high traffic density which results in heavy metals including lead, cadmium and zinc from emission and wear of automobile exhaust and tires.
(3) Agricultural Practices: Agricultural farming activities that surround the manufacturing site impact the content of heavy metals due to use of pesticides, herbicides, and fertilizer that contains elements like arsenic, mercury, and copper.
(4) Atmospheric Deposition: Accumulation of heavy metals in the surface soil may occur due to atmospheric deposition from local and remote sources. This covers the emissions from mobile sources like cars and also from industries that involve use of combustion sources such as power plants and emissions from home use heaters.
(5) Natural Sources: Basic levels of heavy metals in the soil can be introduced by natural processes of weathering of parent rocks and volcanic activity.
Hydrological Factors: Contamination and dispersion of water through the soil such as surface water runoff from contaminated zones and leaching can also influence the distribution of heavy metal in various layers of the soil.
The average concentrations of heavy metal elements for each site are represented, along with comparisons to natural abundance levels and permissible limits set by the World Health Organization for each element in a stacked bar chart format, aiming to provide a descriptive comparison of the concentrations of these elements in these locations, demonstrating the elevation of each column representing the concentration level of each element, as shown in Figure 5.
Table 5. Heavy metal levels in ppm from oil depots, measured by AAS
|
Area |
Symbol |
Zn |
Co |
Cu |
Pb |
Cd |
Cr |
Fe |
Ni |
|
New Anbar Oil Depot |
M1 |
83.86 |
37.24 |
12.25 |
69.12 |
1.74 |
24.47 |
8852 |
21.65 |
|
M2 |
81.56 |
35.99 |
10.04 |
82.73 |
1.49 |
16.65 |
7514 |
25.95 |
|
|
M3 |
78.25 |
39.12 |
9.25 |
73.66 |
2.31 |
38.26 |
6928 |
9.18 |
|
|
Average |
81.223 |
37.45 |
10.513 |
75.17 |
1.8467 |
26.46 |
7764.6 |
18.9267 |
|
|
Haditha Oil Depot |
W1 |
74.59 |
37.84 |
12.02 |
54.29 |
2.04 |
21.12 |
11858 |
17.35 |
|
W2 |
87.625 |
38.14 |
7.53 |
42.73 |
3.16 |
14.73 |
3166 |
4.451 |
|
|
W3 |
90.375 |
40.69 |
9.61 |
47.99 |
1.4 |
24.73 |
12366 |
6.171 |
|
|
Average |
84.196 |
38.89 |
9.72 |
48.3366 |
2.2 |
20.193 |
9130 |
9.324 |
|
|
World Health Organization [23] |
60 |
5 |
14 |
20 |
0.4 |
15 |
- |
18 |
|
|
US Environmental Protection Agency [9] |
110 |
- |
16 |
40 |
0.6 |
25 |
30 |
16 |
|
|
Natural Abundance [24] |
127 |
13 |
32 |
16 |
0.2 |
71 |
- |
49 |
|
|
Overall Average |
82.709 |
38.17 |
10.116 |
61.753 |
2.023 |
23.326 |
8447.3 |
14.125 |
|
Table 6. Heavy metal levels in ppm from oil centers, detected by AAS
|
Region |
Symbol |
Zn |
Co |
Cu |
Pb |
Cd |
Cr |
Fe |
Ni |
|
Ramadi Oil Distribution Center |
P1 |
85.21 |
40.31 |
21.61 |
53.36 |
2.38 |
38.78 |
12178 |
17.35 |
|
P2 |
88.125 |
41.47 |
10.17 |
50.37 |
1.75 |
30.21 |
13712 |
10.04 |
|
|
P3 |
95.375 |
42.59 |
6.47 |
64.43 |
3.30 |
30.73 |
15502 |
21.65 |
|
|
Average |
89.57 |
41.45 |
12.75 |
56.053 |
2.476 |
33.24 |
13797.333 |
16.346 |
|
|
Fallujah Oil Distribution Center |
B1 |
75.375 |
37.03 |
10.25 |
102.45 |
1.88 |
26.87 |
10934 |
13.05 |
|
B2 |
88.25 |
37.67 |
27.7 |
59.35 |
6.28 |
31.41 |
11186 |
25.95 |
|
|
B3 |
77.50 |
38.01 |
6.15 |
47.43 |
2.18 |
35.47 |
9300 |
8.75 |
|
|
Average |
80.375 |
37.566 |
14.7 |
69.743 |
3.446 |
31.25 |
10473.33 |
15.916 |
|
|
World Health Organization |
60 |
5 |
14 |
20 |
0.4 |
15 |
- |
18 |
|
|
Environmental Protection Agency |
110 |
- |
16 |
40 |
0.6 |
25 |
30 |
16 |
|
|
Natural Abundance |
127 |
13 |
32 |
16 |
0.2 |
71 |
- |
49 |
|
|
Overall Average |
84.9725 |
39.508 |
13.725 |
62.898 |
2.963 |
32.245 |
12135.33 |
16.131 |
|
Figure 5. Stacked bar chart representing the average concentrations of heavy metal elements
4.2 Results of pollution indices
4.2.1 Pollution Factor (PF)
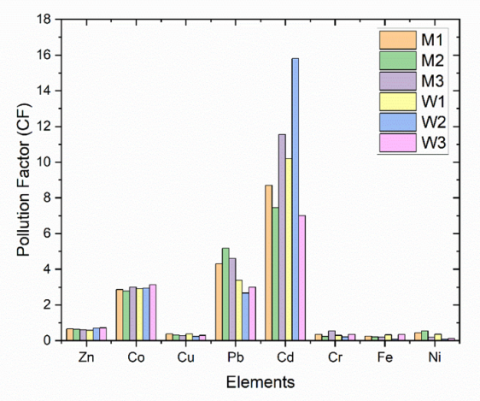
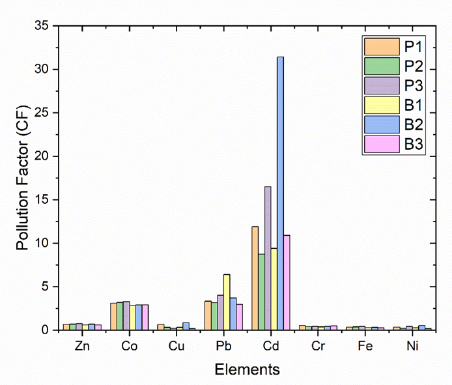
To estimate and calculate the inputs of human activities more accurately, the Pollution Factor (PF) is computed. Any increase in the values of this factor indicates the level of pollution at that site. The value of this factor is calculated according to Eq. (1), and the results are listed in Table 7 for oil depots and Table 8 for oil distribution centers. The values of the Pollution Factor were high to very high for the element (Cd) at both sites, while the elements (Pb, Co) showed pollution ranging from moderate to high. The remaining heavy elements, namely (Ni, Fe, Cr, Cu, Zn), exhibited low to moderate pollution. However, there is variation in the values of the Pollution Factor for some elements from one site to another within these two facilities, depending on the sources of these heavy elements, some of which are transported by dust storms, while others are present in surface soil or due to various human activities. The average value of each element for the Pollution Factor (PF) was represented for both sites in the form of a repetitive bar chart as shown in Figure 6 and Figure 7.
Table 7. Values of the Pollution Load Index (PLI) in oil depots
|
Region |
Symbol |
Zn |
Co |
Cu |
Pb |
Cd |
Cr |
Fe |
Ni |
|
New Anbar Oil Depot |
M1 |
0.66 |
2.865 |
0.383 |
4.32 |
8.7 |
0.345 |
0.247 |
0.442 |
|
M2 |
0.642 |
2.768 |
0.314 |
5.171 |
7.45 |
0.235 |
0.209 |
0.53 |
|
|
M3 |
0.616 |
3.009 |
0.289 |
4.604 |
11.55 |
0.539 |
0.193 |
0.187 |
|
|
Haditha Oil Depot |
W1 |
0.587 |
2.911 |
0.376 |
3.393 |
10.2 |
0.297 |
0.33 |
0.354 |
|
W2 |
0.69 |
2.934 |
0.235 |
2.671 |
15.8 |
0.207 |
0.088 |
0.091 |
|
|
W3 |
0.712 |
3.13 |
0.3 |
2.999 |
7 |
0.348 |
0.344 |
0.12 |
Table 8. Values of Pollution Factor (PF) index in oil distribution centers
|
Area |
Code |
Zn |
Co |
Cu |
Pb |
Cd |
Cr |
Fe |
Ni |
|
Ramadi Oil Distribution Center |
P1 |
0.671 |
3.101 |
0.675 |
3.335 |
11.9 |
0.546 |
0.339 |
0.354 |
|
P2 |
0.694 |
3.19 |
0.318 |
3.148 |
8.75 |
0.425 |
0.382 |
0.205 |
|
|
P3 |
0.751 |
3.276 |
0.202 |
4.027 |
16.5 |
0.433 |
0.432 |
0.442 |
|
|
Fallujah Oil Distribution Center |
B1 |
0.594 |
2.848 |
0.32 |
6.403 |
9.4 |
0.378 |
0.305 |
0.266 |
|
B2 |
0.695 |
2.898 |
0.866 |
3.709 |
31.4 |
0.442 |
0.312 |
0.53 |
|
|
B3 |
0.61 |
2.924 |
0.192 |
2.964 |
10.9 |
0.5 |
0.259 |
0.179 |
Figure 6. The distribution of Pollution Factor (PF) values in oil depots
Figure 7. The distribution of Pollution Factor (PF) values in oil distribution centers
4.2.2 Pollution Load Index (PLI)
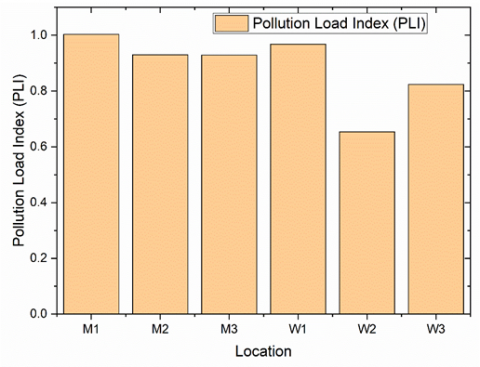
The Pollution Load Index (PLI) is utilized to assess heavy metal pollution in soil at the study sites. Table 9 presents the PLI values in soil samples collected from oil depots, while Table 10 illustrates the PLI values in soil samples collected from oil distribution centers. The results ranged between (1.0031-0.6535) in the oil depots, with an average value of (0.8845).
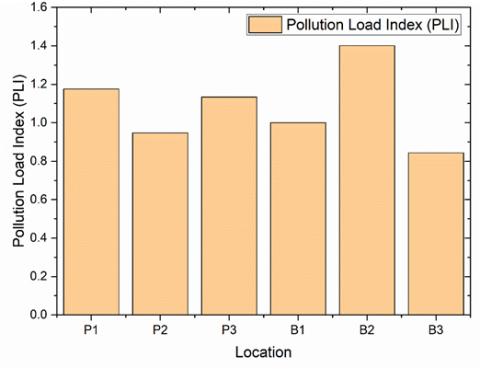
These results indicate that the PLI for all areas of the oil depots ranges from unpolluted to moderately polluted. As for the oil distribution centers, the results varied between (1.4011-0.9467), with an average value of (1.0834). This value suggests that the areas of the oil distribution centers range from unpolluted to moderately polluted. The fluctuation in the data observed is due to the fact that while conducting the sampling, soil samples were not collected from one particular location but from three different zones in a particular distribution center. These zones included the tank section, the loading zones, and the pump zones.
Moreover, it is important to emphasize that the achieved level of accuracy and precision when solving problems directly affects the reliability of conclusions made. The accuracy of the above collected data was maintained through different forms of reliability and validity tests.
Table 9. Values of the Pollution Load Index (PLI) in oil depots
|
Locations |
Site Code |
PLI Value |
Pollution Levels |
|
New Anbar Oil Depot |
M1 |
1.0031 |
Unpolluted to Moderately Polluted |
|
M2 |
0.93 |
Unpolluted |
|
|
M3 |
0.9289 |
Unpolluted |
|
|
Haditha Oil Depot |
W1 |
0.9681 |
Unpolluted |
|
W2 |
0.6535 |
Unpolluted |
|
|
W3 |
0.8236 |
Unpolluted |
Table 10. Values for Pollution Load Index (PLI) in oil distribution centers
|
Site |
Site Code |
PLI Value |
Pollution Level |
|
Ramadi Oil Distribution Center |
P1 |
1.1758 |
Non-polluted to moderately polluted |
|
P2 |
0.9467 |
Non-polluted |
|
|
P3 |
1.1338 |
Non-polluted to moderately polluted |
|
|
Fallujah Oil Distribution Center |
B1 |
0.9999 |
Non-polluted |
|
B2 |
1.4011 |
Non-polluted to moderately polluted |
|
|
B3 |
0.8436 |
Non-polluted |
Heavy metal analysis was carried out using Flame Atomic Absorption Spectroscopy (AAS) and Inductively Coupled Plasma Mass Spectroscopy (ICP-MS) which are standard, accurate and precise methods. Such quality assurance features as calibration curves using certified reference materials, blank, duplicate, spiked samples and duplicate analyses helped to guarantee the reliability of the obtained data. Relative standard deviation for duplicate samples was less than 5% and instrumental precision was kept below 3%. While method detection limits (MDLs) varied between 0.001 and 0.1 ppm for the elements. The accuracy of the measurements was also assured by confirmation of the data by independent laboratories, in which a considerable correlation (R² > 0.95) was obtained.
These stringent quality control measures ensure the data’s accuracy and precision, with a tolerance estimated to be within ±5% for all measured heavy metal concentrations.
The PLI values for both sites are represented in a bar chart format in Figure 8 and Figure 9.
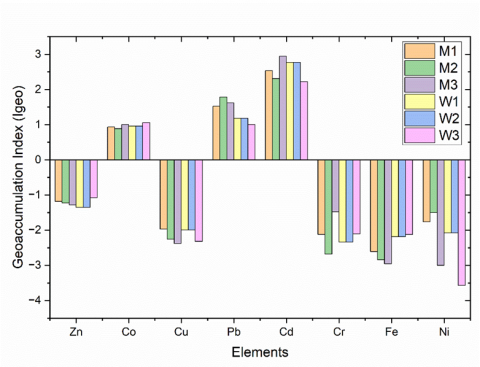
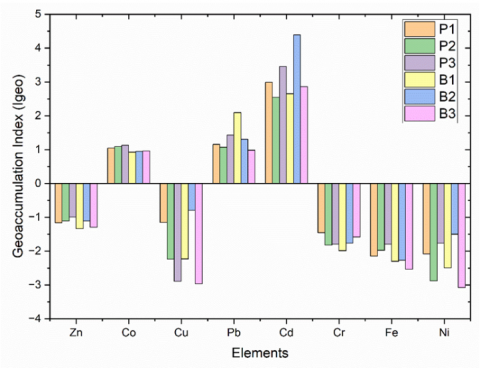
4.2.3 The Geoaccumulation Index (Igeo)
The Geoaccumulation Index (Igeo) is used to express the expected source of pollutants, whether they are from natural sources enriching the soil with heavy elements, such as geological factors like weathering and erosion of source rocks, or from human sources, represented by fuel spilled on soil due to leakage from tanks, pipelines, or discharge pumps. Fuel leakage in fuel filling areas at sites can also contribute, along with pollutants from vehicle emissions, fuel combustion, and any other human activity present in the study area. The results in Table 11 and Table 12 demonstrate the Igeo index in oil depots and distribution centers, indicating high pollution for some heavy elements, namely Cd and Pb.
The primary cause of the enhanced pollution with these elements is human activities, connected with petroleum resources, population growth that affected the soil pollution level. The links between the variables can be through the following processes.
The extraction and processing of oil as well as the distribution of these products discharge heavy metals into the surrounding environment and these accumulate on the surface of the ground [27]. These come as a result of ‘‘spillage’’, which is a common occurrence during transporting and storing of petroleum products [28]. Also, industrial waste disposal, particularly from the processing of petroleum, brings in to the ground, heavy metals [29]. Vehicular traffic also leads to enhanced emissions of heavy metals from vehicle exhausts, which cause pollution of soil [30]. Agriculture involves the use of petroleum-based fertilizers and pesticides that deposit heavy metals into the soil [31]. In addition, the steady growth of population complicates the need for industrialization as well as the utilization of energy sources, which leads to soil pollution [32].
These pathways show how the human activities that relate to the use of petroleum resources influence soil pollution and vice versa, hence the need to develop proper pollution management measures.
The values frequency distribution for the Geoaccumulation Index (Igeo) for both sites are represented in Figure 10 and Figure 11, respectively.
Figure 8. Frequency distribution of Pollution Load Index (PLI) values in oil repositories
Figure 9. Frequency distribution of Pollution Load Index (PLI) values in oil distribution centers
Figure 10. Frequency distribution of the values of the Geoaccumulation Index (Igeo) in oil warehouses
Figure 11. Frequency distribution of the Geoaccumulation Index (Igeo) values in oil distribution centers
Table 11. Values of the Geoaccumulation Index (Igeo) in oil warehouses
|
Area |
Code |
Zn |
Co |
Cu |
Pb |
Cd |
Cr |
Fe |
Ni |
|
New Anbar Oil Depot |
M1 |
-1.184 |
0.933 |
-1.97 |
1.526 |
2.536 |
-2.122 |
-2.605 |
-1.763 |
|
M2 |
-1.224 |
0.884 |
-2.257 |
1.785 |
2.312 |
-2.677 |
-2.841 |
-1.502 |
|
|
M3 |
-1.284 |
1.004 |
-2.376 |
1.618 |
2.945 |
-1.477 |
-2.958 |
-3.001 |
|
|
Haditha Oil Depot |
W1 |
-1.353 |
0.956 |
-1.998 |
1.178 |
2.766 |
-2.334 |
-2.183 |
-2.083 |
|
W2 |
-1.353 |
0.956 |
-1.998 |
1.178 |
2.766 |
-2.334 |
-2.183 |
-2.083 |
|
|
W3 |
-1.076 |
1.061 |
-2.32 |
1 |
2.222 |
-2.107 |
-2.123 |
-3.574 |
Table 12. Values of the Geoaccumulation Index (Igeo) in oil distribution centers
|
Area |
Code |
Zn |
Co |
Cu |
Pb |
Cd |
Cr |
Fe |
Ni |
|
Oil Distribution Center, Ramadi |
P1 |
-1.161 |
1.048 |
-1.151 |
1.153 |
2.988 |
-1.457 |
-2.145 |
-2.083 |
|
P2 |
-1.112 |
1.089 |
-2.239 |
1.07 |
2.544 |
-1.818 |
-1.974 |
-2.872 |
|
|
P3 |
-0.998 |
1.127 |
-2.891 |
1.425 |
3.459 |
-1.793 |
-1.796 |
-1.763 |
|
|
Oil Distribution Center, Fallujah |
B1 |
-1.338 |
0.925 |
-2.227 |
2.094 |
2.648 |
-1.987 |
-2.3 |
-2.494 |
|
B2 |
-1.11 |
0.95 |
-0.793 |
1.306 |
4.388 |
-1.762 |
-2.267 |
-1.502 |
|
|
B3 |
-1.298 |
0.963 |
-2.964 |
0.983 |
2.861 |
-1.586 |
-2.534 |
-3.07 |
The purpose of this research was to determine the concentrations of heavy metals and assess their effects on the environment at oil storage facilities and depots and distribution centers in Anbar Governorate, Iraq. Data analysis showed that average concentrations of heavy metals (Ni, Fe, Cr, Cd, Pb, Cu, Co, Zn) in examined sites were higher than background and permissible limit of WHO and USEPA. The results of the Contamination Factor (CF), Pollution Load Index (PLI), and Geoaccumulation Index (Igeo) revealed that the study area was moderately to highly polluted with specific heavy metals, including Cd and Pb.
The study reveals that many human activities particularly those concerning the management of petroleum resources as well as industrial emissions cause soil pollution. The study also highlights the importance of checking pollution, controlling its factors and implementing measures to reduce the effects of heavy metal pollution on the soil and people’s health.
The information collected in this study shall be helpful in conducting future risk analysis, formulation of environmental policies, and effective sustainable urban development in the region. The results obtained in this work can be used in further work on combating and preventing soil pollution and creating more suitable environment for the people living in this area.
Based on the results obtained in this study, we recommend the following:
(1) Conducting an environmental impact assessment for oil facilities before construction.
(2) Adhering to laws, regulations, and specific management systems for oil facilities and their operations.
(3) Executing constant and frequent studies and monitoring to check the environmental condition of oil installations.
(4) Implementing the needed mitigation efforts towards current pollution challenges, but also trying to find reasonable ways to minimize it.
(5) Utilizing the finalized data of this research as a profound scientific reference to be explored by later studies.
(6) Putting a state of laws into practice, regulations and management rules of oil facilities.
(7) Continuous information received and collected to check the environmental conditions of the oil facilities.
(8) Funding of the activities of the environmental centers to conduct routine and continuous assessment of the status of oil facilities as per the environmental regulations to find out about environmental developments in the area.
We sincerely thank the Radiation Protection Center in Baghdad, Iraq, for their invaluable guidance and support. Their contributions, including radiation measurements and analysis, were essential to our study’s success. We appreciate their dedication to advancing knowledge in radiation protection.
[1] AL-Heety, L.F., Hasan, O.M., Al-Heety, E.A.M.S. (2021). Heavy metal pollution and ecological risk assessment in soils adjacent to electrical generators in Ramadi City, Iraq. Iraqi Journal of Science, 62(4): 1077-1087. https://doi.org/10.24996/ijs.2021.62.4.4
[2] Artiola, J.F., Walworth, J.L., Musil, S.A., Crimmins, M.A. (2019). Soil and land pollution. In Environmental and Pollution Science. Academic Press, pp. 219-235.
[3] Jahandari, A. (2020). Pollution status and human health risk assessments of selected heavy metals in urban dust of 16 cities in Iran. Environmental Science and Pollution Research, 27(18): 23094-23107. https://doi.org/10.1007/s11356-020-08585-8
[4] Herath, D., Pitawala, A., Gunatilake, J., Iqbal, M.C.M. (2018). Using multiple methods to assess heavy metal pollution in an urban city. Environmental Monitoring and Assessment, 190: 1-15. https://doi.org/10.1007/s10661-018-7016-5
[5] Roberts, S., Gunn, G. (2014). Cobalt. In Critical Metals Handbook. Wiley: Online Library. pp. 122-149.
[6] Alomary, A.A., Belhadj, S. (2007). Determination of heavy metals (Cd, Cr, Cu, Fe, Ni, Pb, Zn) by ICP-OES and their speciation in Algerian Mediterranean Sea sediments after a five-stage sequential extraction procedure. Environmental Monitoring and Assessment, 135: 265-280. https://doi.org/10.1007/s10661-007-9648-8
[7] De Vivo, B., Lima, A., Bove, M.A., Albanese, S., Cicchella, D., Sabatini, G., Di Lella, L.A., Protano, G., Riccobono, F., Frizzo, P., Raccagni, L. (2008). Environmental geochemical maps of Italy from the FOREGS database. Geochemistry: Exploration, Environment, Analysis, 8(3-4): 3-4. https://doi.org/10.1144/1467-7873/08-175
[8] Plum, L.M., Rink, L., Haase, H. (2010). The essential toxin: Impact of zinc on human health. International Journal of Environmental Research and Public Health, 7(4): 1342-1365. https://doi.org/10.3390/ijerph7041342
[9] Khalili, R., Zali, A., Motaghi, H. (2021). Evaluating the heavy metals in the water and sediments of Haraz River, using pollution load index (PLI) and geo accumulation index (Igeo). Iranian Journal of Soil and Water Research, 52(4): 933-942. https://doi.org/10.22059/ijswr.2021.316080.668850
[10] Nannoni, F., Protano, G., Riccobono, F. (2011). Fractionation and geochemical mobility of heavy elements in soils of a mining area in northern Kosovo. Geoderma, 161(1-2): 63-73. https://doi.org/10.1016/j.geoderma.2010.12.008
[11] Han, X.F., Lu, X.W., Zhang, Q.H., Wuyuntana, Hai, Q.S., Pan, H.Y. (2016). Grain-size distribution and contamination characteristics of heavy metal in street dust of Baotou, China. Environmental Earth Sciences, 75: 1-10. https://doi.org/10.1007/s12665-016-5316-z
[12] Kumar, A., Cabral-Pinto, M.M.S., Chaturvedi, A.K., Shabnam, A.A., Subrahmanyam, G., Mondal, R., Gupta, D.K., Malyan, S.K., Yadav, K.K. (2020). Lead toxicity: Health hazards, influence on food chain, and sustainable remediation approaches. International Journal of Environmental Research and Public Health, 17(7): 2179. https://doi.org/10.3390/ijerph17072179
[13] Brown, P.H. (2016). Nickel. In Handbook of Plant Nutrition. CRC Press, Boca Raton, America. pp. 411-426.
[14] Pyle, G., Couture, P. (2011). Nickel. In Homeostasis and Toxicology of Essential Metals. Academic Press, pp. 253-289.
[15] Mason, L.H., Harp, J.P., Han, D.Y. (2014). Pb neurotoxicity: Neuropsychological effects of lead toxicity. BioMed Research International, 2014(1): 840547. https://doi.org/10.1155/2014/840547
[16] Zannoni, D., Valotto, G., Visin, F., Rampazzo, G. (2016). Sources and distribution of tracer elements in road dust: The Venice mainland case of study. Journal of Geochemical Exploration, 166: 64-72. https://doi.org/10.1016/j.gexplo.2016.04.007
[17] Aubert, H., Pinta, M. (1980). Trace Elements in Soils. Elsevier, Amsterdam, Netherlands.
[18] Rabee, A.M., Al-Fatlawy, Y.F., Nameer, M. (2011). Using Pollution Load Index (PLI) and Geoaccumulation Index (I-Geo) for the assessment of heavy metals pollution in Tigris river sediment in Baghdad Region. Journal of Al-Nahrain University, 14(4): 108-114. https://doi.org/10.22401/JNUS.14.4.14
[19] Al-Sheraefy, R.M., Al-Mallah, A.Y., Hussien, A.K. (2023). Spatial distribution of heavy metals in the soil of different area at right bank in Mosul City, Iraq: Part 1. The Iraqi Geological Journal, 56(1C): 40-61. https://doi.org/10.46717/igj.56.1C.4ms-2023-3-15
[20] Al-Sheraefy, R.M., Al-Mallah, A.Y. (2023). Spatial distribution of heavy metals in the soil of different area at left bank in Mosul City, Iraq: Part 2. Iraqi National Journal of Earth Science (INJES), 23(1): 132-153. https://doi.org/10.33899/earth.2023.139066.1061
[21] Waida, J., Rilwan, U., Ismail, W.O., Yusuff, I.M., Sunday, B.I. (2022). Pollution load index of heavy metals resulting from mining activities in Plateau State, Nigeria. Journal of Radiation and Nuclear Applications, 7(3): 57-18. https://doi.org/10.18576/jrna/070310
[22] Nasir, M.J., Wahab, A., Ayaz, T., Khan, S., Khan, A.Z., Lei, M. (2023). Assessment of heavy metal pollution using contamination factor, pollution load index, and Geoaccumulation Index in Kalpani River sediments, Pakistan. Arabian Journal of Geosciences, 16(2): 143. https://doi.org/10.1007/s12517-023-11231-5
[23] Polovnikova, E.S., Kyarova, M.A., Gazukina, Y.G. (2022). Assessment of the industrial impact on the environment. In Geo-Economy of the Future: Sustainable Agriculture and Alternative Energy. Springer International Publishing, Cham, pp. 189-196. https://doi.org/10.1007/978-3-030-92303-7_21
[24] Martin, J.M., Meybeck, M. (1979). Elemental mass-balance of material carried by major world rivers. Marine Chemistry, 7(3): 173-206. https://doi.org/10.1016/0304-4203(79)90039-2
[25] Xu, C.Y., Lu, X.Z, Huang, C.L., Sun, R., Gu, A.Q., Pan, W.F., He, L., Bao, J.Y., Zou, R.S., Fu, C., Cai, Z.H. (2023). Positive matrix factorization as source apportionment of paddy soil heavy metals in black shale areas in Western Zhejiang Province, China. Sustainability, 15(5): 4547. https://doi.org/10.3390/su15054547
[26] Zhang, Q., Wang, C. (2020). Natural and human factors affect the distribution of soil heavy metal pollution: A review. Water, Air, & Soil Pollution, 231: 1-13. https://doi.org/10.1007/s11270-020-04728-2
[27] Aradhi, K.K., Dasari, B.M., Banothu, D., Manavalan, S. (2023). Spatial distribution, sources and health risk assessment of heavy metals in topsoil around oil and natural gas drilling sites, Andhra Pradesh, India. Scientific Reports, 13(1): 10614. https://doi.org/10.1038/s41598-023-36580-9
[28] Parvizimosaed, H., Sobhan, A.S., Merrikhpour, H., Farmany, A., Cheraghi, M., Ashorlo, S. (2015). The effect of urban fuel stations on soil contamination with petroleum hydrocarbons. Iranian Journal of Toxicology, 9(30): 1378-1384. https://www.sid.ir/paper/324421/en.
[29] Meshabaz, R.A., Umer, M.I. (2022). Assessment of industrial effluent impacts on soil physiochemical properties in Kwashe Industrial Area, Iraq Kurdistan Region. In IOP Conference Series: Earth and Environmental Science, 1120(1): 012037. https://doi.org/10.1088/1755-1315/1120/1/012037
[30] Kuklová, M., Kukla, J., Hniličková, H., Hnilička, F., Pivková, I. (2022). Impact of car traffic on metal accumulation in soils and plants growing close to a motorway (Eastern Slovakia). Toxics, 10(4): 183. https://doi.org/10.3390/toxics10040183
[31] Angon, P.B., Islam, M.S., Kc, S., Das, A., Anjum, N., Poudel, A., Suchi, S.A. (2024). Sources, effects and present perspectives of heavy metals contamination: Soil, plants and human food chain. Heliyon, 10(7), e28357. https://doi.org/10.1016/j.heliyon.2024.e28357
[32] Weber, H., Sciubba, J.D. (2019). The effect of population growth on the environment: Evidence from European regions. European Journal of Population, 35: 379-402. https://doi.org/10.1007/s10680-018-9486-0