Oscar Umwanzisiwemuremyi![]() | Zaenal Abidin*
| Zaenal Abidin*![]() | Yudi Setiawan
| Yudi Setiawan![]()
© 2024 The authors. This article is published by IIETA and is licensed under the CC BY 4.0 license (http://creativecommons.org/licenses/by/4.0/).
OPEN ACCESS
Plastic has become essential to our daily lives due to its use in packaging, construction and other applications. However, plastic pollution has become an urgent global challenge due to inadequate disposal of plastic waste worldwide. Illegal dumping, defined as the unauthorized disposal of waste in forests, vacant land, along roadsides, waterways and other areas, continues to exacerbate this issue. The aim of this research was to spatially assess the illegal plastic waste dumping and environmental impacts in the villages of Babakan and Cikarawang in Bogor, Indonesia. We utilized the Avenza Maps application for data collection, along with purposive and Yamane formula sampling, to map factors that lead to illegal dumping. In pursuit of this aim, we employed Geographic Information System technology through Euclidean distance and logistic regression analysis. Our findings reveal that 160 sites were engaged illegal plastic waste dumping, covering areas of 4.244 Km2 in both villages. As a consequence, these villages face water and air pollution, soil contamination, causing flooding and ecosystem disruption, aggravation of climate change, and biodiversity loss. We conclude that plastic waste management laws and regulations need to be strengthened along with the development of waste collection facilities and the promotion of environmentally friendly packaging.
environmental impacts, Geographic Information System (GIS), illegal dumping, plastic pollution, plastic waste
Plastic is an organic polymer composed mainly of carbon and hydrogen produced from fossil fuel chemicals [1]. It has been widely utilized for various purposes in industries, including construction, electronics, packaging, and other household appliances [2]. In 1970, plastic products were not yet widespread, and according to the United Nations Environment Programme (UNEP), the resulting waste was relatively manageable [3].
However, the impact of the modern industrial revolution has led to significant increases in plastic production. UNEP reported that around 76% of 9.2 billion tons of plastic produced from 1950 to 2017 have become waste [4]. In recent data this equates to as much as 450 million tons per year in 2019, as determined in our world data report [5], driven by high demand, ease and low cost, and fast growth of businesses relying on it. The future burden is expected to reach 550 million metric tons by 2025, according to Plastic Atlas Asia 2021 [6].
Thus, unfortunately, the widespread use of plastic products without adequate consideration of their potential impacts on ecosystems has resulted in a pressing global issue in environmental health [7]. The implications for the developing world are especially concerning.
Indonesia is ranked as the fourth most populous country in the world, with a population of 275 million [8]. Its demand for plastic is high, leading to an annual production of about 7.8 million tons of plastic waste. Unpleasantly, nearly 4.9 million of this waste is not handled correctly, primarily due to illegal dumping, transportation spills and landfill practices [9].
Coupled with these factors that developed Western nations use Indonesia as a dumping ground for plastic waste [6], further aggravating the issues of plastic waste mismanagement in the country.
Despite numerous research efforts and reports from renowned organizations such as UNEP and the World Bank, the plastic waste problem continues to escalate. Beyond that, plastic has created global challenges as offshore plastic waste migrates from one country to another via water currents [10]. As a matter of fact, many researchers attribute this issue to imperfect waste management and recycling policies.
In spite of that, certain countries such as Germany and Japan have succeeded in waste management through strict regulations, policies and other innovative solutions [11-13]. Similarly, Rwanda become among the most environmentally clean nations by enforcing waste regulations, banning plastic bags in 2008 and other forms of single-use plastic in 2019 [14, 15].
In contrast, countries such as Indonesia encounter difficulties in imposing laws and regulations, establishing adequate plastic waste facilities in communities, and grappling with other factors contributing to illegal plastic waste dumping. In fact, Indonesia has emerged as the second largest plastic polluter, following China [16]. Consequently, illegally dumped plastic waste can be observed in various locations throughout the country, as we seek to emphasize in this article.
Given that comprehensive research combining Geographic Information System (GIS) technology and local context is lacking, particularly in understanding the spatial distribution and environmental consequences of illegal plastic waste dumping in Indonesia, specifically in regions like Bogor, we embarked on this study.
Here, we aimed to assess the spatial distribution and environmental impacts of illegal plastic waste dumping in Babakan and Cikarawang villages in Bogor using GIS technology. Furthermore, this research intended to raise awareness about the severity of the situation, advocating for strict enforcement of laws and regulations related to plastic waste management. We hope that our findings will provide insights for policymakers, business owners, local leaders and other stakeholders about the urgent need for effective waste management and development of targeted strategies to mitigate the plastic pollution in these villages and protect environment and public health.
2.1 Study area
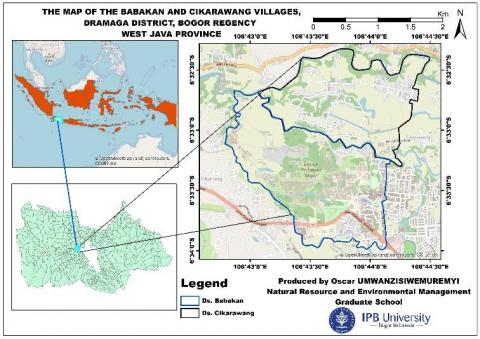
This study was carried out between May and October 2023 in the villages of Babakan and Cikarawang situated within Dramaga district, Bogor regency, West Java in Indonesia, as shown in Figure 1. Bogor regency, which includes these villages, is situated within metropolitan area of Jakarta, the capital of Indonesia, resulting in increased population density and prevalence of urban development. In a fact, Cikarawang has an area of 2.22 Km2 and a population of 9,588 people, consisting of 4,957 men and 4,631 women with a total of 2,504 family heads in 2022, while 32,2% of these families living in poverty [17]. The local economy revolves around agriculture, fishery, commerce and small-scale industries. Similarly, Babakan covers an area of 3.34 Km2 and has a population of 7,933 consisting of 4,028 men and 3,905 women, with a total of 2,521 family heads in 2022 [18]. In addition, it is considered as an urban area dominated by services industries such higher education, trade agriculture and fishing. The natural resources of these villages include forests, wetlands, agricultural land, lakes and rivers. Additionally, these villages accommodate over 20,000 students and staff of Bogor Agricultural University (IPB University) located in Babakan village. While the university manages waste generated within its disposal site, residents dispose of their waste in local landfills, later transported to the Galuga final disposal site (TPA) for a fee ranging from 5,000 to 20,000 IDR (Indonesia rupiah). However, both villages lack adequate waste infrastructure, leading residents to resort waste to open burning and illegal dumping predominated by plastic waste in the vacant lots, forest and waterways, exacerbating plastic pollution.
Figure 1. Study area map
2.2 Data collection by Avenza maps application
The ongoing technological revolution has engendered several new mapping applications that have saved significant time and improved the accuracy of analyses such as those undertaken here. One is the Avenza Maps application, developed in 2010 by Avenza Systems Inc in Toronto, Canada. It is designed for various outdoor activities such as hiking, cycling, camping and other field work [19].
A significant number of studies have proved that Avenza Maps is an adaptive tool that can be used not only for offline mapping but also for capturing geocoordinate images suitable for forest management, fire monitoring, peatland mapping, landslide assessment, and more [20-24]. In this study, a resembling approach was used to map illegal dumping sites with their corresponding images in the area of interest using various data detailed in Table 1 and tools, including DIVA-GIS, Badan Informasi Geospasial (BIG), Google Earth, OpenStreetMap, Google Earth Pro, Global Positioning System (GPS) and ArcGIS 10.8 software (see below). The resulting map was exported in portable document format (PDF).
Afterwards, the Avenza Maps application was downloaded from the Play Store and installed on a mobile phone. The generated PDF map of the study area was imported into the Avenza Maps application. Thenceforth, we began searching both hotspots containing illegal plastic waste dumping and points where such activities did not occur. Additionally, the application facilitated us to capture images at precise coordinates, enabling the accurate identification of illegal plastic waste dumping localities. The data were exported as a Keyhole Markup Language (KML) for deeper analysis in ArcGIS 10.8.
2.3 Purposive sampling
The purposive sampling method is a qualitative technique used to collect data when dealing with large populations and limited resources [25]. For this reason, we adopted this method utilizing the data provided by the leaders of the respective villages, Babakan having 2,521 whilst Cikarawang having 2,504 families in 2022. Since the total of 5025 households is below 10,000 population, we applied an alternative sample size formula in accordance with that described by Israel [26]. Furthermore, for determining the appropriate sample size, the research utilized the Taro Yamane formula, as it is widely applied for calculating sample size in research endeavours, especially in the context of surveys or questionnaires [27].
$n=\frac{N}{1+N{{e}^{2}}}$ (1)
Then, given that n is the required sample size, N is the population understudy (5,025), e is 5% at the confidence level of 95%, thus Eq. (1) becomes:
$n=\frac{5.025}{1+5.025\left( 0.05\times 0.05 \right)}=398.01\approx 398$
Hence, considering the constraints of time and limited resources, it is possible to decrease the sample size to a smaller subset of 15.3%, which equates to 61 participants, as suggested by Swaleh et al. [28]. Likewise, these participants were selected based on the criteria that they were aged 18 or older and from different families, as it was assumed that every selected member possesses knowledge about the plastic waste scenarios in their family and local area.
2.4 Data processing by Geographic Information System
Geographic Information System (GIS) is a technology used to manage and analyse spatial data, providing a means to visualize and understand complex relationships between different geographic elements. GIS has many applications, including environmental management, engineering, science, health, spatial, disaster, agriculture and others [29]. It allows its users to collect, analyse and model data, making it an invaluable tool for decision-makers in various fields [30].
In recent years, GIS has been increasingly utilised to address waste management problems, including illegal waste dumping [31, 32]. The same technology was used in this study, starting with exporting data collected through Avenza Maps as a Keyhole Markup Language (KML) file, viewed in Google Earth Pro. This KLM file was further converted into a zip compressed KML (KMZ) format in ArcGIS 10.8 software [33]. After we have used this software to for raster analysis through Euclidian distance to generate distance to the river, roads and settlements, image analysis for NDVI, and raster analysis for DEM and slope using data sources listed in Table 1, followed by merging all data sets formed to create a comprehensive map of illegal plastic waste dumping hotspots and trends within the study area.
2.5 Data analysis and data source
The distance from hotspots to various factors such as roads, water and settlements was determined by employing the Euclidian distance formula that Alexis Clairaut discovered in 1731, but it was updated by Herman Minkowski [34]. If P (x1, y2) and Q (x2, y2) are points in the plane, the Euclidean distance final formula (D) between P and Q would be:
D=$\sqrt{{{({{x}_{1}}-{{x}_{2}})}^{2}}+{{({{y}_{1}}-{{y}_{2}})}^{2}}}$ (2)
This formula was used by Aderoju et al. [35] in Nigeria to evaluate potential sites for landfill, taking into account several criteria, including distance to water bodies, roads and built-up areas in ArcGIS. Their results showed that landfills should be located at least 800 meters from residential areas and 1000 meters from water bodies to mitigate health and environmental risks [35].
In this manner, the Euclidean distance Eq. (2) was used in ArcGIS 10.8 to determine the distance from illegal dumping of plastic waste to the roads, waterways, and built-up areas and create a map indicating these parameters. Additionally, the data provided in Table 1 were utilised to conduct extra GIS analysis, generating a visual representation of unauthorised plastic waste dumping sites.
Table 1. Data types and sources that were used in this study
|
Data |
Type |
Source |
|
Study area map |
Shapefile |
[36] |
|
Interviews |
Answers |
Interviewees |
|
Hotspots of illegal plastic dumping |
Points |
Site mapping with Avenza |
|
Plastic waste dumping-free area |
Points |
Site mapping with Avenza |
|
Distance to roads |
Raster |
[36] |
|
Distance to rivers |
Raster |
[36] |
|
Distance to settlements |
Raster |
[36] |
|
DEM |
Raster |
[37] |
|
Slope |
Raster |
[37] |
|
NDVI |
Raster |
[38] |
Finally, logistic regression was applied to model the illegal plastic waste hotspots with the distance to the road, river, and settlements combined with normalized difference vegetation index (NDVI), slope and digital elevation model (DEM). These outcomes served as the basis for estimating the probability of illegal plastic waste, such that 0 to 0.5 assumes that no plastic waste is being dumped, while 0.5 to 1 expresses the likelihood that illegal plastic waste was occurring. In this way, the probability range was obtained with the help of Eq. (3).
${{P}_{r}}=\frac{{{e}^{Y}}}{1+{{e}^{Y}}}$ (3)
whereby, Y = a + b1X1+b2X2+b3X3+bnXn+ ε.
Figure 2. Methodology flowchart
Y is defined as dependent variable (illegal plastic waste dumping) a is a constant coefficient and b1, b2, b3, bn are regression coefficients X1, X2, X3, Xn are independent variables (distance to roads, rivers, settlements, and Slope, NDVI, and DEM) Ε is error.
The findings were then run in ArcGIS 10.8 for extended analysis and formed the foundation for discussion and recommendations. Figure 2 provides a summary of the steps used throughout this research.
3.1 Illegal plastic waste dumping
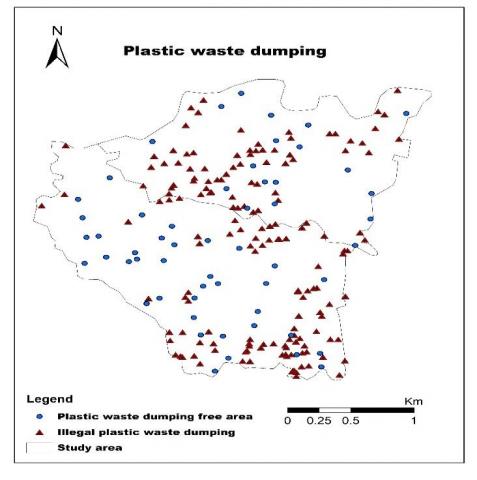
The results of data collection indicated that there were 160 hotspots exhibiting a high incidence of illegal plastic waste deposition within the study area. Additionally, 55 points were identified as illegal plastic waste dumping-free areas, as visually depicted in Figure 3.
Figure 3. Locations with significant illegal plastic waste accumulation and areas free from unauthorized plastic waste disposal
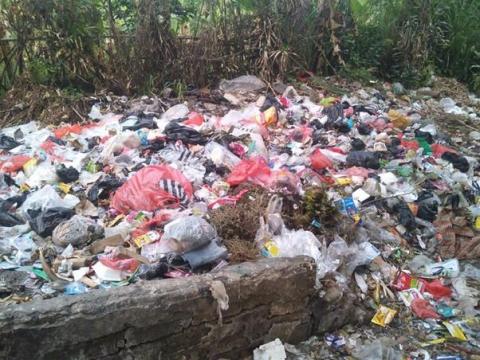
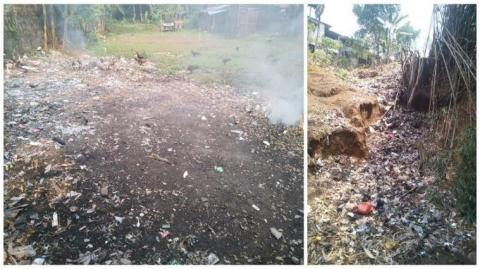
Figure 4. Illegal disposal of plastic waste on unused land in Cikarawang
Study visits to a subset of these hotspots clearly identified plastic waste in vacant land, riverbanks, elevated areas, in proximity to settlements and beside roads in both villages, as illustrated in Figure 4.
3.2 Factors that contribute to unlawful disposal of plastic waste
3.2.1 Waste illegally dumped in Cikarawang and Babakan villages
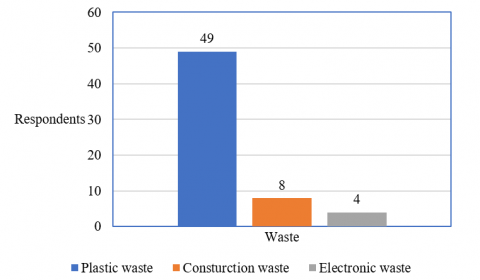
As part of this research, community interviews were conducted to investigate factors that play a part in illegal plastic waste dumping in the area of interest. Among 61 families interviewed, 80.03% mentioned that they frequently encountered illegally dumped plastic waste, while construction waste was less common, and electronic waste was not only occasionally, as illustrated in Figure 5.
Figure 5. Types of waste frequently observed illegally dumped in Babakan and Cikarawang
3.2.2 The locations where plastic waste is illegally disposed
Apart from that, 93.4% reported that Cikarawang and Babakan had plastic waste being improperly disposed of in locations other than designated landfills categorized as follows: vacant land enumerated by 41% of participants, rivers and waterways cited by 31.1%, near residential zones acknowledged by 19.7%, and in forest mentioned by 8.2%, as displayed in Figure 6.
Figure 6. Areas of illegal plastic disposal in Babakan and Cikarawang
3.2.3 The causes of illicit plastic waste in Cikarawang and Babakan
The reasons behind the illegal dumping offered by 41% of respondents included the intentional avoidance of disposal fees, a lack of nearby waste collection facilities, as narrated by 36%, and a general lack of awareness about the impact of plastic waste, as mentioned by 23%, as represented in Figure 7.
Figure 7. The reasons for illegal plastic waste disposal in Cikarawang and Babakan
3.3 Modelling the vulnerable zones to illegal plastic waste
3.3.1 Data preprocessing
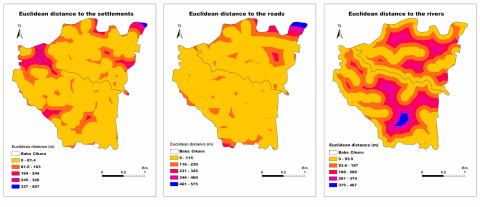
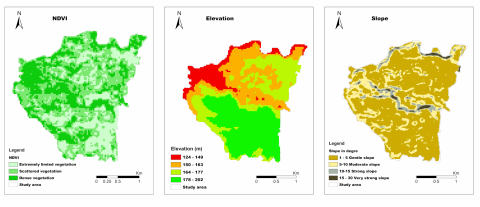
The data collected from the various sources, such as the distances to the rivers, roads and settlements, as well as the NDVI, DEM, and slope data for Cikarwang and Babakan, were preprocessed using ArcGIS 10.8 to serve as a core dataset for modelling the susceptibility of specific areas to illegal plastic waste dumping. The outputs of the data preprocessing are represented in Figure 8 (a) as distance to rivers, roads and settlements, and in Figure 8 (b) NDVI, DEM and Slope.
3.3.2 Logistic regression analysis and validation
Following data preprocessing, the 160 illegal plastic waste hotspots singled out were merged with 55 points recognized as devoid of plastic waste dumping, and all were subject to the six parameters, namely: distance to river (Drive), distance to roads (DRoa), distance to settlements (DSettl), NDVI, elevation (Eleva), and slope. They were extracted through a multivalued points analysis tool in ArcGIS 10.8. Thereafter, these results were studied in linear logistic regression analysis using IBM Statistical Package for the Social Sciences (SPSS) 24 software for model fitting.
The findings stipulated a good fit for a model, as demonstrated by tolerance values exceeding 0.1 (>0.1), and variance inflation factors (VIF0 below 10 (<10)), as predicted in the accompanying Table 2.
Furthermore, all these parameters were utilized in logistic binary regression analysis with backward selection criteria to determine the most suitable inputs for model by Hosmer and Lemeshow test. In so doing, the yield signalled a significance value of 0.576, which exceeds the significance threshold of 0.05 (>0.05). Forthwith, this suggests the feasibility of the model as unveiled in Table 3.
In that bargain, the revealed data variables were applied in a logistic regression to predict illegal dumping areas, as displayed in Table 4.
(a) Euclidean distance results
(b) NDVI, slope and DEM results
Figure 8. Preprocessed datasets for Cikarawang and Babakan
Table 2. The outputs from tests for fitting a model
|
|
B |
Std. Error |
Beta |
|
|
Tolerance |
VIF |
|
Constant |
1.277 |
0.170 |
|
7.520 |
0.000 |
|
|
|
Eleva |
-0.001 |
0.001 |
-0.083 |
-1.329 |
0.185 |
0.905 |
1.105 |
|
DSettl |
-0.003 |
0.001 |
-0.360 |
-5.195 |
0.000 |
0.743 |
1.345 |
|
NDVI |
-0.762 |
0.389 |
-0.132 |
-1.959 |
0.051 |
0.781 |
1.280 |
|
DRive |
-0.001 |
0.000 |
-0.201 |
-3.082 |
0.002 |
0.843 |
1.186 |
|
Slope |
0.019 |
0.009 |
0.135 |
2.117 |
0.035 |
0.880 |
1.137 |
|
DRoa |
-5.550E-5 |
0.000 |
-0.008 |
-0.122 |
0.903 |
0.878 |
1.139 |
Table 3. Findings from tests of Hosmer and Lemeshow
|
Step |
Chi-square |
df |
Sig. |
|
1 |
9.297 |
8 |
0.318 |
|
2 |
11.581 |
8 |
0.171 |
|
3 |
6.643 |
8 |
0.576 |
Table 4. Variables within the equation upon which illegal plastic waste relies
|
|
B |
S.E. |
Wald |
df |
Sig. |
Exp(B) |
|
|
Step 3a |
Eleva |
-0.037 |
0.015 |
5.779 |
1 |
0.016 |
0.964 |
|
DSettl |
-0.019 |
0.004 |
19.747 |
1 |
0.000 |
0.981 |
|
|
NDVI |
-5.477 |
2.957 |
3.431 |
1 |
0.064 |
0.004 |
|
|
DRive |
-0.005 |
0.002 |
6.009 |
1 |
0.014 |
0.995 |
|
|
Constant |
9.999 |
2.729 |
13.428 |
1 |
0.000 |
22000.35 |
|
|
a. Variable(s) entered on step 1: Eleva, DSettl, NDVI, DRive, Slope, DRoa |
|||||||
Because of this, the outruns suggest that, according to logistic regression equation Eq. (3), illegal plastic waste dumping (dependent variable) is contingent upon elevation, distance to the rivers and settlements, and NDVI (independent variables). In a consequence of this, the equation can be expressed as follows:
Y = a + Eleva + DSettl + NDVI + DRive
Y = 9.999 - 0.037×Eleva - 0.019xDSettl - 5.477×NDVI - 0.005×DRive
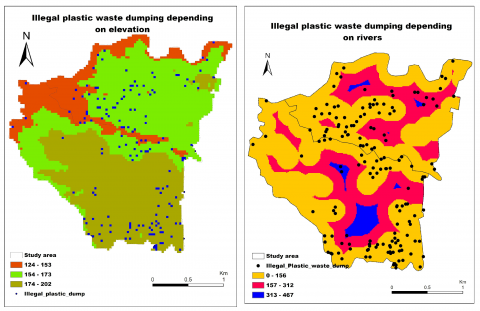
Moreover, by running the datasets of elevation, distance to the rivers and settlements, and NDVI were correlated with plastic waste hotspots in ArcGIS 10.8. The aftereffects revealed among 160 plastic waste hotspots, 13.75% were situated between 124 and 153m, 41.88% in 154 to 173m, while 41.25% were between 174 to 202m above sea level, and 3.12% were unaccounted for. In terms of adjacency to the river, the results indicated that 82.5% were found within distance range from 0 to 156, simultaneously 12.5% were in the midrange of 157 to 312m, and 2.5% were positioned at a distance of 313 to 467m, and with 2.5% categorized as missing data. The river and elevation outputs are showcased in Figure 9.
Figure 9. The occurrence of unauthorized plastic waste based on elevation and distance from rivers
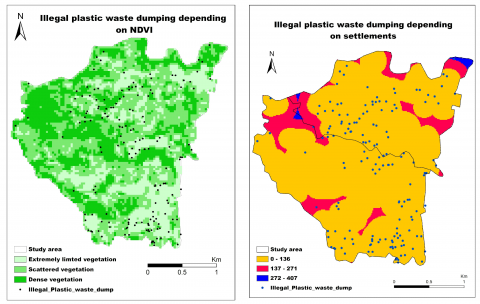
With respect to proximity to the settlements, out of 160 identified hotspots, 95% were found within 0 to 136m, 1.88% were located between 137 and 271m, while 0.62% were situated at 272 to 407m. As an extra factor NDVI, in accordance with the classification provided by Hartoyo et al. [39], NDVI values in the study area were classified as 0.05 to 0.2 as representing extremely limited vegetation, 0.21 to 0.3 indicating scattered vegetation, and 0.31 to 0.42 signifying dense vegetation.
In this regard, the findings evidenced that 31.2% of hotspots were discovered in extremely limited vegetation, 53.7% were detected in scattered vegetation, and 12% were found in dense vegetation areas. The data of illegal plastic waste dumping hotspots alongside the distance to the settlements and NDVI are represented in Figure 10.
Figure 10. The appearance of illegal plastic waste in line with NDVI and distance to settlements
In light of these results, the above four variables were utilized to estimate the probability (P) of susceptibility to illegal plastic waste dumping in Babakan and Cikarawang. Thus, the Eq. (3), can be expressed as follows:
P = (1/ (1+Exp (-((9.999) -(0.037*“Eleva”) – (0.019*“DSettl”) -(5.477*“NDVI”) –(0.005*DRive)))
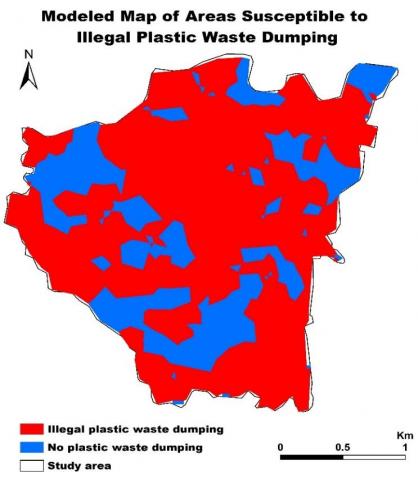
Figure 11. Areas susceptible to illegal disposal of plastic waste
Then, this probability equation was integrated in ArcGIS 10.8 by applying the raster calculator analysis tool to create a model, which was afterwards reclassified into two categories: areas with a probability ranging from 0 to 0.5 were designated as non-plastic waste dumping, whereas those with probability ranging from 0.5 to 1 were classified as areas prone to illegal plastic waste dumping, as visualized in Figure 11.
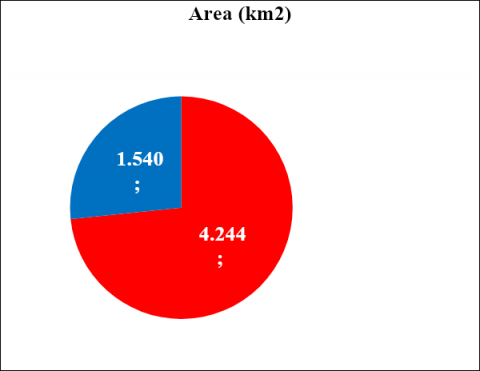
The outcomes from this model indicated that there is an elevated probability of illegal dumping in 6 polygons spanning an area of 4.244 square kilometres (red in Figure 8), whilst 35 polygons with an area of 1.540 square kilometres in both Cikarawang and Babakan (blue in Figure 8) is comparatively less likely to be exposed to illegal dumping as further denoted in Figure 12.
Figure 12. Surfaces areas of likelihood of unlawful disposal of plastic waste (likely in red, unlikely in blue)
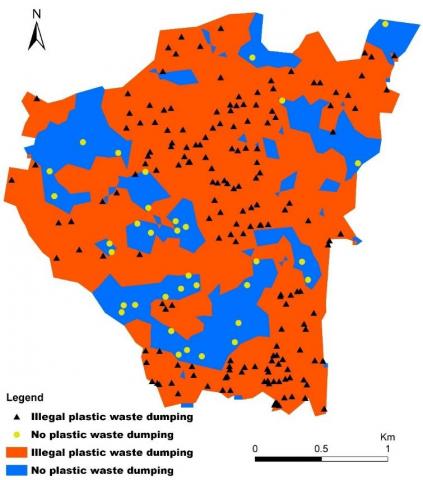
Figure 13. Findings derived model in comparison with collected data
After generating the polygons in ArcGIS 10.8 to represent the areas of highest and lowest risks of illegal plastic waste dumping, these results were verified for accuracy by merging all of the datasets generated by model itself and collected on the field to check if the illegal plastics waste hotspots and non -plastic points waste are matching with the formed polygons of illegal plastic waste dumping and non-illegal plastic waste dumping. The findings of this validation are showcased in Figure 13.
While validation results provide insights into the logistic regression model performance in predicting illegal plastic waste dumping in Cikarawang and Babakan villages, it is vital that we acknowledge the complexity and potential source of bias inherent in the logistic regression analysis. The omitted variables, such as distance to the road and slope, could present challenges in accurately capturing the phenomenon. Additionally, using SPSS, ArcGIS 10.8 software and Avenza Map Application for analysis and data correction might introduce assumptions that could lead to errors. Therefore, while our findings provide valuable information, addressing these challenges in future research efforts is essential to enhance the accuracy and reliability of predictive models for illegal plastic waste dumping.
Nevertheless, our outcomes stemming from our model analysis with respect to the probability of illegal plastic waste dumping, it is clear that the communities in Babakan and Cikarawang are engaged in unlawful disposal of plastic waste, which then accumulates in areas of human settlements and transit routes. Regrettably, this makeshift disposal of plastic waste shines a light on the scope of the problem at hand, which indeed has or will have detrimental effects on both health and the environment, as we discuss below.
3.4 Environmental impacts of illegal plastic waste
3.4.1 Disturbance of vegetation and pollution of soil
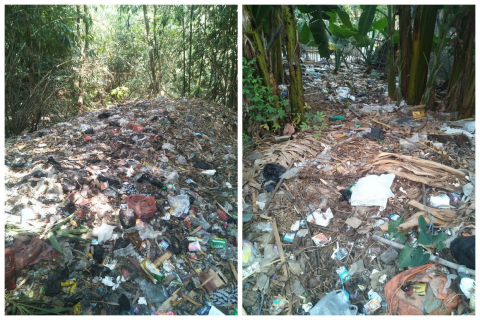
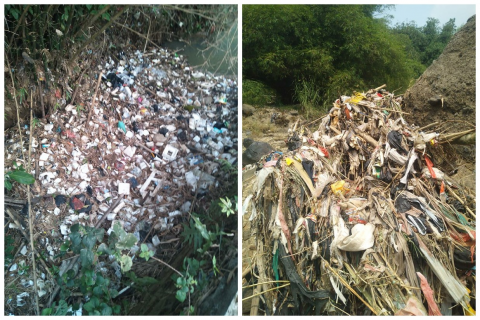
Our findings dramatically confirm our hypothesis that illegal plastic waste dumping is accumulating on the soil surface, as attested in Figure 14. Further, the aggregation of such waste inevitably leads to soil compaction, which hinders water infiltration and air exchange, ultimately rendering the soil infertile and impeding vegetation growth [40]. In turn, poor soil quality has downstream effects on agricultural yields, contributing indirectly to food insecurity [41].
Figure 14. Plastic waste inhibiting the growth of bamboo (left) and other vegetation (right) in Cikarawang
Moreover, when plastic waste is exposed to ultraviolet (UV) radiation from the sun during the process of photodegradation and fragmentation, it generates microplastic containing toxic pollutants [40, 42, 43], that in turn, pose threats to soil microorganisms and other biodiversity, and through inadvertent ingestion of contaminated crops to humans.
3.4.2 Air pollution and climate change
During our data collection phase, we observed that 55 out of 160 registered hotspots, constituting 34%, were engaged in open burning practices on the ground, as illustrated in Figure 15.
Figure 15. The implication of plastic waste burning on the air (left) in Babakan and on biodiversity (right) in Cikarawang
These practices provoke the emission of smoke and unpleasant odours which contain toxic chemicals, including COx, NOx, SO2, O3, NH3, HCN, CH4, dioxins, furans, polycyclic aromatic hydrocarbons (PAHs), formaldehyde, volatile compounds (VOCs), and particulate matter (PM) [44], [45]. In addition, plastic involves the inclusion of traces such as cadmium, chromium, zinc, tin, and others [45].
Residents of Indonesia are well aware of the often poor air quality: data from the air quality index [46] checked on October 11, 2023, showed that Bogor had a value of 150, significantly surpassing the recommended value of 100 set by the United States Environmental Protection Agency (EPA) [47]. On that same day, the concentration of particulate matter with a diameter of 2.5 micrometres (PM2.5) was 55.4 µg/m³, whilst particulate matter with a diameter of 10 micrometres (PM10) was 53.8 µg/m³, both exceeding recommended limits of 15 µg/m³ for PM2.5 and 45 µg/m³ for PM 10 levels [48].
Furthermore, open burning is often conducted close to vegetation, woodland, forest and settlements increasing the risk of fires and other incidents if the flames spread uncontrollably. Additionally, these pollutants arising from unlawful incineration contribute to greenhouse gas emissions in Indonesia and hence to worsening global warming. The country was grappling with an irregular drought condition, indicating an intensifying El Nino phenomenon in 2023 as predicted by the Indonesia Meteorological, Climatological and Geophysical Agency (BMKG) [49]. This has led to heatwaves, irregular rainfalls, flooding, vegetation desiccation, animal fatalities, and water shortages.
3.4.3 Water pollution and ecosystem disruption
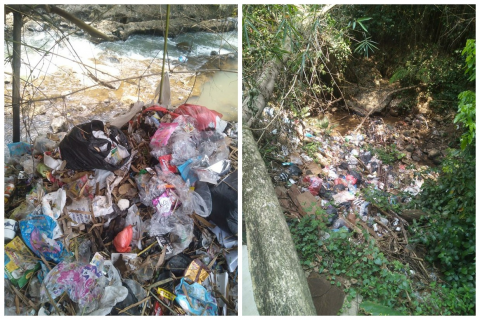
Out of 160 hotspots of illegal waste dumping assessed, 152 (95%) were found at distances of 0 to 312m, and including those that directly discharged into the rivers, as illustrated in Figure 16.
This implies that eventual rainfall will wash such plastics straight into waterways. In turn, it causes water pollution, blocking water channels and rivers, as shown in Figure 17, leading to flooding. Consequently, the water shifts in unpredictable ways, bringing about soil erosion and significant damage to biodiversity, landscape and infrastructure [50].
Figure 16. The deliberate disposal of plastic waste directly into rivers in Babakan
Figure 17. The clogging of waterways with plastic waste in Babakan
In fact, according to the World Bank report, 83% of the yearly plastic waste entering the marine ecosystem is transported by water from land to the rivers. In comparison, the remaining 17% is discharged directly from the coastal zones in Indonesia [9]. Once plastic waste enters the ecosystem, it embarks on a long journey to contaminate groundwater, rivers, lakes and oceans [51].
We emphasize the significant detriment of plastic waste on aquatic ecosystems and all living species relying on water for their survival [52]. This detriment is compounded by the fact that plastic does not naturally decompose but persists for any extended period, ranging from 100 to 500 years, gradually breaking down into microplastics [53]. Such plastic waste and microplastics are prone to entrap or become ingested by fishes, birds, and herbivores, posing risks to themselves, other biotic species and inevitably to humans when consumed as food: this has been shown to directly related to health problems and potential fatalities [54-56]. Finally, the inappropriate disposal of plastic waste in the environment not only degrades the beauty of the landscape but also hampers recreational and other tourist activities, and impacts the local economy by hindering agriculture and livelihood of those relying on these ecosystems for their survival [57, 58].
The study sought to assess illegal plastic waste dumping and its environmental impacts, explicitly using geospatial parameters and locally relevant community input, with the ultimate goal being to shape the current civil policies and engineering priorities in Indonesia to reduce plastic pollution in its villages and surrounding regions. Our findings unveiled that communities engage in illegal plastic waste dumping as a short-term solution because of a lack of collection facilities and insufficient awareness of plastic consequences, but mostly to avoid paying waste collection fees. We strongly advise the pressing needs of policymakers, waste management authorities, local communities, academic institutions, NGOs, and local government officials to collaborate on the development of effective and sustainable plastic waste management solutions. Policymakers must prioritize the development policies that address the specific needs of local communities, focusing on improving infrastructure for waste collection, transportation and disposal. This necessitates increased investment, recycling centres, incentives for plastic waste pickers, and establishing buyback programs in exchange for recyclable materials, cash incentives, or other economic incentives, introducing technology or mobile applications for reporting instances of illegal plastic waste dumping to improve transparency and accountability and provide an incentive for those who will volunteer to report. Specifically, we recommend community engagement through education and awareness campaigns to promote responsible plastic waste disposal practices, reduce littering, and encourage reuse, recycle, and reduce (3R) efforts. Lastly, enforcement of regulations is essential to curb illegal dumping and open burning of plastic waste, with penalties on violators, limiting single-use plastics in local businesses, and promoting environmentally friendly and affordable packaging material.
The authors express gratitude to the University Consortium of Southeast Asian Regional Centre for Graduate Study and Research in Agriculture (SEARCA) for their financial support in conducting this research, as it would not be accomplished without such aid. Professor R. Folkerth assisted in the critical reading of the manuscript.
[1] Gisi, S.D., Gadaleta, G., Gorrasi, G., Mantia, F.P.L., Notarnicola, M., Sorrentino, A. (2022). The role of (bio)degradability on the management of petrochemical and bio-based plastic waste. Journal of Environmental Management, 310: 114769. https://doi.org/10.1016/j.jenvman.2022.114769
[2] Purwiyanto, A.I.S., Prartono, T., Riani, E., Naulita, Y., Cordova, M.R., Koropitan, A.F. (2022). The deposition of atmospheric microplastics in Jakarta-Indonesia: The coastal urban area. Marine Pollution Bulletin, 174: 113195. https://doi.org/10.1016/j.marpolbul.2021.113195
[3] Unep. (2023). Our planet is choking on plastic. https://www.unep.org/interactives/beat-plastic-pollution/, accessed on Dec. 11, 2023.
[4] Marshall, M. (2018). From pollution to solution. In New Scientist, 237(3169): 34-37. https://doi.org/10.1016/S0262-4079(18)30486-X
[5] Ritchie, H., Samborska, V., Max, R. (2023). Plastic Pollution. https://ourworldindata.org/plastic-pollution, accessed Dec. 11, 2023.
[6] Heinrich Boll Stiftung. (2021). Plastic atlas - Facts and figures about the world of synthetic polymers (Asia Edition). In Angewandte Chemie International Edition, 6(11): 951-952.
[7] Maljean-Dubois, S., Mayer, B. (2020). Symposium on global plastic pollution. Liability and compensation for marine plastic pollution: Conceptual issues and possible ways forward. AJIL Unbound, 114: 206-211. https://doi.org/10.1017/aju.2020.40
[8] Badan Pusat Statistik. (2023). Statistical Yearbook of Indonesia 2023.
[9] World Bank. (2021). Plastic Waste Discharges from Rivers and Coastlines in Indonesia. Marine Plastics Series, East Asia and Pacific Region. In World Bank Publications. https://doi.org/10.1596/35607
[10] Unep. (2022). Pastic pollution science. United Nations Environment Programme. https://wedocs.unep.org/bitstream/handle/20.500.11822/41263/Plastic_Science_E.pdf.
[11] Plastic Atlas Asia. (2022). Challenges and Efforts in Japan Japan’s Plastic Waste Management – Challenges.
[12] Carmichael, R. (2021). Plastics Management Index Plastics Management Index Evaluating effective management and sustainable use of plastics Plastics Management Index.
[13] Ramasubramanian, B., Tan, J., Chellappan, V., Ramakrishna, S. (2023). Recent advances in extended producer responsibility initiatives for plastic waste management in Germany and UK. Materials Circular Economy, 5: 6. https://doi.org/10.1007/s42824-023-00076-8
[14] Xie, J., Martin, J. (2022). Plastic waste management in Rwanda: An ex-post policy analysis. World Bank, Washington, DC. http://hdl.handle.net/10986/37607.
[15] Carron, B., Muys, B., Orshoven, J.V., Leinfelder, H. (2021). Landscape design to meet the societal demand for ecosystem services: A perspective. Challenges in Sustainability, 9(1): 28-44. https://doi.org/10.12924/cis2021.09010028
[16] Ministry of Environment and Forestry. (2020). National Plastic Waste Reduction Strategic Actions for Indonesia. Ministry of Environment and Forestry, Republic of Indonesia, 1-46.
[17] Kecamatan Dramaga. (2019). Profil Desa Cikarawang. https://kecamatandramaga.bogorkab.go.id/desa/61, accessed Oct. 27, 2023.
[18] Kecamatan Dramaga. (2019). Profil Desa BaBabakan. https://kecamatandramaga.bogorkab.go.id/desa/60, accessed Oct. 27, 2023.
[19] Avenza Systems Inc. (2023). Avenza systems map and cartography tools. https://www.avenza.com/, accessed Oct. 25, 2023.
[20] Permadi, M.G., Jamaludin, Parjono, Sapsal, M.T. (2019). Implementation of the SMORPH method for mapping the susceptibility area of landslide in Bogor City. IOP Conference Series: Earth and Environmental Science, 343(1): 012195. https://doi.org/10.1088/1755-1315/343/1/012195
[21] Fagundes, G.M. (2021). Fuel maps: Digitizing grass and sensing fire in Brazil. https://aesengagement.wordpress.com/2021/12/21/fuel-maps-digitizing-grass-and-sensing-fire-in-brazil/.
[22] Christensen, B., Herries, D., Hartley, R.J.L., Parker, R. (2021). UAS and smartphone integration at wildfire management in Aotearoa New Zealand. New Zealand Journal of Forestry Science, 51(2). https://doi.org/10.33494/nzjfs512021x127x
[23] Bowering, R., Wigle, R., Padgett, T., Adams, B., Cote, D., Wiersma, Y.F. (2018). Searching for rare species: A comparison of Floristic Habitat Sampling and Adaptive Cluster Sampling for detecting and estimating abundance. Forest Ecology and Management, 407: 1-8. https://doi.org/10.1016/j.foreco.2017.10.016
[24] Anda, M., Ritung, S., Suryani, E., Sukarman, Hikmat, M., Yatno, E., Mulyani, A., Subandiono, R.E., Suratman, Husnain. (2021). Revisiting tropical peatlands in Indonesia: Semi-detailed mapping, extent and depth distribution assessment. Geoderma, 402: 115235. https://doi.org/10.1016/j.geoderma.2021.115235
[25] Palinkas, L.A., Horwitz, S.M., Green, C.A., Wisdom, J.P., Duan, N., Hoagwood, K. (2015). Purposeful sampling for qualitative data collection and analysis in mixed method implementation research HHS public access. Administration and Policy in Mental Health and Mental Health Services Research, 42: 533-544. https://doi.org/10.1007/s10488-013-0528-y
[26] Israel, G.D. (2013). Determining Sample Size 1. https://Edis.Ifas.Ufl.Edu/, 6, 1-5. http://edis.ifas.ufl.edu, accessed on Oct. 08, 2023.
[27] Naing, N.N. (2003). Determination of sample size. Malaysian Journal of Medical Sciences, 10(2): 84-86.
[28] Swaleh, C.W., Ombui, D.K., Kagiri, D.A. (2015). Influence of service delivery strategies on customer satisfaction at the British high commission in Kenya. International Journal of Scientific and Research Publications, 5(9): 1-13. https://www.ijsrp.org/research-paper-0915/ijsrp-p45134.pdf.
[29] Mussa, A., Suryabhagavan, K.V. (2021). Solid waste dumping site selection using GIS-based multi-criteria spatial modeling: a case study in logia town, afar region, Ethiopia. Geology, Ecology, and Landscapes, 5(3): 186-198. https://doi.org/10.1080/24749508.2019.1703311
[30] Lega, M., Persechino, G. (2014). GIS and infrared aerial view: Advanced tools for the early detection of environmental violations. WIT Transactions on Ecology and the Environment, 180: 225-235. http://doi.org/10.2495/WM140191
[31] Paunovic, S., Krstic, F. (2014). GIS application in the spatial analysis of illegal landfills in big cities: A case study of Belgrade. Glasnik Srpskog Geografskog Drustva, 94(3): 41-54. https://doi.org/10.2298/gsgd140815006p
[32] Höflinger, S., Antwi, M., Amprofi, A.A., Kabo-Bah, A.T. (2020). Spatial identification of potential dump disposal sites for effective waste management in the Sunyani municipality, Ghana. Journal of Geoscience and Environment Protection, 8(11): 93-111. https://doi.org/10.4236/gep.2020.811005
[33] Vambol, S., Vambol, V., Sundararajan, M., Ansari, I. (2019). The nature and detection of unauthorized waste dump sites using remote sensing. Ecological Questions, 30(3): 43-55. https://doi.org/10.12775/EQ.2019.018
[34] Barnett, R.A., Ziegler, M.R., Byleen, K.E. (2014). Finite Mathematics for Business, Economics, Life Sciences and Social Sciences Plus NEW MyLab Math with Pearson E-Text - Access Card Package. Pearson. https://www.amazon.com/Mathematics-Business-Economics-Sciences-Pearson/dp/0321947622.
[35] Aderoju, O.M., Dias, G.A., Gonçalves, A.J. (2020). A GIS-based analysis for sanitary landfill sites in Abuja, Nigeria. Environment, Development and Sustainability, 22: 551-574. https://doi.org/10.1007/s10668-018-0206-z
[36] Badan Informasi Geospasia. (2017). Indonesia Geospatial Portal. https://tanahair.indonesia.go.id/portal-web,accessed May. 01, 2023.
[37] United States Geological Survey. (2014). SRTM 1 Arc-second Global. https://earthexplorer.usgs.gov/, accessed Sep. 25, 2023.
[38] United States Geological Survey. (2023). Landsat Collection 2 Level-2 (Landsat 8-9 OLIT/TIRS C2L2). https://earthexplorer.usgs.gov/, accessed Sep. 25, 2023.
[39] Hartoyo, A.P.P., Pamoengkas, P., Mudzaky, R.H., Khairunnisa, S., Ramadhi, A., Munawir, A., Komarudin, K., Hidayati, S., Sunkar, A. (2022). Estimation of vegetation cover changes using normalized difference vegetation index (NDVI) in Mount Halimun Salak National Park, Indonesia. IOP Conference Series: Earth and Environmental Science, 1109: 012068. https://doi.org/10.1088/1755-1315/1109/1/012068
[40] Kibria, M.G., Masuk, N.I., Safayet, R., Nguyen, H.Q., Mourshed, M. (2023). Plastic waste: Challenges and opportunities to mitigate pollution and effective management. International Journal of Environmental Research, 17: 20. https://doi.org/10.1007/s41742-023-00507-z
[41] Sa’adu, I., Farsang, A. (2023). Plastic contamination in agricultural soils: A review. Environmental Sciences Europe, 35: 13. https://doi.org/10.1186/s12302-023-00720-9
[42] Andrady, A.L., Heikkilä, A.M., Pandey, K.K., Bruckman, L.S., White, C.C., Zhu, M., Zhu, L. (2023). Effects of UV radiation on natural and synthetic materials. Photochemical and Photobiological Sciences, 22: 1177-1202. https://doi.org/10.1007/s43630-023-00377-6
[43] Andrady, A.L., Barnes, P.W., Bornman, J.F., Gouin, T., Madronich, S., White, C.C., Zepp, R.G., Jansen, M.A.K. (2022). Oxidation and fragmentation of plastics in a changing environment; from UV-radiation to biological degradation. Science of the Total Environment, 851(2): 158022. https://doi.org/10.1016/j.scitotenv.2022.158022
[44] Pathak, G., Nichter, M., Hardon, A., Moyer, E., Latkar, A., Simbaya, J., Pakasi, D., Taqueban, E., Love, J. (2023). Plastic pollution and the open burning of plastic wastes. Global Environmental Change, 80: 102648. https://doi.org/10.1016/j.gloenvcha.2023.102648
[45] Velis, C.A., Cook, E. (2021). Mismanagement of plastic waste through open burning with emphasis on the global south: A systematic review of risks to occupational and public health. Environmental Science and Technology, 55(11): 7186-7207. https://doi.org/10.1021/acs.est.0c08536
[46] Iqair. (2023). Indeks Kualitas Udara (AQI) Kota Bogor dan Polusi Udara di Indonesia | IQAir. https://www.iqair.com/id/indonesia/west-java/bogor, accessed Oct. 11, 2023.
[47] Ekstrom, J.A., Bedsworth, L. (2018). Adapting air quality management for a changing climate: Survey of local districts in California. Journal of the Air and Waste Management Association, 68(9): 931-944. https://doi.org/10.1080/10962247.2018.1459325
[48] World Health Organization. (2021). WHO global air quality guidelines. Particulate Matter (PM2.5 and PM10), Ozone, Nitrogen Dioxide, Sulfur Dioxide and Carbon Monoxide, 1-360.
[49] Nti, E.K., Wongnaa, C.A., Edusah, N.S.E., Awunyo-vitor, D., Kyei, V.B. (2021). Towards financial sustainability: Beneficiaries’ perception and performance of community water supply services in Ghana. Challenges in Sustainability, 9(1): 45-58. https://doi.org/10.12924/cis2021.09010045
[50] Sakti, A.D., Rinasti, A.N., Agustina, E., Diastomo, H., Muhammad, F., Anna, Z., Wikantika, K. (2021). Multi-scenario model of plastic waste accumulation potential in Indonesia using integrated remote sensing, statistic and socio-demographic data. ISPRS International Journal of Geo-Information, 10(7): 481. https://doi.org/10.3390/ijgi10070481
[51] Emmerik, T.V., Mellink, Y., Hauk, R., Waldschläger, K., Schreyers, L. (2022). Rivers as plastic reservoirs. Environmental Water Quality, 3: 1-8. https://doi.org/10.3389/frwa.2021.786936
[52] Mrowiec, B. (2017). Plastic pollutants in water environment. Environmental Protection and Natural Resources, 28(4): 51-55. https://doi.org/10.1515/oszn-2017-0030
[53] Abreu, A., Pedrotti, M.L. (2019). Microplastics in the oceans: The solutions lie on land. Field Actions Science Reports, 19: 62-67. https://doi.org/10.1126/science.1260352
[54] Law, K.L. (2017). Plastics in the marine environment. Annual Review of Marine Science, 9: 205-229. https://doi.org/10.1146/annurev-marine-010816-060409
[55] Issac, M.N., Kandasubramanian, B. (2021). Effect of microplastics in water and aquatic systems. Environmental Science and Pollution Research, 28: 19544-19562. https://doi.org/10.1007/s11356-021-13184-2
[56] Thompson, R.C., Moore, C.J., Saal, F.S., Swan, S.H. (2010). Plastics, the environment and human health: current consensus and future trends. Philosophical Transactions: Biological Sciences, Royal Society, 364(1526): 2153-2166. https://doi.org/10.1098/rstb.2009.0053
[57] Sarinah, B.K., Basri, K., Maulana, E.S., Handayani, S. (2021). Microplastic Pollution in Waters and its Impact on Health and Environment in Indonesia: A review. Journal of Public Health for Tropical and Coastal Region, 4(2): 63-77. https://doi.org/10.14710/jphtcr.v4i2.10809
[58] Kumar, R., Verma, A., Shome, A., Sinha, R., Sinha, S., Jha, P.K., Kumar, R., Kumar, P., Shubham, Das, S., Sharma, P., Prasad, P.V.V. (2021). Impacts of plastic pollution on ecosystem services, sustainable development goals, and need to focus on circular economy and policy interventions. Sustainability, 13(17): 9963. https://doi.org/10.3390/su13179963