Sisley Rosario Baez-Mauricio![]() | Jaime César Mayorga-Rojas
| Jaime César Mayorga-Rojas![]() | Marilú Calderon-Celis
| Marilú Calderon-Celis![]() | Nora Malca-Casavilca
| Nora Malca-Casavilca![]() | Johnny Henrry Ccatamayo-Barrios
| Johnny Henrry Ccatamayo-Barrios![]() | Luis Miguel Soto-Juscamayta*
| Luis Miguel Soto-Juscamayta*![]() | Alfonso Romero-Baylón
| Alfonso Romero-Baylón![]()
© 2024 The authors. This article is published by IIETA and is licensed under the CC BY 4.0 license (http://creativecommons.org/licenses/by/4.0/).
OPEN ACCESS
This study aims to identify the concentration levels of physical-chemical, inorganic and organic parameters through hydrochemistry, determining their origin, abundance, distribution and migration in the Pachapaqui mining unit. Methodologically, a detailed study was carried out that included ground and surface water sampling, chemical analysis to determine water quality, measurements of levels and flow rates, using different hydrogeological modelling diagrams to understand the dynamics of water flow in the study area. The main results revealed, through Piper's diagram, that the waters of the mine mouths contain predominantly Ca and SO4 ions, classifying them as sulphate (CaSO4). This composition, consistent with the local geology, was confirmed by the Stiff diagram. In addition, significant variability in SO4 levels was observed, suggesting the influence of factors such as lithology and acid mine drainage. The final conclusion indicates that the hydrochemical studies of the mine mouth waters are predominantly sulphate (CaSO4), influenced by geological factors and acid mine drainage. These findings, crucial for groundwater resource management, do not imply significant risks for the construction of pit plugs.
mining effluents, hydrogeology, heavy metals, surface water, groundwater, water pollution
Mining activity is essential for economic development due to its ability to generate employment, drive investment and provide significant economic resources. However, its environmental impact, especially on water resources, has generated growing concern [1, 2]. Therefore, policies and management measures are proposed to guarantee that mining activity is sustainable in the long term. This is due to the need to balance the economic benefits of mining with the protection of the environment and the conservation of natural resources, especially water resources [3]. These policies may include stricter environmental regulations to control and reduce pollution caused by mining activity, as well as the promotion of sustainable mining practices that minimize the impact on water resources [4, 5]. Furthermore, it is essential to promote research and development of cleaner and more efficient technologies in the mining sector to reduce its environmental footprint. In this way, a balance can be achieved between economic development and environmental conservation, ensuring that mining activity benefits both society and the environment [6, 7].
Peru, recognized as one of the most outstanding mining countries at a regional and international level [8]. In addition, being among the largest producers of base metals (i.e. copper, lead and zinc) and precious metals (i.e. gold and silver) currently, standing out as one of the main industries in the country, it faces the challenge of the infiltration of mining effluents into the groundwater [9]. This problem arises due to the need to adequately manage the efluentes mineros generated by mining activity, which represents a significant threat to the quality and quantity of available water, as well as to environmental sustainability and the preservation of water resources. To address this situation, it is crucial to know and implement measures to prevent and mitigate pollution by efluentes mineros, with the purpose of protecting water resources and promoting environmental sustainability [10]. Properly managing these resources becomes essential, especially with regard to control, care and maintenance during their use in the mining industry [11].
The presence of acidic water effluents in mining operations, when not treated adequately, can generate adverse effects on surface and groundwater [12]. These effects not only threaten biodiversity and aquatic ecosystems, but also pose a health risk to local communities that depend on these water sources for their daily activities. So, managing groundwater pollution in mining areas requires innovative approaches and advanced technologies [13, 14]. Sustainable management of groundwater resources is crucial to ensure their long-term availability [13].
To effectively tackle the issue of acidic water effluents in mining operations, it is crucial to conduct a thorough hydrogeological and hydrochemical analysis of the groundwater and surface water sources within the affected areas. This comprehensive assessment will provide the foundation for identifying and implementing viable solutions [15]. This analysis includes identifying all water sources and utilizing tools such as the Piper Diagram, Shoeller Diagram, and Stiff Diagram. These tools visually represent the chemical composition of water, enabling us to pinpoint the characteristics of acidic effluents and comprehend their environmental behavior [16].
Conducting this analysis is not only essential for pinpointing the sources and characteristics of acidic effluents but also provides vital insights for designing effective prevention and mitigation strategies. Understanding the distribution and behavior of these effluents in the environment enables the development of targeted measures aimed at minimizing their impact and safeguarding the quality of groundwater and surface water. In this context, research has high potential and is supported by studies such as the one presented by Pozo-Antonio et al. [17]. They proposed to understand the oxidation mechanisms of iron sulfides, such as pyrite and pyrrhotite, responsible for the formation of acid mine drainage (AMD), as well as to evaluate strategies to prevent and correct this environmental problem. A comprehensive review of the scientific literature was carried out, addressing the chemistry of sulfide oxidation, case studies on the generation of AMD in different mines, and the effectiveness of preventive and corrective measures. Pyrite was identified as the primary mineral involved due to its reactivity under oxidizing conditions. Among the most effective preventive strategies are the application of waterproof covers and revegetation to reduce exposure to water and oxygen. Furthermore, the importance of corrective measures such as chemical neutralization and biological treatment is highlighted to mitigate the environmental impact of the AMD already generated. These findings emphasize the need to understand oxidation processes in detail and to implement integrated approaches to address the problem of acid mine drainage in the mining industry.
There is also the study carried out by Pino and Coarita [18]. The research focused on hydrogeologically characterizing the La Yarada Media aquifer and evaluating the quality of groundwater based on physicochemical parameters and current regulations, revealing significant deterioration due to exploitation. Between 2010 and 2015, 42 long-term pumping tests were carried out, using the Jacob and Theis recovery methods, to determine the transmissivity and permeability of the aquifer. The results indicated that to the southeast the transmissivity varies between 602 and 4,235 m²/d and the permeability between 13 and 86 m/d, showing good hydraulic conditions, while to the northwest, the values are significantly lower, due to the influence of the tuffs of the Huaylillas Formation. Overexploitation has caused a decrease in the static level, changing the transmissivity and permeability values from high and medium to medium and low in Settlement 4, and deteriorating the water quality from acceptable to poor. This study concludes that overexploitation of the aquifer has compromised its hydraulic properties and water quality, highlighting the need to implement sustainable management strategies to prevent further deterioration and ensure proper use of the water resource.
On the other hand, there is the study carried out by focused on identifying the geochemical processes that determine the composition and quality of groundwater in the Middle Magdalena Valley Aquifer System (SAVMM) in Colombia [19]. A database was compiled with 2,207 physicochemical characterizations from government and private entities carried out between 2005 and 2014, selecting 140 valid samples according to integrity and precision criteria. Graphical, hydrochemical and statistical methods were applied, including the Piper diagram, Principal Component Analysis (PCA) and Hierarchical Clustering Analysis (HAA). The results showed that calcium bicarbonate water is the dominant hydrogeochemical facies, followed by sodium bicarbonate and sodium chloride. The PCA identified three main components that explain 59.4% of the variability in the data, while the AAJ grouped the samples into six groups. These findings, correlated with the geology and hydrogeology of the area, revealed that the processes of meteoric recharge, interaction with silicates and carbonates, and anthropogenic alteration by industrial activities are the main factors affecting groundwater quality in the SAVMM. The research highlights the need to sustainably manage the aquifer to mitigate negative impacts and preserve the quality of the water resource.
The objective of this research is to identify the concentration levels of the physical-chemical, inorganic, and organic parameters, through Hydrochemistry, determining their origin, abundance, distribution and migration in the Pachapaqui mining unit.
Mining effluents represent a highly relevant environmental concern due to their potential negative impact on water resources and surrounding ecosystems. Mining, being an activity that involves the extraction of minerals and metals from the earth, inevitably involves the generation of contaminated wastewater that can affect groundwater sources if not managed properly.
The present study focused on addressing this challenge through an integrated approach that combines hydrogeological, chemical and modeling analysis techniques to understand and control the effects of mining effluents on groundwater sources. Following this approach, a series of meticulous steps were carried out, ranging from the identification of water sources to advanced simulation of the hydrogeochemical processes involved.
The importance of this integrated approach lies in its ability to provide a holistic and detailed understanding of the hydrogeological and geochemical processes that govern groundwater quality in areas affected by mining activity. As they point out “Effective control of mining effluents requires a multidisciplinary approach that combines knowledge of geology, hydrology, geochemistry and numerical modeling” [20].
For the development of this research, it was considered the taking of water samples at the different points of manifestation of groundwater, which may have direct or indirect influence on the mine heads, which were compared referentially with the Canadian international standards CEGS: Canadian Environmental Quality Guidelines-Water: Agriculture (Irrigation), for having a Peruvian groundwater quality standard.
In line with this perspective, the present study proposed:
• Identify and characterize groundwater sources in areas near mining operations.
• Perform detailed chemical analyzes using three recognized geochemical diagrams to assess groundwater quality and detect potential impacts from mining effluents.
• Use advanced hydrogeochemical simulations to predict the transport and dispersion of contaminants in the aquifer environment and evaluate the effectiveness of control and mitigation strategies.
• By adopting this comprehensive approach, it is hoped to generate sound scientific information and practical recommendations to improve environmental management and minimize the negative impacts of mining activity on groundwater sources.
2.1 Inventory of water sources
Within the framework of the development of the study “Mining Effluent Control: Hydrogeological Integration for the Protection of Groundwater Sources”, a detailed inventory of groundwater sources in the study area was carried out. This inventory was carried out using geospatial mapping methods and hydrogeological prospecting techniques. The sampling sites were strategically chosen based on their proximity to potential contamination sources such as mine openings and areas of surface water manifestation. This spatial distribution allows for the effective monitoring of water quality changes influenced by mining activities and ensures comprehensive coverage of the study area. The selection was guided by prior hydrogeological mapping and the identification of critical points where groundwater and surface water interactions are most likely to occurThe procedure followed is detailed below:
2.1.1 Planning and preparation
First, an exhaustive review of the existing literature and previous studies related to the hydrogeology of the study area was carried out. Based on the methodology of Freeze and Cherry (1979), a specific inventory sheet was designed for the collection of data from water sources, including springs, lagoons and streams, as shown in Table 1.
2.1.2 Field data collection
The necessary equipment for field work was prepared, including GPS, flow meters, water sampling equipment and geospatial mapping tools. Subsequently, all water sources identified in the study area were visited.
At each location, UTM WGS 84 (Zone 19) coordinates were recorded using high-precision GPS, depth of groundwater sources and flow rate (in liters per second) were measured using flow meters, and samples were taken. of water for physical-chemical quality analysis, including parameters such as pH, electrical conductivity, total dissolved solids (TDS) and concentration of heavy metals.
2.1.3 Data registration
For each water source, an inventory sheet was completed, recording relevant information such as the name of the source, location (department, province, district, UTM coordinates), flow (l/s) and regime, as well as additional observations on the sampling environment and conditions. Additionally, photographs were taken of each source and additional notes were recorded regarding environmental conditions and possible sources of contamination.
2.1.4 Data analysis
All data collected were compiled into a central database for easy analysis. Subsequently, a hydrogeological analysis was carried out to evaluate the characteristics of the water sources and their potential vulnerability to contamination.
The implementation of this procedure allowed us to obtain a comprehensive view of the hydrogeological characteristics of the water sources in the study area, providing a solid basis for the development of effective management and conservation strategies for water resources.
Table 1. Proposed water source inventory formats
|
Inventory of Water Sources |
|||||||||
|
N |
Name of the source |
Location |
Features |
||||||
|
Policy |
Geographical |
||||||||
|
Dep. |
Prov. |
District |
UTM Coordinates WGS 84-Zone 19 |
Flow rate (l/s) |
Regime |
||||
|
This |
North |
Altitude (msnm) |
|||||||
|
|
|
|
|
|
|
|
|
|
|
Through the collection and analysis of data in Table 1, a comprehensive view of the hydrogeological characteristics of the water sources in the study area can be obtained. This information is crucial for making informed decisions regarding the management of water resources and the implementation of environmental protection and remediation measures.
2.2 Chemical analysis
Piper, Schoeller, and Stiff diagrams were selected for the study because of their ability to provide comprehensive visual representations of hydrochemical data, which is crucial for identifying patterns and trends in water chemistry. The Piper diagram, in particular, allows the classification of water types and the identification of hydrochemical facies. The Schoeller diagram provides a comparative view of the ionic composition, highlighting the relative concentrations of the major ions, while the Stiff diagram provides a distinct visual summary of the ionic balance of the water samples. These methods have advantages over other techniques due to their ability to synthesize complex data into understandable formats, facilitating the interpretation of hydrogeochemical processes and possible sources of contamination.
Quality assurance (QA) and Quality control (QC) procedures were rigorously followed to ensure the reliability of the geochemical data. Water samples were collected using sterilized bottles to avoid contamination and were immediately stored in refrigerated containers. In the laboratory, samples were filtered and preserved with acid where necessary. Analytical instruments were calibrated regularly, and duplicate samples were analyzed to verify consistency. Standards and blanks were included in each batch of analyses to check for accuracy and precision.
2.2.1 Piper-hill-langelier diagram, with water type fields
As part of the study, a detailed chemical analysis of the collected water samples was carried out. This analysis was performed using the Piper-Hill-Langelier diagram with AquaChem 2014.2 software, a widely recognized method for groundwater classification based on ion concentration. The procedure followed is described below:
• First, water samples were carefully collected in the field. During sample collection, standard protocols were followed to avoid cross-contamination and ensure their representativeness.
• Once collected, the samples were transported to the laboratory under controlled temperature conditions, using refrigerated containers to preserve their integrity. In the laboratory, samples were prepared for chemical analysis by filtration and, in some cases, preserved with acid to stabilize the ions present. Analytical techniques such as ion chromatography and atomic absorption spectrometry were used to measure the concentrations of the main ions: cations (Ca²⁺, Mg²⁺, Na⁺, K⁺) and anions (HCO₃⁻, SO₄²⁻, Cl⁻).
• Subsequently, the ion concentrations obtained were entered into specialized software that generated the Piper diagram. This diagram allows you to visualize the chemical composition of the samples and classify the type of water. The three parts of the diagram (two triangles and a rhombus) help identify the hydrochemical facies.
• Based on the diagram, the waters were classified according to their predominant ionic characteristics in specific fields, such as calcium bicarbonate or sodium sulfate, among others.
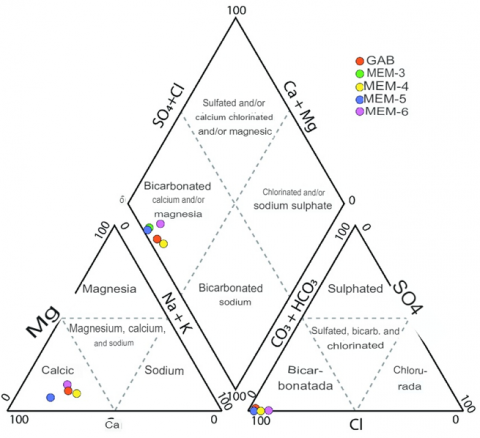
The results of the chemical analysis were presented visually in Figure 1, which shows the Piper diagram with the water type fields identified for each sample. In the methodology of this study, the Piper diagram was selected for its unique ability to provide a comprehensible and visually intuitive representation of the hydrochemical composition of water. This tool not only facilitates the identification of patterns crucial for mining effluent management and protection of groundwater resources, but also supports effective communication of scientific results.
Figure 1. Piper-Hill-Langelier diagram, with water type fields
This representation allowed us to compare the characteristics of the different water sources, identifying patterns and possible sources of contamination. The use of the Piper-Hill-Langelier diagram provided a detailed view of the ionic composition of the water sources in the study area, crucial information for making informed decisions on the management of water resources and the implementation of mitigation measures. environmental protection and remediation.
2.2.2 Schoeller diagram
In this study, the Schoeller diagram was used as a fundamental part of the chemical analysis of the collected groundwater samples. The use of the Schoeller-Berkaloff Diagram provides a valuable tool to evaluate and compare the relative concentrations of the main ions present in source waters. This diagram allows you to easily visualize trends and patterns in the chemical composition of water, which is essential for identifying geological changes and possible sources of contamination. By providing a clear and detailed representation of water quality, the Schoeller-Berkaloff diagram facilitates informed decision-making regarding water resource management and the implementation of environmental protection and remediation measures. It provides a unique visual representation of the hydrochemical composition of water, using a logarithmic scale on the y-axis for ion concentrations, while the major dissolved ions are arranged on the x-axis according to their typical solubility.
The application of the Schoeller diagram allows plotting points that represent the concentrations of each ion in the water samples, thus forming a dashed line that reflects the specific chemical composition of each sample. Higher positions on the graph indicate higher concentrations, while "peaks" on the line highlight the dominant ions, providing a clear and understandable visual representation of groundwater quality.
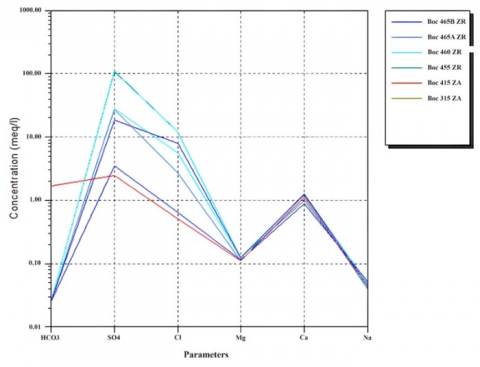
Figure 2. Diagram of the Shoeller-Berkaloff
Methodologically, the use of the Schoeller diagram is crucial due to its ability to identify patterns and trends in the chemical composition of groundwater. This tool not only facilitates the detection of possible sources of contamination, but also helps to understand the influence of hydrogeological factors on the water chemistry in the study area. In addition, it allows effective communication of results, thus supporting informed and strategic decision-making for the management and protection of groundwater sources against activities such as mining. The use of the Schoeller diagram in this study contributed significantly to the knowledge of water quality in the study area, identifying possible sources of contamination and facilitating the formulation of appropriate management and mitigation strategies to protect groundwater sources from the effects adverse effects of mining activity, said tool is illustrated in Figure 2.
The linear Schöeller-Berkaloff diagram consists of a category axis (x-axis) where each vertical corresponds to a (generally majority) ion. Conventionally, the first three categories correspond to cations, and the remaining ones correspond to anions, in increasing and decreasing order of solubility, respectively. On the ordinate axis, the concentration of each ion (in meq/L) is marked on a logarithmic scale. By joining the points determined for each ion based on its concentration, a broken line is obtained that represents a specific sample. A higher location of the line within the graph indicates a higher concentration of the sample and its “peaks” allow the dominant ions to be identified. Although multiple samples can be included in a single graph, it can be confusing when there are too many of them.
2.2.3 Stiff diagram
In the context of the study, the Stiff diagram was used as a complementary tool to the geochemical analysis of the collected water samples. This diagram, proposed by Stiff in 1951, offers a visual representation of the distribution of the main cations and anions present in groundwater samples.
The use of the Stiff diagram made it possible to identify patterns of geochemical variation in the water samples and evaluate the hydrochemical evolution of the aquifer system under study. By plotting ion concentrations on a graph, this approach makes it easy to identify trends and changes in the chemical composition of water over time or at different locations within the aquifer.
Visualization of these patterns of geochemical variation is essential to understand the dynamics of the aquifer system and to make informed decisions about its management and protection. Identifying the hydrochemical evolution of the aquifer can help predict possible changes in water quality and design appropriate management strategies to maintain its long-term sustainability, as can be seen in Figure 3.
The modified Stiff diagram is a polygon representative of an individual sample that is constructed by vertically distributing, equidistantly, three lines (when only the main ions are included), which are cut by a central axis to define semilines to the left (side cationic) and right (anionic side).
By convention, the vertical distribution of ions (“key to the diagram”) must follow an order, increasing or decreasing, of solubility. On each semi-line, segments of length proportional to the concentration of the corresponding ion are marked, according to a previously established scale, with which the size of the polygon reflects the total dissolved solids of the sample and the most prominent vertices, on the left and right, correspond to the dominant cation and anion, respectively. To enable the diagram to be read, its key and design scale must be made explicit.
Like the pie chart, it is individual for each sample and its potential increases when the polygons are arranged on a map, in the location corresponding to the sampling point, although the inconvenience of not being able to use the same scale for all of them usually arises, when the concentration differences of the samples are significant.
Figure 3. Diagram of stiff modified
3.1 Water source inventory
A detailed inventory of groundwater sources in the study area is presented below. This inventory is based on geospatial mapping methods and hydrogeological prospecting techniques, collecting relevant information on the location, depth, flow, physical-chemical quality and hydrogeological characteristics of each water source. The tables provide a comprehensive view of this data, being fundamental tools for understanding and managing water resources in the study area.
Table 2 Gauge points-springs, presents in a concise and systematic way crucial information on the location, flow and hydrogeological characteristics of 16 springs in the study area. This sheet constitutes a fundamental tool for the evaluation and effective management of groundwater resources, allowing a detailed understanding of their distribution and potential in the context of the study.
In Table 3, Gauge Points-Lagoon, offers a detailed compilation of data on lagoons in the study area. This table provides a comprehensive view of the main characteristics of the lagoons, being an essential tool for evaluating their importance in the hydrogeological and environmental context of the study.
Gauge Points-Wetlands, offers a detailed compilation of data on wetlands in the study area (Table 4). This table provides a comprehensive view of the main characteristics of the wetlands, being an essential tool for evaluating their importance in the hydrogeological and environmental context of the study.
3.2 Chemical analysis
The results of the chemical analysis, using the Piper-Hill-Langelier, Schoeller and Stiff diagrams, revealed a significant variability in the ionic composition of the groundwater sources in the study area. The Piper diagram indicated the presence of different hydrochemical facies, suggesting variations in water quality due to geological and anthropogenic influences. The Schoeller diagram allowed the identification of contamination patterns by specific ions, while the Stiff diagram highlighted the predominant concentrations of cations and anions in the samples. These results provide a comprehensive understanding of the hydrochemical evolution of the aquifer system and possible sources of contamination.
Table 2. Gauging points - Springs
|
Inventory of Water Sources - Springs |
|||||||||
|
No. |
Name of the Source |
Location |
Features |
||||||
|
Policy |
Geographical |
||||||||
|
Dep. |
Prov. |
District |
UTM Coordinates WGS 84-Zone 19 |
Flow Rate (l/s) |
Regime |
||||
|
This |
North |
Altitude (msnm) |
|||||||
|
1 |
MP-5 |
Ancash |
Bolognesi |
Aquia |
275227 |
8901768 |
4400 |
3 |
Permanent |
|
2 |
MP-7 |
Ancash |
Bolognesi |
Aquia |
275203 |
8901635 |
4370 |
2 |
Permanent |
|
3 |
MP-6 |
Ancash |
Bolognesi |
Aquia |
275168 |
8901558 |
4360 |
1 |
Permanent |
|
4 |
MP-27 |
Ancash |
Bolognesi |
Aquia |
274422 |
8901674 |
4150 |
8 |
Permanent |
|
5 |
MP-25 |
Ancash |
Bolognesi |
Aquia |
274609 |
8901443 |
4170 |
3 |
Permanent |
|
6 |
MP-26 |
Ancash |
Bolognesi |
Aquia |
274576 |
8901429 |
4170 |
3 |
Permanent |
|
7 |
MP-31 |
Ancash |
Bolognesi |
Aquia |
274537 |
8901252 |
4170 |
6 |
Permanent |
|
8 |
MP-9 |
Ancash |
Bolognesi |
Aquia |
274366 |
8900985 |
4100 |
0 |
Permanent |
|
9 |
MP-13 |
Ancash |
Bolognesi |
Aquia |
274363 |
8900887 |
4100 |
12.5 |
Permanent |
|
10 |
MP-12 |
Ancash |
Bolognesi |
Aquia |
274390 |
8900900 |
4100 |
2 |
Permanent |
|
11 |
MP-10 |
Ancash |
Bolognesi |
Aquia |
274377 |
8900930 |
4100 |
4.5 |
Permanent |
|
12 |
MP-32 |
Ancash |
Bolognesi |
Aquia |
274414 |
8900749 |
4109 |
3 |
Permanent |
|
13 |
MN-ARA1 |
Ancash |
Bolognesi |
Aquia |
274077 |
8901871 |
4387 |
1 |
Permanent |
|
14 |
MN-ARA2 |
Ancash |
Bolognesi |
Aquia |
273792 |
8901533 |
4325 |
2 |
Permanent |
|
15 |
MN-33 |
Ancash |
Bolognesi |
Aquia |
271469 |
8898724 |
3998 |
4 |
Permanent |
|
16 |
MN-34 |
Ancash |
Bolognesi |
Aquia |
271608 |
8898759 |
3991 |
4 |
Permanent |
Table 3. Capacity points-Lagoon
|
Inventory of Water Sources - Lagoon |
||||||||||||
|
No. |
Name of the Source |
Location |
Features |
|||||||||
|
Policy |
Geographical |
|||||||||||
|
Dep. |
Prov. |
District |
UTM Coordinates WGS 84-Zone 19 |
Area (m2) |
Perimeter (m) |
Flow Rate |
Régimen |
|||||
|
This |
North |
Altitude (msnm) |
Income |
Exit |
||||||||
|
1 |
El Burrito |
Ancash |
Bolognesi |
Aquia |
275958 |
8901882 |
4580 |
1616.19 |
172.52 |
60 |
108 |
Permanent |
|
2 |
El Burro |
Ancash |
Bolognesi |
Aquia |
275103 |
8902253 |
4270 |
9604.33 |
596.34 |
222 |
280 |
Permanent |
Table 4. Points of gauging - Bofedales
|
Bofedales |
||||||||||||||||||||
|
Name of wetlands |
Source code |
Ubicación |
Features |
Water use class |
Type of Bofedal |
Type of recharge |
State of conservation |
Ecosystem Service (Water Use Type) |
Law class |
Inventory date |
Conflicts |
Remarks |
||||||||
|
Geográfica-Coordenadas UTM WGS 84-Zona 19 L |
Política |
|||||||||||||||||||
|
This |
North |
Altitude (m.s.n.m.) |
Dep. |
Prov. |
District |
Area (m2) |
Flow rate |
|||||||||||||
|
Income (l/s) |
Exit (l/s) |
Type of capacity |
||||||||||||||||||
|
Bofedal T5 |
T5 |
274330 |
8901005 |
4110 |
Ancash |
Bolognesi |
Aquia |
14500 |
N/D |
N/D |
- |
Primary |
Permanent |
Phreatic |
Good |
Turf development |
No right of use |
Nov-14 |
No conflicts |
None |
|
Bofedal T6 |
T6 |
274268 |
8901032 |
4084 |
Ancash |
Bolognesi |
Aquia |
14500 |
N/D |
N/D |
- |
Primary |
Permanent |
Phreatic |
Good |
Turf development |
Nov-14 |
None |
||
|
Bofedal T10 |
T10 |
273824 |
8899950 |
4024 |
Ancash |
Bolognesi |
Aquia |
8000 |
N/D |
N/D |
- |
Primary |
Permanent |
Phreatic |
Good |
Turf development |
Nov-14 |
None |
||
|
Bofedal T12 |
T12 |
273173 |
8899676 |
4013 |
Ancash |
Bolognesi |
Aquia |
11800 |
N/D |
N/D |
- |
Primary |
Permanent |
Phreatic |
Good |
Turf development |
Nov-14 |
None |
||
|
Bofedal T16 |
T16 |
271948 |
8899227 |
3993 |
Ancash |
Bolognesi |
Aquia |
31000 |
N/D |
N/D |
- |
Primary |
Permanent |
Phreatic |
Regular |
Turf development |
Nov-14 |
None |
||
|
Bofedal T17 |
T17 |
271584 |
8899015 |
3992 |
Ancash |
Bolognesi |
Aquia |
31000 |
N/D |
N/D |
- |
Primary |
Permanent |
Phreatic |
Regular |
Turf development |
Nov-14 |
None |
||
|
Bofedal T25 |
T25 |
274223 |
8900374 |
4040 |
Ancash |
Bolognesi |
Aquia |
3500 |
N/D |
N/D |
- |
Primary |
Permanent |
Phreatic |
Regular |
Turf development |
Nov-14 |
None |
||
|
Bofedal T10 |
T10 |
273887 |
8899664 |
4024 |
Ancash |
Bolognesi |
Aquia |
8000 |
N/D |
N/D |
- |
Primary |
Permanent |
Phreatic |
Regular |
Turf development |
Nov-14 |
None |
||
|
Bofedal T27 |
T27 |
273548 |
8899535 |
4018 |
Ancash |
Bolognesi |
Aquia |
10200 |
N/D |
N/D |
- |
Primary |
Permanent |
Phreatic |
Regular |
Turf development |
Nov-14 |
None |
||
|
Bofedal T28 |
T28 |
273421 |
8899679 |
4017 |
Ancash |
Bolognesi |
Aquia |
10200 |
N/D |
N/D |
- |
Primary |
Permanent |
Phreatic |
Regular |
Turf development |
Nov-14 |
None |
||
|
Bofedal T29 |
T29 |
272952 |
8899262 |
4033 |
Ancash |
Bolognesi |
Aquia |
4300 |
N/D |
N/D |
- |
Primary |
Permanent |
Phreatic |
Regular |
Turf development |
Nov-14 |
None |
||
|
Bofedal T32 |
T32 |
274319 |
8899637 |
4056 |
Ancash |
Bolognesi |
Aquia |
3300 |
N/D |
N/D |
- |
Primary |
Permanent |
Phreatic |
Regular |
Turf development |
Nov-14 |
None |
||
|
Bofedal T34 |
T34 |
275038 |
8899191 |
4069 |
Ancash |
Bolognesi |
Aquia |
2800 |
N/D |
N/D |
- |
Primary |
Permanent |
Phreatic |
Regular |
Turf development |
Nov-14 |
None |
||
3.2.1 Application of the Piper-Hill-Langelier diagram, with water type fields
A detailed analysis of the hydrochemical composition of water samples collected at various mine openings within the study area was carried out. Using the Piper diagram, we sought to identify and classify the types of groundwater, as well as understand the geological and spatial influences on its chemical composition, as shown in Figure 4.
Based on the results of the Piper diagram (Figure 4), the water samples from each mine entrance show a predominance of calcium and sulfate ions (SO₄), which classifies them as sulfated type (Ca-SO₄). This characterization is typical in gypsum soils and mine drainage, which reflects the particular geological characteristics of the area.
Figure 4. Piper processing results
Samples 465B, 465A, 460, and 455 exhibited a uniform hydrochemical composition due to their spatial proximity. Although samples 315 and 070 are separated by approximately 1.5km, they showed a similar hydrochemical profile as the previous samples.
On the other hand, sample 415, located in the extreme northwest, presented an increase in carbonate anions, possibly due to runoff and percolation in calcareous lithologies in the area.
These discoveries highlight how geological features and local topography significantly influence the hydrochemical composition of groundwater. The predominant type of water identified in the study is sulfated (Ca-SO₄), highlighting the importance of understanding the geological context for the effective management and protection of local water resources.
3.2.2 Application of the Schoeller diagram
To gain deeper insights into the chemical composition of groundwater within the study area, we conducted a meticulous examination of the ion content in our collected samples. Employing various graphs and analytical methods, our objective was to pinpoint the prevailing ion concentrations and detect any fluctuations that might signify geological or human-induced influences. Figure 5 below illustrates the outcomes of these analyses, emphasizing significant observations and their implications for the quality and sources of groundwater.
Figure 5. Schoeller processing results
In Figure 5, it is observed that the SO4 ion is the majority in all the samples analyzed. In relation to what was discussed in the previous section, the positive deviation in the HCO3 ion content in sample 415 stands out, maintaining a similar hydrochemical profile in the rest of the ions. With respect to SO4 and Cl ions, all samples showed variability in their contents, being more pronounced in the SO4 ion. The observed variability in SO4 levels, in a sampling area of approximately 1.2-1.3km², suggests the possible influence of various factors in the aquifer, such as sulfide leaching, acid mine drainage, and the use of explosives. and blasting agents.
The Schoeller diagrams highlighted that the dominant ions in the water samples are calcium and sulfate, with notable variations in concentration across different sites. This pattern suggests localized influences of geological formations and potential contamination sources such as acid mine drainage. By comparing the relative concentrations, it is evident that certain areas are more affected, necessitating targeted remediation efforts.
3.2.3 Application of the stiff diagram
In the geochemical analysis of the collected water samples, the Stiff diagram as shown in Figures 6 to 11 was employed to provide a visual representation of the distribution of major cations and anions. This graphical approach is especially useful for identifying patterns of geochemical variation and evaluating the hydrochemical evolution of the aquifer system.
The Stiff diagrams indicate variations in the concentrations of major cations and anions across different sampling sites. For instance, Site A shows a higher concentration of calcium and sulfate compared to Site B, reflecting localized geochemical conditions and potential mining impacts. These individual results contribute to the overall understanding of the hydrochemical dynamics and the influence of mining activities on groundwater quality.The polygons in the Stiff diagram visually represent the ionic composition of water samples, with each axis corresponding to a specific ion concentration. The width of the polygon along each axis is proportional to the concentration of that ion. Thus, larger polygons indicate higher concentrations of total dissolved solids (TDS) and major cations/anions, providing a clear visual representation of water chemistry. This aids in quickly comparing the chemical characteristics of different water samples.
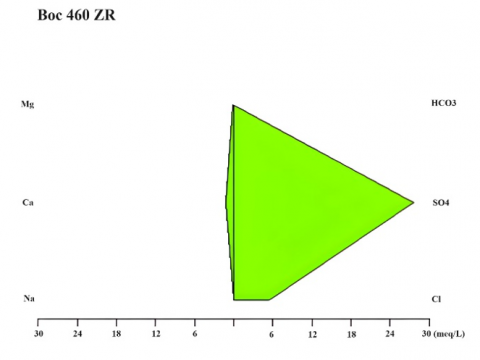
Figure 6. Stiff Processing Results-Bocamina 460 Rich Zone
Bocamina 460 ZR: In Figure 6, the most prominent vertices of the graph indicate the majority presence of SO4 ions (between 24 and 30 meq/L approx.), and to a lesser extent, Ca ions (2 meq/L approx.).
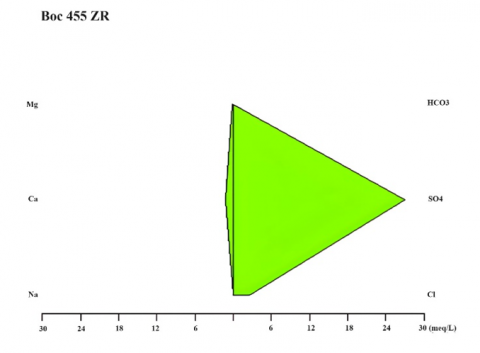
Figure 7. Stiff Processing Results - Bocamina 455 Wealth Zone
Bocamina 455 ZR: In Figure 7, the most prominent vertices of the graph indicate the majority presence of SO4 ions (between 24 and 30 meq/L approx.), and to a lesser extent, Ca ions (2 meq/L approx.).
Figure 8. Stiff Processing Results - Bocamina 465-A Wealth Zone
Bocamina 465A ZA: In Figure 8, the most prominent vertices of the graph indicate the majority presence of SO4 ions (between 80 and 120 meq/L approx.), and to a lesser extent, Ca ions (1 meq/L approx.).
Bocamina 465B ZR: In Figure 9, the most prominent vertices of the graph indicate the majority presence of SO4 ions (between 80 and 120 meq/L approx.), and to a lesser extent, Ca ions (approx. 1 meq/L).
Bocamina 415 ZA: In Figure 10, the most prominent vertices of the graph indicate the majority presence of SO4 ions (between 16 and 20 meq/L approx.), and to a lesser extent, Ca ions (2 meq/L approx.).
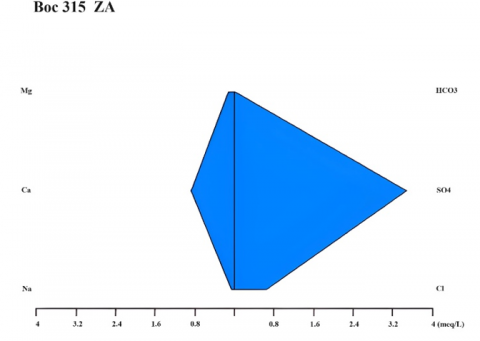
Bocamina 315 ZA: The most prominent vertices of the graph indicate the majority presence of SO4 ions (between 3.2 and 4 meq/L approx.), and to a lesser extent, Ca ions (approx. 1 meq/L).
Figure 9. Stiff Processing Results-Bocamina 465-B ZR Zona Riqueza
Figure 10. Stiff Processing Results-Bocamina 415 Arabia Zone
Figure 11. Stiff Processing Results-Bocamina 315 Arabia Zone
The findings of this study align with global research on the hydrochemical impacts of mining activities. Similar studies, such as those conducted in the Middle Magdalena Valley Aquifer System in Colombia and La Yarada Media aquifer in Peru, have also identified the significant influence of geological formations and acid mine drainage on groundwater quality. This broader context underscores the universal challenges posed by mining operations and the necessity for globally applicable management and mitigation strategies.
The Piper diagram analysis identified the predominant water type in the study area as calcium-sulfate (Ca-SO4), indicating significant sulfate influence from geological formations and potential acid mine drainage. This is critical for understanding the region's groundwater hydrochemistry.
The Stiff diagram corroborated the predominance of Ca and SO4 ions, confirming the classification of the waters as Ca-SO4. This consistency reinforces the understanding of the chemical composition of water in the study area.
Significant variability in SO4 ion levels across samples suggests influences such as lithological composition, sulfide leaching, acid mine drainage, and the use of explosives. This highlights the complexity of factors affecting groundwater quality.
A slight increase in carbonate content was observed in the northwest sample, attributed to factors like topography, runoff, percolation, and proximity to calcareous formations, indicating strong local geological and hydrological influences.
While calcium-sulfate waters are present, they do not inherently pose significant engineering challenges for minehole plug construction. Proper engineering design and sulfate-resistant materials can effectively mitigate potential sulfate attack on concrete. Thus, with caution, successful construction remains feasible despite the presence of sulfate.
This work has been made possible thanks to the collaboration of the specialised company Asesores y Consultores Mineros S.A.
|
Boc |
Bocamina |
|
ZR |
Zona riqueza |
|
ZA |
Zona arabia |
|
SO4 |
Sulfato |
|
Ca |
Calcio |
|
AMD |
Acid mine drainage |
|
meq/L |
Miliequivalentes por litro |
[1] Hilson, G., Murck, B. (2000). Sustainable development in the mining industry: Clarifying the corporate perspective. Resources Policy, 26(4): 227-238. https://doi.org/10.1016/S0301-4207(00)00041-6
[2] Bambi, A.A. (2019). Minería y desarrollo sostenible: Un acercamiento a la explotación de materiales para la construcción en Uige, Angola. Minería y Geología, 35(4): 480-497.
[3] Vilela-Pincay, W., Espinosa-Encarnación, M., Bravo-González, A. (2020). La contaminación ambiental ocasionada por la minería en la provincia de El Oro. Estudios de la Gestión: Revista Internacional de Administración, (8): 210-228. https://doi.org/10.32719/25506641.2020.8.8
[4] Hodge, R.A., Ericsson, M., Löf, O., Löf, A., Semkowich, P. (2022). The global mining industry: Corporate profile, complexity, and change. Mineral Economics, 35(3): 587-606. https://doi.org/10.1007/s13563-022-00343-1
[5] Covarrubias, S.A., Cabriales, J.J.P. (2017). Contaminación ambiental por metales pesados en México: Problemática y estrategias de fitorremediación. Revista Internacional de Contaminación Ambiental, 33: 7-21. https://doi.org/10.20937/RICA.2017.33.esp01.01
[6] Rubio, D.I.C., Calderón, R.A.M., Gualtero, A.P., Acosta, D.R., Sandoval, J. (2015). Tratamientos para la remoción de metales pesados comúnmente presentes en aguas residuales industriales: Una revisión. Ingeniería y Región, 13(1): 73-90. https://doi.org/10.25054/22161325.710.
[7] Yeboah, S.A. (2023). Unearthing the hidden perils: A comprehensive review of illegal Mining’s devastating toll on Ghana’s environmental sustainability. https://www.researchgate.net/publication/372401472.
[8] Arellano, J. (2008). Resurgimiento minero en Perú:¿ Una versión moderna de una vieja maldición?. Colombia Internacional, (67): 38-59. http://www.scielo.org.co/scielo.php?script=sci_arttext&pid=S0121-56122008000100004&lng=en&nrm=iso&tlng=es.
[9] Bornschier, S., Vogt, M. (2024). The politics of extractivism: mining, institutional responsiveness, and social resistance. World Development, 176: 106493. https://doi.org/10.1016/j.worlddev.2023.106493
[10] Lottermoser, B.G. (2010). Mine wastes: Characterization, treatment and environmental impacts.
[11] Environmental law institutecresearch report (2000). Prevencion de la contaminacion minera: Propuesta de un marco común para las américas. https://www.eli.org/sites/default/files/elipubs/d10_02s.pdf.
[12] Galhardi, J.A., Bonotto, D.M. (2016). Hydrogeochemical features of surface water and groundwater contaminated with acid mine drainage (AMD) in coal mining areas: A case study in southern Brazil. Environmental Science and Pollution Research, 23: 18911-18927. https://doi.org/10.1007/s11356-016-7077-3
[13] Mancheno, A.D.D.J.R. (2024). Efectos del consumo de agua contaminada en la calidad de vida de las personas. Polo del Conocimiento: Revista Científico-Profesional, 9(1): 614-632. https://doi.org/10.23857/pc.v9i1.6396
[14] LHernández Vásquez, L., Chamizo Garcia, H., Mora Alvarado, D. (2011). Quality of the water for human consumption and health: Two studies of case in Costa Rica. Revista Costarricense de Salud Pública, 20(1): 25-30. https://www.scielo.sa.cr/pdf/rcsp/v20n1/art4v20n1.pdf.
[15] Meza-Duman, R., Hermoza-Gutierrez, M., Maldonado, I., Salas-Mercado, D. (2022). Percepción social de la calidad del agua y la expansión territorial de la minería en Ollachea, Puno, Perú. Comuni@ Cción, 13(1): 16-28. https://doi.org/10.33595/2226-1478.13.1.580
[16] Parravicini, D. (2015). Apuntes sobre el cierre de minas. Panorama minero: Enfoques, 428: 48-52. https://www.palermo.edu/Archivos_content/2015/derecho/2015di ciembre/parravicini_4/parravicini_cierre_de_minas.pdf.
[17] Pozo-Antonio, S., Puente-Luna, I., Lagüela-López, S., Veiga-Ríos, M. (2014). Techniques to correct and prevent acid mine drainage: A review. Dyna, 81(186): 73-80. https://doi.org/10.15446/dyna.v81n186.38436
[18] Pino, E., Coarita, F. (2018). Caracterización hidrogeológica para determinar el deterioro de la calidad del agua en el acuifero la yarada media. Revista de Investigaciones Altoandinas, 20(4): 477-490. https://doi.org/10.18271/RIA.2018.424
[19] Malagón, J.P., Piña, A., Argüello, S., Donado, L.D. (2021). Hydrogeochemical-multivariate analysis of groundwater in the aquifer system of the middle Magdalena valley, Colombia: Regional-scale study. Boletín de la Sociedad Geológica Mexicana, 73(3). https://doi.org/10.18268/BSGM2021v73n3a070421
[20] Rubio, D.I.C., Calderón, R.A.M., Gualtero, A.P., Acosta, D.R., Sandoval, J. (2015). Tratamientos para la remoción de metales pesados comúnmente presentes en aguas residuales industriales: Una revisión. Ngeniería y Región, (13): 73-90. https://dialnet.unirioja.es/servlet/articulo?codigo=5432290.