Asabonga Mngeni*![]() | Nelisa Tembani
| Nelisa Tembani![]() | Zendy Magayiyana
| Zendy Magayiyana![]()
© 2023 IIETA. This article is published by IIETA and is licensed under the CC BY 4.0 license (http://creativecommons.org/licenses/by/4.0/).
OPEN ACCESS
Management of municipal solid waste (MSW) is a serious environmental challenge that many nations, particularly developing ones are currently experiencing. As a result, information about the amount and type of MSW is needed to establish an effective waste management strategy. In addition, the amount and type of MSW may change from place to place and season to season. Thus, the purpose of this study was to determine the amount of MSW recovered in the O.R. Tambo District Municipality, Eastern Cape, South African. The first objective of this study was to determine the effect of season on the amount of each waste type (aluminium cans, bottles, cardboards and plastics) recovered. The second objective was to compare the amount of each waste type recovered among the five local municipalities (Ingquza Hill, King Sabatha Dalindyebo, Mhlontlo, Nyandeni and Port St. Johns (PSJ)). The study, which focused on MSW recovered over a two-year period (September 2019 to August 2021), revealed that there were no statistically significant differences in the amount of MSW recovered among the four seasons. However, the type of waste recovered mostly varied significantly across the local municipalities. For example, PSJ had the highest recovery of bottles, while Mhlontlo had the highest recovery of other types of waste. We can conclude that solid waste recovery is crucial since it reduces the amount of waste that must be disposed of in landfills and saves more natural resources.
waste recovery, bottles, cardboards, plastics, aluminium cans
The municipal solid waste (MSW) consists of household, business squanders, development/demolition trash, sanitation waste and the waste gathered by a municipal authority. Solid wastes comprise of all waste materials except for the waste in the form of gases and liquid [1]. Due to population growth, economic development, and changes in socio-economic situations, the Municipal Solid Waste problem is getting worse. Therefore, as cities expand, more waste is being produced daily [1-3]. Rapid urban population growth, migration to urban areas, and industrialization have a significant impact on developing countries. These factors, which contributed to urbanization, particularly during the nineteenth century, have led to previously unheard-of demands on municipalities to provide waste management services like waste collection [4, 5].
Additionally, the composition of municipal solid waste (MSW) is a result of regional and cultural variables, social behaviour, and it is significantly influenced by economic issues [6-8] found a substantial correlation between MSW generation per capita and income level of a nation, indicating that as economies in low- and middle-income countries develop, high levels of per capita waste should be anticipated. It is reasonable to anticipate that for cities in Africa and Asia, the total amounts of MSW in 2030 will be twice as high as the current levels because the increase in urban MSW is higher than in rural area [9]. Less than half of the solid waste produced in cities across Africa is collected, and 95% of that is neither contained nor recycled [10]. This waste produced in Africa is dumped carelessly in makeshift sites or landfills on the outskirts of urban areas [4, 10]. According to Etengeneng [5] insufficient waste management practices, lack of adequate recycling incentives as well as public knowledge, and ineffective by law enforcement all have an impact on MSW. Furthermore, the ineffective methods of disposing of solid waste have detrimental effects on human health and the environment that go beyond their borders, contaminating adjacent water supplies and acting as disease breeding grounds [11]. Despite these difficulties, it should be noted that several African nations set goals that aim to put into practice efficient waste management techniques and strategies such as, anaerobic digestion, composting, and recycling [11]. The quality of the waste, which influences emissions from landfills, the quality of incineration residues, and other waste management characteristics, may be significantly impacted by variations in MSW composition [7].
The role of MSW is challenging in South Africa. For instance, SWM has become one of the most pressing issues facing municipal authorities in South Africa [12] Cities in South Africa now heavily rely on community involvement in MSW. For instance, recycling and SWM both benefit greatly from the work of informal garbage collectors. By encouraging environmental sustainability and employment creation, this form of community involvement benefits both the environment and the economy.
In 2012, South Africa produced 108 million tons of waste, of which 59 million tons were classified as general waste. Here, the rate of waste generation per capita has been estimated to be 0.9kg of solid waste every day, of which 90.1% is landfilled but where only 9.9% of this waste is recycled [13]. Nonetheless, 19.7 million (34%) of South Africa's population lacks access to waste collection services, forcing people to burn or illegally dump their waste, which results in the leakage of valuable recyclable materials into the environment and their unaccounted-for disappearance [9]. Municipalities all around South Africa are consequently having issues managing and disposing of solid waste, which is often a result of a lack of landfill space. An increasing human population, increased migration, and urbanization all result in increased creation of solid waste. According to the study [13] of just 10% of South Africa's recyclable materials were recycled in 2011, and the technique of sorting at the source is still relatively new. Yet, 90% of all recycling done in South Africa is done as part of the country's thriving informal economy [14].
This study is based in the O.R Tambo District Municipality in the Eastern Cape, which oversees managing of MSW from five local municipalities (Mhlontlo, King Sabata Dalindyebo (KSD), Nyandeni, Port St. Johns (PSJ), and Ingquza Hill. The O.R. Tambo District Municipality initiated and is carrying out the regional recycling initiatives as part of the implementation of its Integrated Waste Management Plan (IWMP). There are recycling buy-back centers in each of the five local municipalities that make up the OR Tambo District Municipality. The waste produced by these buy-back centers is what is delivered to the local recycling plant in Qumbu, Eastern Cape. This recycling plant has been operational since 2017. By connecting waste management and recycling businesses in the informal sector, the regional recycling project aims to increase both formal and informal employment along the recycling supply chain. In addition, the regional recycling project aids in reducing the amount of waste sent to landfills.
The purpose of this study was to determine if there were seasonal variations in the amount of each waste type (aluminium cans, bottles, cardboards and plastics) recovered in the O.R. Tambo District Municipality. In addition, the study examined whether there were differences between local municipalities regarding the various categories of waste recycled in the study area. Municipal authorities must understand how the temporary solid waste storage sites are spatially distributed within their area of jurisdiction in order to design policy implementation strategies for solid waste management. Secondly, this is important as it provides the authorities with a clear picture on how to draw the budget. Lastly,the information gathered may be helpful in determining the best approach to reduce the amount of waste that must be delivered to the landfill site. In addition, the study compared the amount of each waste type recovered among the five local municipalities (Ingquza Hill, King Sabatha Dalindyebo, Mhlontlo, Nyandeni and Port St. Johns (PSJ). Our first research hypothesis is that the amount of waste produced in each waste type will remain constant over the different seasons. The second hypothesis is that the amount of waste produced in each type will remain constant across the local municipalities.
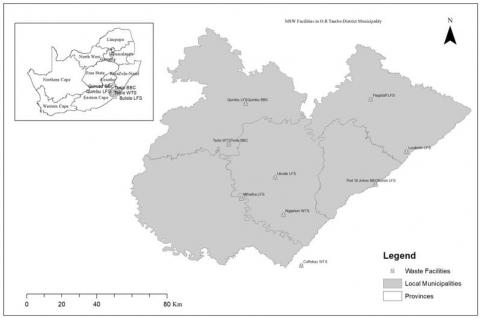
The study was conducted in the O.R. Tambo District Municipality (ORTDM), Eastern Cape, South Africa (Figure 1). The district is located along the Indian Ocean's up to 160 kilometres from the shoreline [15]. The district has five local municipalities as shown in Figure 1 with a total geographical area of 15946.84 km2 [15]. O.R Tambo District Municipality is located between 32°46'31"S and 21°23'29"E [16]. The O.R. Tambo District Municipality is a Category C2 municipality, which denotes a predominately rural character and a low pace of urbanization [17]. Its climatology is characetrized by high humidity and a lot of rain during the summer. There are pockets of hilly terrain and subtropical coasts in the district that experience moderate to high rainfall [18]. The O.R. Tambo area experiences mild, moderate weather that is primarily frost-free. The temperatures in this district range from 16 to 28℃ in summer and from 7 to 20℃ in winter.
Figure 1. Geographic location of O.R Tambo District Municipality, Eastern Cape Province, South Africa and the waste management facilities within the O.R Tambo District Municipality
Using monthly amount of waste recovered, this study used a quantitative technique to investigate the amount and seasonal variation of solid waste recovered in the five local municipalities of the O.R. Tambo district. The amount of waste recovered in these five local municipalities-Mhlontlo, King Sabata Dalindyebo, Nyandeni, Port St. Johns, and iNgquza Hill-between September 2019 and August 2021 was the sample of interest. The study sample consists of various monthly waste amount recovered materials, including aluminium cans, cardboard, bottles, and plastics. The environmental management unit of the O.R. Tambo District Municipality provided access to monthly waste amount records for the study. There are buy-back centers (two in Nyandeni, three in Mhlontlo, three in KSDLM, one in PSJLM and two in iNgquza hill) in each local municipality that purchase, manually sorted waste. Upon purchasing waste from waste pickers, each buyback center use scale to weigh the amount of waste purchased and document such records for reporting purposes to the local municipality, which then compiles and reports this information to the O.R Tambo district municipality. For each season, there were six (three for each year) records for each waste type and at each municipality.
3.1 Data analyses
Each type of waste was analysed separately to determine if season affects the recovery of different types (aluminium cans, bottles, cardboards, and plastics) of waste differently Two-way analysis of variance (ANOVA) in the statistical package for social scientists (SPSS) version 28 was used to identify if there is variation in the amount of waste recovered across season and local municipalities. In addition, the output of the two-way ANOVA produced the effect of interaction between seasons and local municipalities on the amount of waste recovered per waste type.
A total of 2,023,593 tonnes of recovered municipal solid waste from 480 records in all the four seasons and local municipalities was recorded. The total amount of cardboards recovered accounts for 80.33% of the total amount recovered, followed by plastics (18.296%), while the aluminium cans (1.072%) and bottles (0.302%) had the lowest amount.
4.1 Inter analysis
4.1.1 Metallic cans
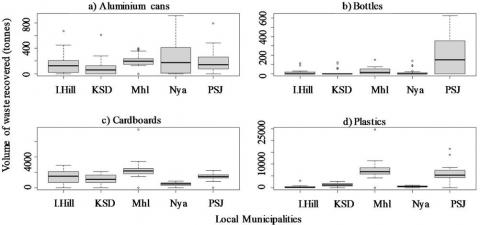
Local municipalities had a significant impact on the amount of waste recovered (F=2.672, p=0.036). This then means that the null hypotheis is rejected and the alternate hypothesis is accepted implying that there is a statistically significant differences in amount of metalic cans that are recycled across the different local municipalities. However, significant differences were detected between the Nyandeni and KSD local municipalities only, with greater amount in Nyandeni (Table 1 and Figure 2a). Nyandeni LM generates more aluminium waste than KSDLM because KSDLM has more different waste categories, making it easier for them to fulfil their monthly targets through those other types of waste as contrasted to Nyandeni LM, which has lesser amount than KSDLM owing to its population size. As such, Nyandeni LM must pay attention to all the different types of waste in order to achieve its monthly targets hence the amount of aluminium is greater. It should be emphasized that there are various recycling initiatives in KSDLM, most of which sell their products outside the region rather than to the regional facility. As a result, KSDLM has recovered fewer metallic cans. The transport that is regularly available near KSDLM (N2) and transports recyclables to Durban, where waste is more expensive, can be blamed for this. Similarly, Tembani et al. [18] also noticed the transportation of metallic waste to Durban, where it is sold at a higher price as compared to the local markets. The amount of waste taken beyond the region, however, had no impact on the study's findings because the study only looked at the amount of waste recovered and processed within the region.
The quantity of aluminium cans recovered at KSD local municipality was comparable to that in the other three municipalities (Table 1). This condition can be attributable to the monthly targets that the buy-back centres must meet each month. As a result, waste pickers collect waste regardless of the season but instead concentrate on meeting their monthly targets. The season (F=1.561, p=0.204) and its interaction with local municipalities (F=0.256, p=0.994) had no impact on the amount of waste from aluminium cans. This can be explained by the fact that most metal waste pickers tend to take their waste to outside the region and therefore, there is tight competition for this type of waste. These findings concur with the findings of Kamran et al. [3], Mshelia [19] and Wani and Shah [20].
Table 1. Two-way ANOVA posthoc multiple comparison results for different waste types recovered in local municipalities within the O.R Tambo District Municipality
|
|
Aluminium Cans |
Bottles |
Cardboards |
Plastics |
|
Paired Municipalities |
p |
p |
p |
p |
|
Mhlontlo, Ingquza Hill |
0.98 |
0.98 |
0.004 |
<0.001 |
|
Mhlontlo, KSD |
0.53 |
0.97 |
<0.001 |
<0.001 |
|
Mhlontlo, Nyandeni |
0.65 |
0.99 |
<0.001 |
<0.001 |
|
Mhlontlo, PSJ |
0.74 |
<0.001 |
<0.001 |
0.45 |
|
PSJ, Ingquza Hill |
0.96 |
<0.001 |
0.99 |
<0.001 |
|
PSJ, KSD |
0.99 |
<0.001 |
1.00 |
<0.001 |
|
PSJ, Nyandeni |
0.08 |
<0.001 |
0.99 |
<0.001 |
|
Ingquza Hill, KSD |
0.85 |
1.00 |
0.98 |
0.86 |
|
Ingquza Hill, Nyandeni |
0.31 |
1.00 |
0.945 |
1.00 |
|
KSD, Nyandeni |
0.03 |
1.00 |
1.00 |
0.90 |
Significant p-values are bold. KSD–King Sabatha Dalindyebo, PSJ–Port St. Johns
4.1.2 Bottles
The amount of waste recovered varied significantly (F=14.23, p<0.001) between municipalities. This indicates that the null hypothesis is rejected and the alternative hypothesis is accepted, implying that there is a statistically significant difference in the quantity of recycled bottles between the different local municipalities. Port St. Johns local municipality had significantly higher amount of recovered bottle waste than all other municipalities (Table 1 and Figure 2b). Similar amount of waste was recorded in the other four municipalities (Table 1 and Figure 2b). These variances can be attributed to the fact that Port St. Johns is a tourist-friendly coastal town. As a result, tourists are likely to be the contributing factor to the significant higher amount of bottles that are recovered in the municipality. Generally, tourists purchase packages of food and alcoholic beverages which may lead to an increased bottle waste. These results are similar to those of a study conducted by Mshelia [19], which discovered that during months with a high number of tourists, MSW, such as aluminium cans and glass bottles,which are indicative features of heavy tourist activities, increased.
The amount of waste recovered did not differ significantly across seasons (F=1.30, p=0.28). Similarly, the interaction between seasons and local municipality also had no impact on the amount of bottle waste recovered (F=0.34, p=0.98). These outcomes contrast with those of Wani et al. [20-22], who discovered statistically significant outcomes for bottles in their studies. The fact that autonomous buy-back centers with just financial gain as their motivation champion the waste recovery process in the district may be the main reason for the lack of significant seasonal variation in waste recovered in O.R. Tambo District Municipality. Since waste recovery is their only source of income and, coupled by the need for buyback centers to meet their monthly quotas, waste pickers have to continuously chase their monthly targets.
4.1.3 Cardboard
Different local municipalities of O.R. Tambo District Municipality recovered significantly different amount of cardboard waste (F=6.736, p<0.001). The Mhlontlo local municipality recovered significantly greater amount of cardboard waste than other local municipalities (Table 1 and Figure 2c). Similarities in the amount of cardboard waste recovered from KSD, PSJ and Nyandeni local municipalities were observed (Table 1). These findings concur with other findings [3, 19, 20].
The amount of waste recovered did not statistically differ across the four seasons (F=0.630, p=0.597). Additionally, the interaction between seasons and local municipality had no effect on the amount of cardboard waste recovered (F=0.246, p=0.995). A regional recycling facility is present in this municipality, which can be a motivator for waste pickers since they do not have to travel far to sell their products, thus similarities in the amount recovered across seasons. This is just one of many factors explaining why Mhlontlo local municipality recovers significantly more cardboard waste than other local municipalities. Second, unlike other types of waste, cardboard waste is purchased by an organization called South African Pulp and Paper Industries (SAPPI) that provides waste pickers with bailing equipment and storage facility. Lastly, cardboard waste requires less effort when it comes to packaging because it is not distinct like other types of waste that need to be separated and sorted into different waste categories.
4.1.4 Plastics
The amount of plastic waste recovered in the five local municipalities of O.R Tambo district varied significantly (F=25.258, p<0,001). These findings concur with those of Kamran et al. [3, 4, 21, 22], who also discovered statistically significant variations in the amount of plastic waste recovered throughout the course of the year. However, these findings demonstrate a divergence from Ayeleru et al. [23], who discovered that there was no statistically significant differences in the amount of waste recycled in Johanesberg. Greater amount of plastic waste was recovered at Mhlontlo and Port St. Johns local municipalities compared to the other three municipalities (Table 1 and Figure 2d). Similar amount of plastic waste was recovered at Ingquza Hill, KSD, and Nyandeni local municipalities (Table 1 and Figure 2d). The fact that Port St. Johns is a coastal town with a high tourist population can be used to explain why there is more plastic waste there. Second, tourists typically buy beverages and water which are typically packaged on plastic materials. On the other hand, since Mhlontlo is the municipality with the regional facility, even the adjacent municipalities without a recycling facility are likely to bring their waste there.
The season (F=0.437, p=0.727) and its interaction with local municipalities (F=0.463, p=0.932) had no effect on the amount of plastic waste recovered. These findings contrast with those of Kamran et al. [3, 4, 24], who found seasonal variations in MSW where MSW showed considerable variance due to changes in inhabitants' lifestyles and consumption patterns over the year.
4.2 Intra analysis
No waste category revealed a significant difference when data were analysed for each municipality (Table 2). This indicates that the null hypothesis is retained and the alternative hypothesis is rejected, implying that there is no statistically significant difference in the amount of wasteacross the municipalities. These findings concur with those of Ayeleru et al. [23], who found no statistically significant seasonal changes in their findings and with those of Mbande [24], who also discovered that the change is season did not have any influence on waste generation, and composition. Even while we anticipated considerable differences in results by season, for instance, given that Port St. Johns is a coastal town and tourist location, one may anticipate an increase in summer tourists who consume a lot of beverages and generate more waste from both metal and bottles. These outcomes may be explained by the fact that waste collection is the waste pickers' only source of income. As a result, they put forth their best effort throughout the year and accomplish their monthly targets in order to earn enough money. Additionally, since the waste pickers' lifestyle and consumption patterns remain unchanged, the amount of waste recovered is unaffected. However, Schenck et al. [25] confirm that meteorological circumstances like rain and extremely high or low temperatures have a direct impact on the waste picking operations. For instance, waste pickers' productivity is negatively impacted by summertime heat. The study findings show that despite the weather, waste pickers continue to work at their recycling facilities because they see these facilities as the source of their livelihood. Additionally, waste pickers work continuously at their stations to support their families. These results are in agreement with the study of Schenck et al. [25]. However, the findings of the studies Kamran et al. [3, 4, 19, 20, 21, 22], who found that seasons had an impact on the amount of waste generated and recovered, contrast with our findings. In Parkistan, for instance, Kamran et al. [3] discovered statistically significant seasonal changes for paper and plastic. Similarly, in Nigeria, Mshelia [19] found that the seasons had a substantial impact on the amount of solid waste produced. The amount of plastics produced and collected in India increased over the summer while the amount of plastics showed an increase in monsoon season [21]. Singhal et al. [4] also noticed a seasonal variation in the MSW composition, in Guwahati city,India, with plastics showing a substantial variation with the maximum amount during the wet summer. This scenario was linked to the shift in the city's population consumption patterns throughout the year.
Table 2. One-way ANOVA results for different waste types recovered within each of the local municipalities of O.R Tambo District Municipality
|
|
|
SS |
df |
MS |
F |
p |
|
Ingquza Hill |
Cardboards |
98792890.11 |
3 |
32930963.37 |
0.48 |
0.70 |
|
Aluminium |
1077396.68 |
3 |
359132.23 |
0.94 |
0.44 |
|
|
Plastics |
36774.658 |
3 |
12258.22 |
0.43 |
0.73 |
|
|
Bottles |
2505.79 |
3 |
835.26 |
1.03 |
0.40 |
|
|
KSD |
Cardboards |
118136482.34 |
3 |
39378827.45 |
1.17 |
0.35 |
|
Aluminium |
2180974.67 |
3 |
726991.56 |
1.59 |
0.22 |
|
|
Plastics |
40312.77 |
3 |
13437.59 |
0.76 |
0.53 |
|
|
Bottles |
5049.00 |
3 |
1683.00 |
1.41 |
0.27 |
|
|
Mhlontlo |
Cardboards |
638949922.61 |
3 |
212983307.54 |
1.38 |
0.28 |
|
Aluminium |
23119932.61 |
3 |
7706644.20 |
0.39 |
0.76 |
|
|
Plastics |
9254.52 |
3 |
3084.84 |
0.22 |
0.88 |
|
|
Bottles |
8024.79 |
3 |
2674.93 |
2.22 |
0.12 |
|
|
Nyandeni |
Cardboards |
11507444.50 |
3 |
3835814.83 |
0.53 |
0.67 |
|
Aluminium |
318717.57 |
3 |
106239.19 |
1.19 |
0.34 |
|
|
Plastics |
68656.44 |
3 |
22885.48 |
0.27 |
0.85 |
|
|
Bottles |
11044.00 |
3 |
3681.33 |
3.82 |
0.03 |
|
|
PSJ |
Cardboards |
11479027.13 |
3 |
3826342.38 |
0.148 |
0.93 |
|
Aluminium |
17161587.93 |
3 |
5720529.31 |
0.45 |
0.72 |
|
|
Plastics |
76718.73 |
3 |
25572.91 |
0.74 |
0.54 |
|
|
Bottles |
45860.46 |
3 |
15286.82 |
0.37 |
0.78 |
Figure 2. Boxplot showing amount of waste recovered in the five local municipality of O.R Tambo District Municipality. KSD - King Sabatha Dalindyebo, PSJ - Port St. Johns
The purpose of the study was to determine whether the varying seasons have an impact on waste recovery between and within the local municipalities in the O.R. Tambo District Municipality in South Africa's Eastern Cape province. The study's findings showed that there were statistically significant differences in the amounts of metal cans between Nyandeni and KSDLM, with a higher amount in Nyandeni. There was no effect of the season or its interaction with the neighbourhood municipality on the amount of aluminium cans recovered. The amount of waste recovered in the form of bottles varied considerably, with PSJLM having the most recovered bottles of any LM while the amount of bottles did not differ significantly across seasons. The study's findings also indicated that recovered cardboard waste had a statistically significant amount, with Mhlontlo LM having the highest amount of cardboard compared to other LMs. The amount of cardboard recordings didn't vary significantly from season to season. In the case of plastics, the amount recovered varied greatly between municipalities, with Mhlontlo and PSJ LMs recovering the most plastic waste in comparison to other LMs, while the interplay of seasons had little bearing on the amount of plastic waste collected in different LMs.
In order to ensure that waste pickers have a balanced source of income throughout the year rather than focusing on one particular season, it is advised that the government authorities spread out their support for the waste pickers throughout the year. The lack of seasonal variation in the quantity of waste recovered in the study area supports this conclusion. This implies that waste pickers, as the key players in waste recovery, work tirelessly throughout the year, hence the year-round call for support. Additionally, the study's findings showed that, in comparison to other waste types, cardboard is the waste category that is recovered the most frequently in the O.R. Tambo District Municipality. This can be attributed to the support that the waste pickers receive from the market, particularly from SAPPI. As a result, it is also advised that the government authorities find a way to enlist the aid of other private organizations to assist the waste pickers. Lastly, it is advised that the local authorities establish waste processing firms inside the study region so that waste collectors do not need to travel beyond the area in search of highly compensated recycling businesses. The establishment of waste processing facilities in the region will not only aid in resolving waste management-related issues, but will also contribute to the growth of the local economy.
Data will be made available upon request only for academic purposes.
We would like to thank Mr. Siyakubonga Buso of O.R Tambo District Municipality for his continued support and assistance. Also thank Dr. Inam Yekwayo and Mr Onke Xayimpi for their professional assistance and willingness to assist in shaping this work.
[1] Alam, P., Mazhar, M.A., Khan, A.H., Khan, N.A., El Din Mahmoud, A. (2021). Seasonal characterization of municipal solid waste in the city of Jammu, India. In IOP Conference Series: Materials Science and Engineering, 1058(1): 012061. https://doi.org/10.1088/1757-899X/1058/1/012061
[2] Cheela, V.R.S., Goel, S., John, M., Dubey, B. (2021). Characterization of municipal solid waste based on seasonal variations, source and socio-economic aspects. Waste Disposal & Sustainable Energy, 3: 275-288. https://doi.org/10.1007/s42768-021-00084-x
[3] Kamran, A., Chaudhry, M.N., Batool, S.A. (2015). Effects of socio-economic status and seasonal variation on municipal solid waste composition: A baseline study for future planning and development. Environmental Sciences Europe, 27: 1-8. https://doi.org/10.1186/s12302-015-0050-9
[4] Singhal, A., Gupta, A.K., Dubey, B., Ghangrekar, M.M. (2022). Seasonal characterization of municipal solid waste for selecting feasible waste treatment technology for Guwahati city, India. Journal of the Air & Waste Management Association, 72(2): 147-160. https://doi.org/10.1080/10962247.2021.1980450
[5] Etengeneng, D. (2012). Municipal solid waste management in Grahamstown. Thesis, Novia University of Applied Sciences, Novia.
[6] Biswas, A.K., Kumar, S., Babu, S.S., Bhattacharyya, J.K., Chakrabarti, T. (2010). Studies on environmental quality in and around municipal solid waste dumpsite. Resources, Conservation and Recycling, 55(2): 129-134. https://doi.org/10.1016/j.resconrec.2010.08.003
[7] Denafas, G., Ruzgas, T., Martuzevičius, D., Shmarin, S., Hoffmann, M., Mykhaylenka, V., Ogorodnik, S., Romanov, M., Neguliaeva, E., Chusov, A., Turkadze, T., Bochoidze, I., Ludwig, C. (2014). Seasonal variation of municipal solid waste generation and composition in four East European cities. Resources, Conservation and Recycling, 89: 22-30. https://doi.org/10.1016/j.resconrec.2014.06.001
[8] Serge Kubanza, N. (2021). The role of community participation in solid waste management in Sub-Saharan Africa: A study of Orlando East, Johannesburg, South Africa. South African Geographical Journal, 103(2): 223-236. https://doi.org/10.1080/03736245.2020.1727772
[9] Wilson, D.C., Velis, C.A. (2014). Cities and waste: Current and emerging issues. Waste Management & Research, 32(9): 797-799. https://doi.org/10.1177/0734242X14547125
[10] Serge Kubanza, N., Simatele, M.D. (2020). Sustainable solid waste management in developing countries: A study of institutional strengthening for solid waste management in Johannesburg, South Africa. Journal of Environmental Planning and Management, 63(2): 175-188. https://doi.org/10.1080/09640568.2019.1576510
[11] Mazhandu, Z.S., Muzenda, E., Belaid, M., Mamvura, T.A., Nhubu, T. (2021). A review of plastic waste management practices: What can South Africa learn? Advances in Science, Technology and Engineering Systems Journal, 6(2): 1013-1028. https://dx.doi.org/10.25046/aj0602116
[12] Niyobuhungiro, R.V., Schenck, C.J. (2022). A global literature review of the drivers of indiscriminate dumping of waste: Guiding future research in South Africa. Development Southern Africa, 39(3): 321-337. https://doi.org/10.1080/0376835X.2020.1854086
[13] Mohee, R., Simelane, T. (2015). Future Directions of Municipal Solid Waste Management in Africa. Africa Institute of South Africa.
[14] Kuleyin, A., Nalkiran, M. (2020). Investigation of municipal waste characterization and alternative disposal methods in Trabzon and Rize city centres. International Journal of Environmental Pollution and Environmental Modelling, 3(2): 41-48.
[15] Morgan, J.W., Fensham, R.J., Godfree, R., Foreman, P.W. (2017). Australian Tussock Grasslands. Australian Vegetation, 438. Cambridge University Press, Cambridge.
[16] Mlanjeni, N.L. (2014). Identification and documentation of ethnobiological methods used by rural farmers to control stalk borers on maize in the Eastern Cape province of South Africa. Department of Botany, Faculty of Science and Agriculture, University of Fort Hare.
[17] Nkamisa, M., Ndhleve, S., Nakin, M.D., Mngeni, A., Kabiti, H.M. (2022). Analysis of trends, recurrences, severity and frequency of droughts using standardised precipitation index: Case of OR Tambo District Municipality, Eastern Cape, South Africa. Jàmbá Journal of Disaster Risk Studies, 14(1): 1147. https://doi.org/10.4102/jamba.v14i1.1147
[18] Tembani, N., Nakin, M.D., Magayiyana, Z., Mngeni, A. (2022). Analysis of waste volume and type generated in or Tambo District Municipality, South Africa. Ecology and the Environment, 260: 415-424.
[19] Mshelia, A.D. (2015). Seasonal variations of household solid waste generation in Mubi, Nigeria. International Journal of Innovative Education and Research, 3(5): 115-124.
[20] Wani, M.A., Shah, S.A. (2013). Magnitude and seasonal variations of solid waste generation in tourist accommodation of Dal Lake. International Journal of Environmental Sciences, 2(1): 57-62.
[21] Gidarakos, E., Havas, G., Ntzamilis, P. (2006). Municipal solid waste composition determination supporting the integrated solid waste management system in the island of Crete. Waste Management, 26(6): 668-679. https://doi.org/10.1016/j.wasman.2005.07.018
[22] Cheela, V.R.S., Goel, S., John, M., Dubey, B. (2021). Characterization of municipal solid waste based on seasonal variations, source and socio-economic aspects. Waste Disposal & Sustainable Energy, 3: 275-288. https://doi.org/10.1007/s42768-021-00084-x
[23] Ayeleru, O.O., Okonta, F.N., Ntuli, F. (2018). Municipal solid waste generation and characterization in the City of Johannesburg: A pathway for the implementation of zero waste. Waste Management, 79: 87-97. https://doi.org/10.1016/j.wasman.2018.07.026
[24] Mbande, C. (2003). Appropriate approach in measuring waste generation, composition and density in developing areas. Journal of the South African Institution of Civil Engineering, 45(3): 2-10.
[25] Schenck, C.J., Blaauw, P.F., Swart, E.C., Viljoen, J.M., Mudavanhu, N. (2019). The management of South Africa’s landfills and waste pickers on them: Impacting lives and livelihoods. Development Southern Africa, 36(1): 80-98. https://doi.org/10.1080/0376835X.2018.1483822