Asia Akter*![]() | Mokter Hossain
| Mokter Hossain![]() | Redwan Ahmad Khan
| Redwan Ahmad Khan![]() | Mohammed Abul Faiz
| Mohammed Abul Faiz
© 2023 IIETA. This article is published by IIETA and is licensed under the CC BY 4.0 license (http://creativecommons.org/licenses/by/4.0/).
OPEN ACCESS
Hazaribagh is a major source of pollution and a center for the leather industry in Bangladesh. It is home to 1.2 million people and has 185 shoe factories. People who live in Hazaribagh consume surface water and groundwater for drinking and household activities. Implementation of a new law and government pressure has forced several tanneries to shift to areas allocated to industrial parks, but many others have remained. Our research set out to determine the impact of the tanning process on the surface water and groundwater of this area. In this study, surface and groundwater samples (a total of 42) from 6 different points around the tannery complex were analyzed during December 2019 and August 2020 in dry and rainy seasons, respectively. Our main purpose of this study was to find out the quality of the surface and groundwater in the sampling area, as well evaluate the seasonal change of different parameters. During the sampling, we set a route from the tannery source points to the Buriganga River, which is where the tannery effluents end up. The water’s chemical and physicochemical parameters were measured in accordance with the accepted protocol. Our main concern was the presence and concentration of heavy metals which were found to be significantly higher in the first three sampling locations. We also found that heavy metal concentrations dropped dramatically from the river’s upstream source to its final destination, the river Buriganga. Increasing distance from the source site and wastewater percolation to groundwater via soil may have caused this geographical variation in metal concentration. Although, rainwater may have diluted heavy metal concentrations, their levels were still above the permissible level. Heavy metals and other physicochemical parameters, like pH, DO, BOD, TDS, TSS, EC, Cl, and Na, were found in all surface and groundwater samples above national (DoE) and international (WHO) standards.
tannery industries, heavy metal pollution, surface water, groundwater pollution, tannery effluents
The leather sector is one of the promising sectors of Bangladesh and one of the most important foreign exchange income in Bangladesh. The Government of Bangladesh (GoB), and the Ministry of Industry (MoI), have designated it as a priority sector due to the fact that it is a value-added sector. In Bangladesh, tannery industries occupy 3% of all industries [1]. Hazaribagh is the largest tannery hub in Bangladesh, located in the western part of Dhaha city, the capital of Bangladesh. Although 185 leather-processing plants [2] are located here, it is still considered as a residential area as most leather-processing workers and staff live there. This particular region is well-known for its tannery businesses and is ranked fifth among the world’s 10 most polluted locations [3]. More than 70% of tanneries in Bangladesh are located at Hazaribag, while the rest of the tanneries are scattered all over the country [4].
Leather tanning is a completely wet process that needs a lot of water. Almost 90% of the water used in the process turns into wastewater [5]. The process of tanning involves transforming hides and skins into leathers with specific physical, chemical, and biological qualities so that they can be used for everyday use and by industries. A number of orderly steps, including soaking, liming, deliming, bating, pickling, tanning, neutralization, fat-liquoring, finishing, etc. are used to turn this operation. The water becomes murky when lime, hair, skin, etc. are present.
There are two types of tanning processes: vegetable tanning and chrome tanning. However, the most common tanning process in Bangladesh is chrome tanning. Most tanneries generate chrome-tanned leather, which results in the discharge of a substantial amount of Cr via the effluents. In chrome tanning, a full tannage requires 0.2% or more of the hide’s weight in chromium, and the fixing rate of the Cr is about 60-70%. Cr is used to tan 80-90% of the world’s leather today.
Huq [6] claims that several chemicals are employed in the chrome tanning process of hides and skins for soaking, tanning, and post-tanning. Na2SO3, Cr2(SO4)3, Na₂CO3, CaO, NH4NO3, NH4Cl, and enzymes are the principal compounds used. Other chemicals include CH2O, Na2S, NaCl, H2SO4, CH2O2, HCOONa, and NaHCO3 as well as vegetable tannins and resins. Leather only absorbs about 20% of the massive quantities of chemicals required in the tanning process; the remainder is discharged as waste [7].
The production of tanned and untanned leather uses a lot of water, and the associated solid waste and liquid effluents are a substantial source of organic load, salts, and Cr (40-25,000 mg/L) that are released into the environment. Suspended solids (SS), NO3- sulfate, sulfide, and Cr are common pollutants found in tannery effluent that are directly discharged into an aqueous system in most developing countries without any treatment [8]. Water systems with high concentrations of total dissolved solids (TDS), biological oxygen demand (BOD), and chemical oxygen demand (COD) place aquatic species under stress [9]. Dissolved organic matter breaks down into cations and anions and changes the basic composition of water [10].
In Hazaribagh, the majority of liquid sewage is discharged into natural water bodies directly or indirectly, with little or no treatment. The Hazaribag tannery effluents discharged into the canal (from the southeast) are ultimately discharged into the Buriganga river, located at the northeastern corner of the study area [11]. Through open drains, the leather processing plants discharge solid and liquid waste either directly or indirectly to low-lying areas, rivers, and natural canals without sufficient treatment. The water in the low-lying regions close to Hazaribagh, which has a direct connection to the Buriganga river, is so contaminated that it is no longer fit for public use for general purposes [2]. Along with animal flesh and dissolved hair and lipids, this water also contains lime, hydrogen sulfide, chromium sulfate, sulfuric and formic acids, colors, oils, and a variety of heavy metals utilized in the tanning process. This water eventually flows into the Buriganga River and eventually settles in the low area of Hazaribagh, causing severe deterioration of the surface and groundwater quality [12].
Direct disposal of these pollutants has contaminated ground and surface water with Pb, Cd, As, and dangerously high levels of Cr. Because of pollution in rivers, these chemicals can bioaccumulate in fish and shellfish, which are important sources of food for people in the area [11]. In addition, the BOD in the river tends to increase, thus depriving aquatic life of oxygen [13]. Not only are the water, soil, and plants in this area at high risk of heavy metal pollution, but Mondol et al. [14] found that soil and plant samples have concentrations of heavy metals that are over the maximum acceptable concentration. At a greater distance from the primary disposal point, the concentration was found to decrease steadily. The main disposal point at the Buriganga river has an exceptionally high quantity of Cr. A similar pattern of results was observed with plant specimens. When contaminated sewage is used to irrigate agricultural land, the metals may accumulate there and then bio-concentrate in the edible plants and feed [12]. Moreover, tiny pieces of leather, hair, flesh, and liquid and solid wastes generated in various stages of the tanning process are thrown and piled up all over the Hazaribagh area, and are often used as fish feed ingredients [15].
Living in the Hazaribagh area is challenging due to the unpleasant visual and olfactory effects of tanning activities. The tanneries produce a great deal of waste, both solid and liquid. Every day, the tanneries in Hazaribagh make about 75 metric tons of solid waste, mostly salt, bones, and leather shavings and trimmings, and about 21,600 cubic meters of liquid waste that is bad for the environment. According to the WHO in 2001, more than 8,000 Hazaribag tannery workers have gastrointestinal, dermatological, and other illnesses, and 90% of them passed away before the age of 50.
Our study’s primary objective was to determine the impact of the tanning process in the quality of the surface water and groundwater of this tannery processing area as well as to evaluate the seasonal of different physical, chemical, and physio-chemical parameters of surface and groundwater due to the tanning process.
2.1 Sampling of surface and groundwater
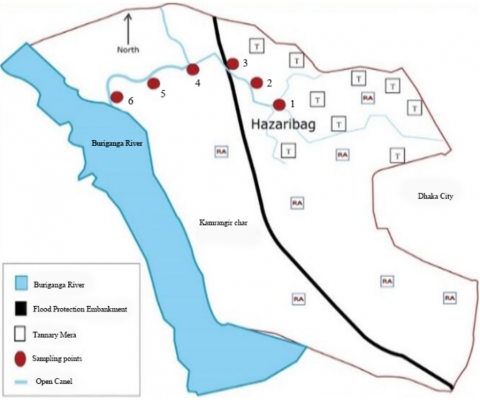
Six sampling points were chosen based on the assumption of pollution intensity. The first three points were located inside, and the remaining three were outside the flood protection embankment of Dhaka. Point I was considered to be the main disposal point of tanneries, and the increasing numbers of the points are indicative of increasing distance from the main disposal point. Water samples were collected from the study area in two phases, December 2019 (dry season) and August 2020 (rainy season). Samples were collected once per season with three replications of each sampling site. The sampling points were kept fixed throughout the whole sampling period. The sampling points were Geo-referenced with GPS (Geographical Positioning System) and marked on the map. GPS locations of sampling points are given in Table 1. The location map of the study area and sampling location is shown in Figure 1 and Figure 2. 500 mL water samples (with three replications) were collected from each site in sterilized plastic bottles fitted with a liquid-tight stopper. Groundwater samples were collected only from DTW, Deep Tube Well (>150 meters), located at sampling point IV. The water samples were immediately acidified with 4 mL of concentrated hydrochloric acid (HCl) per liter and analyzed within seven days of collection.
Table 1. Sampling point location by GPS for both dry and rainy seasons
|
Sampling Point No. |
Northings |
Eastings |
|
I |
23044.013’N |
90021.807’E |
|
II |
23041.156’N |
90021742’E |
|
III |
23044.552’N |
90021.604’E |
|
IV+GW |
23044.673’N |
90021.549’E |
|
V |
23044.600’N |
90021.279’E |
|
VI |
23044.501’N |
90021.109’E |
Figure 1. The sampling sites
Figure 2. Change of Cr (ppm) at sampling points in dry and wet season
2.2 Analytical procedure
The pH of all samples was measured with an HI-2211 meter (Hanna Instrument). Electrochemical techniques with an electric probe were used to determine DO and BOD levels (Hanna HI 98193). The concentration of chloride was determined using a titration procedure. Nitrates (NO3-) in water were quantified utilizing the micro Kjeldahl distillation technique [13]. After digesting the water sample with the HNO3 - HClO4 (1:3) combination, turbidimetry at 769 nm [14] was used to assess the potassium concentration. Atomic absorption spectrometer (AAS) readings were used to identify sodium (Na+) and potassium (K+). The titrimetric EDTA (Ethylene di amine tetra acetic Acid) method was used to determine the concentrations Ca2+, Mg2+. Electrical conductivity was determined by means of an EC meter (HI98301 DiST1). The Cl- concentration was determined by titration [15]. A turbidity meter was used to assess the level of turbidity in the sampled water (LUTRON TU-2016). Using a gravimetric method that involved evaporating 20 mL of water sample at 110℃, the total soluble salts (TSS) in the water were found to be in the range of mg kg-1. The redox potential (Eh) of the water samples was determined with the help of a redox meter (PCE PH-30). Heavy metals (Cr6+, Zn2+, Pb2+, Cd2+, Mn4+, Fe2+ and Ni) were analyzed by using an atomic absorption spectrophotometer (Model no AA421) [16].
2.3 Data analysis
Data analysis was done using Microsoft Office Excel 2007 and SPSS software. The tests of significance of different sampling points were calculated at Duncan’s Multiple Range tests (DMRT) at a 5% level. For the posthoc test, Tukey's Honestly Significant Difference (HSD) was done after ANOVA to test multiple hypotheses and to compare the result of each sampling site. Posthoc results are shown as Compact Letter Display (CLD) (a, b, c, d, etc.). Groups that share the same letter are not statistically significantly different from each other based on the significance level. On the other hand, groups with different letters are significantly different from each other.
3.1 Surface and groundwater chemical and physicochemical characteristics
Surface and groundwater chemical and physicochemical characteristics are shown in Table 2. For both the dry and rainy seasons, the pH ranged from 6.23 to 7.83 and from 6.77 to 8.15, respectively, which is well within the acceptable range set by authorities. pH values were stable throughout both the dry and wet seasons [17, 18]. While it was raining at Point III, the pH level hit 8.15. There is a correlation between the CO2 and pH [19]. The study of the quality of wastewater at different sampling spots during the dry and rainy seasons showed that tannery wastes heavily polluted the water and the Buriganga river water, so much so that the DO of the wastewater samples was found to be zero during the dry season and no fish or other aquatic life was found living up to 500 m downstream of the sluice gate. DO was found to be below the standard limit in all samples [17, 18].
During the dry season, the DO at sampling site I was low at 0.00 mg/L, but which increased to 0.65 mg/L during the wet season. The DO level in groundwater changed between 3.90 mg/L and 1.2 mg/L in dry and rainy season respectively.
This study found that the correlation between BOD and DO was negative. Total dissolved oxygen (DO) in the water was reduced due to the high BOD concentrations, making the water unfit for fishing [20]. The BOD exceeds the Maximum Allowable Concentration (MAC) at every sampling site [17, 18]. The BOD during the rainy season was 217 mg/L, while during the dry season it was only 150 mg/L. It is possible that warmer temperatures during the monsoon season have led to greater microbial activity, which in turn requires more oxygen to digest effluents from factories, tanneries, and households
The amount of calcium ion (Ca2+) that is present in the effluent that is produced by the Hazaribag tannery varies from 0.2 mg/L all the way up to 4.9 mg/L depending on the season. Mg2+ values ranged from 0.03 to 2.6 mg/L throughout the entire year, regardless of whether it was dry or wet. During the dry seasons, the content of Na+ in the wastewater ranged from 9.0 to 100.2 mg/L, while during the rainy seasons, it was closer to 100.2 mg/L. It was discovered that the concentrations of Ca2+, Mg2+, and Na+ were all higher during the wet season as compared to the dry season. During the course of this examination, the concentrations of K+, Ca2+ and Mg2+ were all found to be 10 mg/L [17, 18].
Most of the samples in this investigation, with the exception of groundwater, had high Na+ content. The Cl- concentration in wastewater fluctuated between 18 and 895 mg/L during dry and wet seasons, respectively. There is a lack of understanding on the effect that chloride has on aquatic ecosystems. Biota are negatively affected by elevated concentrations of any ion. Cl-levels >250 mg/L were found in the water, with the exception in groundwater of deep tube well DTW (18 and 11 mg/Lin dry and wet season, respectively) [19]. Possible causes include sewage and tannery effluents. Monsoon rain dilute rainfall or less tannery effluents from enterprises at the time of sampling likely explain the dramatic drop in Cl-concentration in rainy season wastewater.
During the dry seasons, the total dissolved solids (TDS) in wastewater ranged from 125 to 3160 mg/L, and vice versa during the rainy seasons. There is a concentration of total dissolvable solids (TDS) higher than 2100 mg/L at each of the first three sample points in the dry phase [18]. The concentrations of total dissolved solids in wastewater are prone to swings due to the presence of trash and tannery effluents. During the dry seasons, the values were significantly greater than they were during the rainy seasons. TDS levels may fall as a result of a number of different physicochemical processes, such as sedimentation, coagulation, fixing, oxidation, and precipitation [20]. The amount of solids that are present in a particular body of water is one of the factors that is considered when determining the levels of organic and inorganic pollution loads. During periods of dry and rainy weather, the amounts of NO3- ranged from 96 to 189 mg/L, respectively. During the months with more precipitation, the levels of NO3- were lower. Tannery effluents are thought to have a higher value during the dry season. This is one possible explanation. During the entirety of the wet season, not a single DTW NO3- result was higher than 50 mg/L [18]. Dry and rainy season TSS ranged from 0.0 to 0.16 mg/50 mL. Sampling point I had the highest TSS during the dry season (0.16 mg/50 mL). From upstream to downstream, outside the barrier, values decreased. Tube well water had 0.00 mg/50 mL turbidity. The findings for the rainy-season were similar. In the dry season, TSS levels in wastewater samples dropped. During the investigation period, a substantial amount of waste from tanneries and strong monsoon rains caused surface runoff. EC shows the overall concentration of ionized water components [19]. In dry and rainy seasons, wastewater EC ranged from 0.228 to 7.4 and 0.84 to 8.01 dS/m. The EC for all samples was below 1200 dS/cm [17].
It is possible to describe both the oxidation and reduction states of water using its redox potential. On day 28 after sampling, the value of the water sample was between -436 and -110 mV in the dry season and between -389 and -241 mV in the wet season. This was the case regardless of whether the sample was taken in the dry season or the wet season. During the rainy season, the value of the redox potential was -389 mV. During the dry season, both sampling point I and the groundwater revealed a potential of -110 mV. The low redox potential during the rainy season may be owing to changes in the organic matter and metal complexes of the underlying water. On the other hand, the higher redox values during the dry season may be related to water turnover and movement. When testing for EC, Na+, K+, Mg2+, Ca2+, and Eh in the flowing waters of the Buriganga river (sample site 6), it was possible to detect a considerable level of wastewater contamination even in this section of the river. A number of authors, including the study [21, 22], all arrived at the same verdict.
Table 2. Wastewater’s chemical and physicochemical properties in dry and rainy phases
|
Dry Season |
||||||||||||||
|
Spot No |
pH |
DO |
BOD |
NO3- |
Ca |
Mg |
K |
Na |
Cl |
TDS |
TSS |
EC |
Eh |
Turbidity |
|
mg/L |
mg/50mL |
dS/cm |
mV |
FTU |
||||||||||
|
I |
6.23 |
0.00 |
150 |
156 |
4.3 |
1.2 |
0.3 |
98 |
789 |
3160 |
0.16 |
2.1 |
378 |
4096 |
|
II |
7.83 |
0.45 |
138 |
163 |
4.1 |
2.1 |
0.6 |
100.2 |
895 |
2860 |
0.09 |
7.4 |
365 |
674 |
|
III |
7.73 |
0.35 |
128 |
125 |
4.5 |
2.6 |
0.2 |
95 |
789 |
2580 |
0.09 |
6.10 |
363 |
563 |
|
IV |
7.61 |
0.33 |
124 |
147 |
4.9 |
1.9 |
0.2 |
79 |
656 |
2320 |
0.03 |
3.87 |
353 |
800 |
|
V |
7.35 |
0.25 |
112 |
96 |
3.6 |
1.3 |
0.6 |
16.2 |
548 |
643 |
0.04 |
2.64 |
344 |
347 |
|
VI |
7.02 |
0.38 |
168 |
189 |
3.8 |
1.9 |
0.1 |
23.2 |
458 |
592 |
0.02 |
6.74 |
197 |
60 |
|
GW |
7.36 |
3.9 |
0 |
121 |
0.2 |
0.03 |
0.01 |
9 |
18 |
125 |
0.01 |
0.228 |
110 |
3.68 |
|
Rainy Season |
||||||||||||||
|
I |
8.07 |
0.65 |
212 |
125 |
4.5 |
2.3 |
0.2 |
126 |
568 |
486 |
1.2 |
7.23 |
325 |
530 |
|
II |
7.59 |
0.96 |
206 |
185 |
4.6 |
2.1 |
0.2 |
158 |
698 |
430 |
0.23 |
8.01 |
125 |
442 |
|
III |
8.15 |
0.89 |
194 |
163 |
5.6 |
2.03 |
0.2 |
63 |
456 |
329 |
0.56 |
7 |
389 |
166 |
|
IV |
7.11 |
0.69 |
154 |
73 |
6.2 |
2.56 |
0.2 |
48 |
678 |
226 |
0.48 |
3.72 |
321 |
41.5 |
|
V |
7.24 |
0.85 |
114 |
45 |
4.2 |
1.3 |
0.3 |
69 |
458 |
116 |
0.12 |
2.85 |
378 |
27.4 |
|
VI |
7.16 |
0.74 |
217 |
184 |
3.8 |
1.8 |
0.6 |
128 |
325 |
223 |
0.45 |
6.42 |
296 |
13.6 |
|
GW |
6.77 |
1.2 |
0 |
12 |
0.34 |
0.05 |
0.01 |
2 |
11 |
105 |
0.00 |
0.84 |
241 |
2.4 |
|
FAO, 2014 |
6-9 |
|
30 |
50 |
|
|
|
|
|
2100 |
30 |
|
|
550 |
|
DoE, 2008 |
6-9 |
4.5 |
50 |
50 |
|
|
|
|
|
2100 |
50 |
1.2 |
|
550 |
At different sampling locations, the turbidity during the wet season ranged from 2.4 to 530 FTU, while during the dry season, the turbidity ranged from 3.68 to 4096 FTU. In the context of water, turbidity is caused by the presence of suspended particles or sediment in the water. These particles scatter and absorb light, making the water appear cloudy or opaque [22]. Turbidity reached its highest point during the dry season at sampling site I (4,096 FTU), which then began to steadily fall from the source all the way downstream and beyond the barrier. Groundwater had the highest clarity, followed by surface water in the order of decreasing clarity (3.68 FTU). During the months with more precipitation, the same pattern was seen, with the greatest turbidity value (530 FTU) being found close to the sampling point of origin, also known as sampling site I. Turbidity above the regulatory limit was observed at sampling spots II, III, IV, and I in the dry season [17].
3.2 Heavy metals
We measured the concentration of Cr in both dry and wet-season wastewater samples. During the dry months, the highest Cr content (8995.0 mg/L) (Table 3) was found at the primary tannery disposal point. Sampling point I may be contaminated by Cr salts used in tanneries or wastewater, and effluents from other industries are constantly being added [21]. There was a large gap between sample locations II, III, IV, and V, VI. As expected, Cr levels dropped during the wetter months. Cr was found to be 17.86 and 863.03 mg/L at sampling points V and I, respectively. Dilution by rainwater may be responsible for this reduction. The Cr in the effluent from Hazaribag was measured at 0.28 ppm by Imamul-Huq [6]. This finding is consistent with that of Ullal et al. [21]. All samples had Cr. Cr concentration across the MAC (Maximum Allowed Concentration) for surface water 0.5 mg/kg [18] and WHO drinking water standard 0.05 mg/kg during dry and rainy seasons [19].
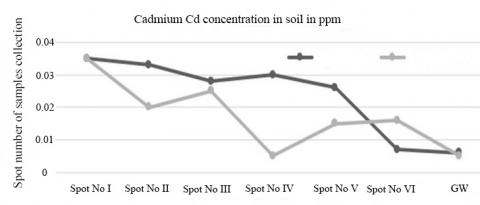
During the dry seasons, the Cd contents in wastewater samples ranged from 0.006 to 0.035 mg/L, whereas during the rainy seasons, these values were ranged from 0.005 to 0.035 mg/L (Table 4 and Figure 3). There were significant differences present in groundwater samples as well as VI samples. During the wet season, the exact sampling location had significantly lower levels of cadmium. The rain was the main responsible for lowering the Cd concentration. Maximum concentration of Cd that the WHO considers safe for drinking water is 0.005 mg/kg. However, all sampling sites had higher levels of Cd than the national guidelines (0.05 mg/kg) and WHO for inland water [18].
Table 3. Cr mg/L in wastewater at sampling points of study area both in dry and rainy season
|
|
Chromium mg/L |
|||
|
Sampling No. |
Dry Season |
Rainy Season |
National Standards DoE, 2008 |
WHO Standards WHO, 2004 |
|
I |
8995.0 a |
863.03 a |
||
|
II |
5967.50 b |
674.56 ab |
||
|
III |
5619.17 b |
62.90 b |
0.5 |
0.05 |
|
IV |
6232.66 b |
275.18 ab |
||
|
V |
3644.08 d |
39.51 b |
||
|
VI |
4609.8 c |
17.86 b |
||
|
GW |
28.33 |
2.14 b |
||
Table 4. Cd mg/L in wastewater at sampling points of study area both in dry and rainy season
|
|
Cadmium mg/L |
|||
|
Sampling No. |
Dry Season |
Rainy Season |
National Standards DoE, 2008 |
WHO Standards WHO, 2004 |
|
I |
0.035 a |
0.035 a |
||
|
II |
0.033 a |
0.020 bc |
||
|
III |
0.028 a |
0.025 b |
0.05 |
0.005 |
|
IV |
0.030 a |
0.005 d |
||
|
V |
0.026 a |
0.015 c |
||
|
VI |
0.007 b |
0.016 bc |
||
|
GW |
0.006 b |
0.005 d |
||
Figure 3. Change of Cd (ppm) at sampling points in dry and wet season
The highest concentration of Zn in water samples collected during the dry season was found at point I (3.10 mg/L), followed by concentrations of 2.61 mg/L, 2.21 mg/L, 1.76 mg/L, 1.73 mg/L, 0.601 mg/L, and groundwater concentrations of 0.601 mg/L (Table 5 and Figure 4). There were major deviations only at points II and III. Ullah et al. [21] found only 0.12 ppm in the wastewater of Hazaribag. Inland and drinking water samples all had MAC concentrations higher than 5 mg/kg [18, 19].
Sampling site I, the main tannery disposal point inside the embankment, had Mn concentrations of 1.8 mg/L (Table 6 and Figure 4). Tannery manganese salts could contaminate sampling site I [23]. Both the sample and the groundwater were statistically significant (5% level of significance). During the monsoon months, concentrations of Mn 0.03 and 1.73 mg/L were found at sampling point I and groundwater, respectively. On the other hand, Ullal et al. [21] measured 0.014 ppm of Mn in the wastewater of the Hazaribag tannery. For Mn, national and international standards (by WHO) is for both inland water (5 mg/kg) [18] and drinking water (0.05 mg/kg) [19]. From this study, we observed Mn in all collected water samples was higher than the national and WHO standards.
The concentration of Fe ranged from 38.93 to 275.01 mg/L in the dry and wet seasons, respectively (Table 7 and Figure 5). In case of Fe concentration, sampling point I and II was different from other sampling points. During the wet season, Fe was lower at the same sampling point compared to the dry season. Observed Fe concentration at all sampling points (sampling points I to VI and GW) was higher than the WHO and national standards.
Table 5. Zn mg/L in wastewater at sampling points of the study area both in dry and rainy seasons
|
|
Zinc mg/L |
|||
|
Sampling No. |
Dry Season |
Rainy Season |
National Standards DoE, 2008 |
WHO Standards WHO, 2004 |
|
I |
17.38 a |
16.91 a |
||
|
II |
17.33 b |
12.82 b |
||
|
III |
17.67 b |
13.76 b |
5 |
5 |
|
IV |
22.16 c |
16.91 b |
||
|
V |
26.03 c |
14.49 bc |
||
|
VI |
31.01c |
24.63 bc |
||
|
GW |
6.1 d |
2.51 c |
||
Figure 4. Change of Zn & Mn (ppm) at sampling points in dry and wet season
Table 6. Mn mg/L in wastewater at sampling points of study area both in dry and rainy season
|
|
Manganese mg/L |
|||
|
Sampling No. |
Dry Season |
Rainy Season |
National Standards DoE, 2008 |
WHO Standards WHO, 2004 |
|
I |
12.81 c |
7.3 a |
||
|
II |
18.31 b |
3.33 a |
||
|
III |
21.38 a |
0.20 c |
5 |
5 |
|
IV |
12.98 c |
0.59 b |
||
|
V |
11.81 c |
0.05 d |
||
|
VI |
7.15 d |
0.45 b |
||
|
GW |
4.48 e |
0.03 d |
||
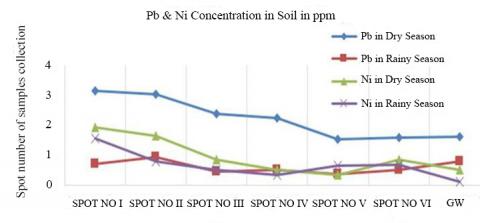
Figure 5. Change of Pb & Ni (ppm) at sampling points in dry and wet season
Pb concentrations during the dry season were 1.53 and 3.15 mg/L at sites I and III, respectively (Table 8 and Figure 5). There were no noticeable variations in any of 5 sampling locations. Total Pb concentrations at both sampling locations I and II were between 0.366 and 0.94 mg/L respectively. The typical effluent standard for inland surface water was 0.1 mg/kg, however all tests exceeded this standard [18].
Table 7. Fe mg/L in wastewater at sampling point of study area both in dry and rainy season
|
|
Iron mg/L |
|||
|
Sampling No. |
Dry Season |
Rainy Season |
National Standards DoE, 2008 |
WHO Standards WHO, 2004 |
|
I |
275.01 a |
113.27 a |
||
|
II |
226.43 a |
81.6 b |
||
|
III |
104.76 a |
68.27 b |
2 |
0.3 |
|
IV |
61.68 b |
61.6 b |
||
|
V |
42.60 b |
54.94 c |
||
|
VI |
38.93 b |
32.11 bc |
||
|
GW |
13.60 c |
4.61 d |
||
Table 8. Pb mg/L in wastewater at sampling points of study area both in dry and rainy season
|
|
Lead mg/L |
|||
|
Sampling No. |
Dry Season |
Rainy Season |
National Standards DoE, 2008 |
WHO Standards WHO, 2004 |
|
I |
3.15 a |
0.70 b |
||
|
II |
3.04 a |
0.94 a |
||
|
III |
2.39 a |
0.44 c |
0.1 |
0.01 |
|
IV |
2.23 a |
0.51 c |
||
|
V |
1.53 a |
0.36 c |
||
|
VI |
1.59 a |
0.51 c |
||
|
GW |
1.63 a |
0.78 ab |
||
Table 9. Nickel mg/L in wastewater at sampling point of study area both in dry and rainy season
|
|
Nickel mg/L |
|||
|
Sampling No. |
Dry Season |
Rainy Season |
National Standards DoE, 2008 |
WHO Standards WHO, 2004 |
|
I |
1.93 a |
1.57 a |
||
|
II |
1.64 a |
0.80 ab |
||
|
III |
0.84 a |
0.50 ab |
1 |
0.1 |
|
IV |
0.51 a |
0.341 b |
||
|
V |
0.34 a |
0.65 ab |
||
|
VI |
0.84 a |
0.67 ab |
||
|
GW |
0.51 a |
0.11 b |
||
The Ni concentrations in wastewater measured from sampling sites I through VI, as well as groundwater, are shown in Table 9 for the dry season. There was no noticeable variation across samples. However, observations were different during the rainy season. Ni concentration was lower in the rainy season compared to dry season. Ni levels in both drinking water (0.1 mg/kg) and inland water (1 mg/kg) (Table 9) were above the maximum contaminant level (MAC) [18, 19].
Several open canals and lowlands in the region around Hazaribagh, where this research was conducted, contribute to the flow of industrial wastewater into the river Buriganga. Extremely high quantities of Na+, K+, Mg2+, Ca2+, NO3-, Cl-, and many heavy metal ions like Cr6+, Zn2+, Pb2+, Cd2+, Mn4+, Fe2+, and Ni2+ were observed in both the surface water and the groundwater of the studied region. The existence of a high quantity of organic compounds was indicated by readings that were high for BOD but low for DD. Damage to aquatic life and the ecosystem can be expected because of the observed high BOD, low DO, NO3-, Na+, K+, Mg2+, Ca2+, Cl-, TDS, TSS, EC, Eh, and turbidity. Heavy concentrations of potentially harmful metals were found at the first three sampling locations. The heavy metal content of the water dropped significantly as it moved from its source to the Buriganga River. Metal content shifts may have resulted from a combination of factors, including dispersion and dilution from the source and the way the soil allowed wastewater percolation into groundwater. Due to the fact that rainwater dilutes pollutants, heavy metal concentrations were lower during the rainy months, but were still considered to be excessive. All metals evaluated, along with some physicochemical parameters like pH, DO, BOD, TDS, TSS, EC, Cl-, and Na+, were found to be excessively high. Ignoring the dangers of untreated tannery wastes and effluents could lead to a rise in the contamination of both surface and groundwater. To help lower pollution levels, it is recommended that all tanneries move to the new industrial districts. Finally, our results showed that the heavy metal levels of the Buriganga river were also too high on the basis of DoE and WHO standards. This implies that a lot of cations, anions, organic waste, and heavy metals are found in the waters around the Hazaribagh tannery business. Because of this, the water is not safe to drink; in addition, it is not suitable for other activities including laundry and personal hygiene.
The research was funded by the Ministry of Science and Technology in Bangladesh through the National Science and Technology (NST) Fellowship (grant number 164). Laboratory work was done at the University of Dhaka’s Soil, Water, and Environment lab as well as at the Bangladesh Council for Scientific and Industrial Research (BCSIR). We appreciate the guidance of the SWED head and the BCSIR chairman. We would like to extend our sincere appreciation to the Hazaribag area’s tannery employees, producers, and traders for their helpful suggestions, insights, and support in collecting samples.
|
Abbreviations |
|
|
EC |
Electrical Conductivity |
|
TSS |
Total Soluble Salts |
|
TDS |
Total Dissolved Solids |
|
Eh |
Redox Oxidation-Reduction |
|
BOD |
Biological Oxygen Demand |
|
COD |
Chemical Oxygen Demand |
|
SS |
Suspended solids |
|
AAS |
Atomic Absorption Spectrometer |
|
EDTA |
Ethylenediaminetetraacetic Acid |
|
DMRT |
Duncan’s Multiple Range test |
|
MAC |
Maximum Allowable Concentration |
|
DTW |
Deep Tube Well |
|
SW |
Surface Water |
|
GW |
Ground Water |
|
DoE |
Department of Environment |
|
WHO |
World Health Organization |
|
DS |
Drought Stress Irrigation |
[1] Sarkar, P., Anjum, A., Khan, E.A. (2017). Overview of major industries in Bangladesh. Journal of Chemical Engineering, 30(1): 51-58. https://doi.org/10.3329/jce.v30i1.34798
[2] Ferdous, Z., Akter, S., Hasan, M., Begum, R.A., Shahajahan, R.M. (2012). Phytoplankton diversity and abundance in relation to pollution levels in the Hazaribagh tannery effluent sewage water of the river Buriganga. Bangladesh Journal of Zoology, 40(1): 121-128. https://doi.org/10.3329/bjz.v40i1.12901
[3] Bernhardt, A., Gysi, N. (2013). The world’s worst 2013: The top ten toxic threats; Clean up, progress and ongoing challenges. New York, Zurich, 1-36.
[4] Hasnat, A., Rahman, I., Pasha, M. (2013). Assessment of environmental impact for tannery industries in Bangladesh. International Journal of Environmental Science and Development, 4(2): 217-220. https://doi.org/10.7763/IJESD.2013.V4.338
[5] Kabir, M.M., Fakhruddin, A.N.M., Chowdhury, M.A.Z., Fardous, Z., Islam, R. (2017). Characterization of tannery effluents of Hazaribagh area, Dhaka, Bangladesh. Pollution, 3(3): 395-406. https://doi.org/10.7508/PJ.2017.03.005
[6] Huq, S.I. (1998). Critical environmental issues relating to tanning industries in Bangladesh. In ACIAR Proceedings, pp. 22-28.
[7] McCartor, A., Becker, D. (2013). Blacksmith Institute’s world worst pollution problems report 2010: Top six toxic threats. Blacksmith Institute.
[8] Farenzena, M., Ferreira, L.D.S., Trierweiler, J.O., Aquim, P.M.D. (2005). Tanneries: From waste to sustainability. Brazilian Archives of Biology and Technology, 48: 281-289. https://doi.org/10.1590/S1516-89132005000400035
[9] Kambole, M.S. (2003). Managing the water quality of the Kafue River. Physics and Chemistry of the Earth, Parts A/B/C, 28(20-27): 1105-1109. https://doi.org/10.1016/j.pce.2003.08.031
[10] Scannell, P.W., Jacobs, L.L. (2001). Effects of total dissolved solids on aquatic organisms. Alaska Department of Fish and Game: Division of Habitat and Restoration, 01-06. https://www.adfg.alaska.gov/static/home/library/pdfs/habitat/01_06.pdf.
[11] Bhuiyan, M.A.H., Suruvi, N.I., Dampare, S.B., Islam, M.A., Quraishi, S.B., Ganyaglo, S., Suzuki, S. (2011). Investigation of the possible sources of heavy metal contamination in lagoon and canal water in the tannery industrial area in Dhaka, Bangladesh. Environmental Monitoring and Assessment, 175(1-4): 633-649. https://doi.org/10.1007/s10661-010-1557-6
[12] Sahu, R.K., Katiyar, S., Tiwari, J., Kisku, G.C. (2007). Assessment of drain water receiving effluent from tanneries and its impact on soil and plants with particular emphasis on bioaccumulation of heavy metals. Journal of Environmental Biology, 28(3): 685.
[13] Nur-E-Alam, M., Mia, M.A.S., Rahman, M.L., Rahman, M.M. (2017). Impacts of tanning process on surface water quality of Hazaribagh Tanning Area Dhaka, Bangladesh. Journal of Environmental Science, Computer Science and Engineering & Technology, 666(33310): 176-186.
[14] Mondol, M.N., Asia, A., Chamon, A.S., Faiz, S. (2017). Contamination of soil and plant by the Hazaribagh tannery industries. Journal of the Asiatic Society of Bangladesh, Science, 43(2): 207-222. https://doi.org/10.3329/jasbs.v43i2.46518
[15] Akter, A., Mondol, M.N., Chamon, A.S., Faiz, S. (2020). Heavy metals in poultry and fish feed ingredients in Bangladesh: A potential threat to our next generation. International Journal of Engineering Applied Sciences and Technology, 5(8): 64-70. https://doi.org/10.33564/ijeast.2020.v05i08.009
[16] Carranzo, I.V. (2012). Standard methods for examination of water and wastewater. In Anales de hidrología médica, 5(2): 185-186. Universidad Complutense de Madrid. https://www.standardmethods.org/.
[17] FAO. (2014). General standards for discharge of effluents. http://extwprlegs1.fao.org/docs/pdf/uga203300.pdf.
[18] DoE. (2008). Guide for Assessment of Effluent Treatment Plants 9-10. http://old.doe.gov.bd/publication_images/15_etp_assessment_guide.pdf.
[19] Graham, N. (1999). Guidelines for Drinking-Water Quality, 2nd edition, Addendum to Volume 1 - Recommendations, World Health Organisation, Geneva, 1998, 36 pages. Urban Water, 1(2): 183. https://doi.org/10.1016/S1462-0758(00)00006-6
[20] Wasserman, G.A., Liu, X., Parvez, F., Ahsan, H., Levy, D., Factor-Litvak, P., Kline, J., van Geen, A., Slavkovich, V., Lolacono, N.J., Cheng, Z., Zheng, Y., Graziano, J.H. (2006). Water manganese exposure and children’s intellectual function in Araihazar, Bangladesh. Environmental Health Perspectives, 114(1): 124-129. https://doi.org/10.1289/ehp.8030
[21] Ullah, S.M., Nuruzzaman, M., Gerzabek, M.H. (1995). Heavy metal and microbiological pollution of water and sediments by industrial waters, effluents and slums around Dhaka City. Tropical limnology, 3: 179-186.
[22] Akter, A., Chamon, A.S., Mondol, M.N., Faiz, S.M.A. (2022). Assessment of surface and groundwater contamination and seasonal variation at the tannery area in Dhaka, Bangladesh. WIT Transactions on Ecology and the Environment, 259: 99-110. https://doi.org/10.2495/AWP220091
[23] Hossain, M. M., Wu, S., Nasir, A., Mohotti, D., Robinson, N.A., Yuan, Y., Agyekum-Oduro, E., Akter, A., Bhuiyan, K.A., Ahmed, R., Nguyen, V.T., Yoon, K.H., Trinh, Q.H. Mok, Y.S. (2022). Superhydrophobic and superoleophilic surfaces prepared by one-step plasma polymerization for oil-water separation and self-cleaning function. Surfaces and Interfaces, 35: 102462.