
Wissam Al-Taliby* | Intidhar Jabir Idan | Rawaa H. K. Al-Isawi | Rabab Dekhn
© 2026 The authors. This article is published by IIETA and is licensed under the CC BY 4.0 license (http://creativecommons.org/licenses/by/4.0/).
OPEN ACCESS
As a main conduit for substances into coastal systems, accurate estimation of submarine groundwater discharge (SGD) is of critical importance for sustainable management. Hydrologic modeling is one of the common methodologies employed for this purpose. However, hydrologic models usually require extensive field data for calibration and validation. Coastal regions are usually harsh saline environments, making data collection challenging. This study describes the development, calibration, and evaluation of a numerical model for a coastal lagoon, Banana River Lagoon (BRL), Florida, under data-scarce conditions. The study suggests interpolating the field data and extracting synthetic data points from the interpolated surface. The synthetic data are used with the collected data as head targets to force the model to match more targets during the automated Parameter Estimation Software (PEST) calibration. Results indicate that model calibration aided by interpolation-based datasets can produce well-calibrated models that closely resemble field conditions. Simulations using three different temporal hydrologic conditions show that the lagoon received an SGD of 46, 69, and 56 m³·yr⁻¹·m⁻¹ of shoreline during July 2014, October 2014, and May 2015, respectively. The simulated SGD reaching the lagoon originates from terrestrial and marine sources, highlighting the potential for elevated nutrient fluxes and chemical cycling in the ocean sediment. Such conditions may have ecological impacts on the lagoon’s species and should be considered in hydrodynamic modeling. These results indicate the role of using synthetic data in improving the statistical evaluation of model goodness of fit and also highlight the critical role of interpolation in augmenting datasets for model calibration in data-scarce conditions.
submarine groundwater discharge, interpolation, groundwater modeling, data-scarce, lagoon
Groundwater stands as one of the most significant components of the water cycle, which is crucial for supporting all kinds of life and comprises one-third of the Earth’s freshwater supply. Population growth, coupled with climate change over the last century, has resulted in increased demand for groundwater [1] and in global declines in groundwater storage [2]. Several investigations have shown that overuse of this important resource without sustainable management and planning can result in a serious decline in groundwater levels [3, 4] as well as groundwater contamination [5, 6]. Thus, informed management of groundwater resources has become crucial for facing these increasing challenges. To effectively protect this precious resource, it is necessary to understand groundwater flow regimes and pollutant transport processes. Representing groundwater flow regimes and transport processes beneath the Earth’s surface is challenging due to uncertainty in aquifer hydraulic parameters and surface heterogeneity. As such, numerical modeling is an indispensable tool widely used to aid decision-making and sustainable management programs of groundwater sources. Recent advances in hydrologic modeling and computational capabilities have enabled the simulation of a wide range of complex groundwater flow and transport systems. However, without proper calibration, hydrologic models can easily produce nonunique, unstable, or insensitive simulations [7].
Calibration of groundwater hydrologic models is accomplished by iteratively adjusting the most sensitive parameters with the ultimate goal being to match simulated and observed data. After properly calibrating the model, its goodness and precision are usually evaluated by using additional field data to determine whether the model is able to mimic field conditions under boundary conditions different from the ones used initially to develop the model. Calibration involves the adjustment of uncertain and sensitive parameters, such as vertical hydraulic conductivity, Kv, that command extensive numerical calculations and calibration iterations. The most common strategy of model calibration involves the comparison of the simulated head results with the observed/measured head data known as calibration targets [8-10]. It is challenging to produce unique solutions based on a restricted number of well sites utilizing head values alone [11-13]. The more head data used for model calibration, the higher the calibration resolution. However, in many practical groundwater modeling problems, especially with regional models or in harsh environments such as saline environments, observed head data is usually scarce and very limited for many reasons. Insufficient field measurements (observed data) usually result in significant differences between simulated and observed data, since this causes a lack of appropriate representation of spatial variation in the hydraulic parameters of the modeled system. Subsequently, inadequate observational data pose significant constraints to the calibration of hydrological models, which subsequently compromises predictive accuracy and may ultimately impair the effectiveness of decision-making frameworks. It follows that a reliable strategy is needed to systematically achieve efficient hydrologic model calibration in regions with scarce observations.
Previous research has dealt with data scarcity conditions in groundwater modeling using several techniques and methodologies depending on site-specific conditions and the type of available data. Among these methodologies, lumped parameter groundwater modeling approaches have been adopted as alternatives to traditional physics-based models [14, 15]. Additionally, the integration of remote sensing products and literature data with conventional groundwater models has emerged as an established approach for improving simulation fidelity [16]. Some studies have used nested models and multi-index calibration [17], boundary condition analysis [18], or Earth observation [19]. Some other researchers have addressed the issues of data scarcity by using GRACE to strengthen model development [20, 21]. Another group of researchers has handled this problem through simplified methodologies, including employment of pilot points [22], Grey Models [23], parsimonious parameterization [24], head-guided zonation [25], stochastic reconstruction framework [26], and expert-based frameworks [27], all aimed at extracting additional data from scarce available data. To the best of the authors’ knowledge, studies that have employed interpolation techniques for increasing the reliability of groundwater modeling in data-sparse regions are very limited. A single study [28] was found in the literature in which groundwater depth is estimated in a data-limited area using optimal interpolation. Data collection in harsh environments, such as coastal lagoons, is usually challenging. It occasionally requires diving into the saline water for equipment installation in the sediments and the subsequent data collection. These difficulties pose significant limitations on the data collected for groundwater modeling efforts. Interpolation of limited data in such harsh conditions acts as a valuable tool for generating additional datasets for model calibration and validation. It can also introduce a significant reduction in time, effort, and cost that emanate from difficult data collection trips. However, the literature is lacking methodologies that utilize interpolation to extract head data in harsh environments, such as coastal aquifers with a saline environment, for calibrating flow regimes.
It is generally recognized that submarine groundwater discharge (SGD) has a strong potential to reshape these vital coastal ecosystems by impacting nutrient cycling and biodiversity [29]. In many coastal systems, SGD has been recognized as a major contributor to land-based nutrient fluxes, namely phosphorus and nitrogen, that exceed surface water fluxes by orders of magnitude [30]. For example, SGD was estimated to deliver more than 79% of dissolved inorganic phosphorus, nitrogen, and silica loads into Liaodong Bay, China [31]. SGD-driven nutrient fluxes can result in a significant imbalance of the nitrogen-to-phosphorus ratio (N/P). In many coastal systems, SGD has resulted in N/P ratios exceeding the Redfield ratio of 16:1, turning those ecosystems into phosphorus-limited environments and consequently driving eutrophication, growth of harmful algal blooms (HABs) [32], and fish kills [33]. Despite these negative impacts, SGD is reported to have several positive effects on coastal ecosystems, such as increased biodiversity in nitrogen-limited systems, fisheries, pollution attenuation, and coral calcification [32]. Thus, reliable estimation of SGD is critical for sustainable management of coastal environments.
This study focuses on developing a groundwater numerical model to simulate SGD into an unconfined coastal aquifer below a coastal lagoon known as the Banana River Lagoon (BRL). The environment at the site is predominantly saline, making it challenging to install and collect sufficient piezometric head and salinity data for model development. The lagoon width at the selected site is also relatively large, and thus, a higher resolution of data collection is needed to effectively represent the flow conditions. The study investigates the use of inverse distance weighting (IDW) interpolation of the limited data obtained from this data-scarce area by extracting additional synthetic data points from the interpolated surface. This methodology provides more data that serve the modeling process in two ways: 1) by providing more head targets for model calibration, and 2) by allowing model calibration to be evaluated statistically with more data rather than a limited number of data points.
The BRL is one of three lagoons that make up the Indian River Lagoon (IRL) system, which spans 250 kilometers along Florida's eastern coast (Figure 1(a)), together with the IRL and the Mosquito Lagoon (Figure 1(b)). The BRL is located in Florida between Cape Canaveral and the Merritt Islands, and is approximately 46 kilometers long and 5730 m wide at the study site. The lagoon maintains a hydraulic connection to the Atlantic Ocean through the Cape Canaveral Inlet, while the man-made Barge Canal, traversing Merritt Island, links the lagoon to the IRL water body. With a large number of species exceeding 4300, this entire lagoon system represents one of the most diversely inhabited and biologically vibrant estuarine systems in the US. Around 50 of these species are designated as endangered or threatened, such as the Florida manatee [34]. The lagoon also holds significant annual economic value for the nation, estimated at more than \$7 billion, with around \$50 million generated annually by the lagoon fisheries. As such, this valuable coastal system was listed by the United States EPA as an “Estuary of National Significance” within the National Estuary Program. Unfortunately, increased eutrophication in the IRL system has led to increased frequency and intensity of the occurrence of HABs, resulting in remarkable loss of seagrass cover and subsequent loss of habitat in all three system’s sublagoons, including the BRL [35].
The BRL is isolated from the ocean by the Barrier Island, which is a short band of coastal islands. The geologic formation underlying the lagoon is an unconfined aquifer consisting mostly of sand and shells. This unconfined aquifer is underlain by a restricting impermeable marl and clay at 44 meters below the National Geodetic Vertical Datum of 1929 (NGVD29), also known as the Hawthorn formation [36].
Figure 1. (a) Florida map showing the geographic location of Banana River Lagoon (BRL), (b) water bodies of the Indian River Lagoon (IRL) system, including BRL, with the location of the study site, and (c) details of the study site and monitoring piezometer clusters
The study transect was chosen to be orthogonal to the lagoon coasts, running from the groundwater divide on Merritt Island to the ocean and passing via the BRL and Barrier Island (Figures 1(b) and 1(c)). The lagoon water is brackish as a result of the constant mixing of ocean water with meteoric groundwater on land. Therefore, flow conditions in such a saline environment warrant the use of a variable-density model. Significant discrepancies can be introduced into the modeling results if a constant-density model is utilized to represent such saline conditions [37, 38].
3.1 Characterization and data collection procedure
The fieldwork initially involved installing a number of onshore and offshore clustered monitoring wells/piezometers and a benchmark (Figure 1) and delineating the lagoon bed profile along the selected transect (Figure 2). Groundwater levels measured at the onshore monitoring wells were used to define the groundwater divides and establish the transect’s horizontal extent up to the Atlantic Ocean. The transect spans a total horizontal distance of 6270 m, including 200 m through the groundwater divide on Merritt Island, 5730 through the lagoon water body, and 340 m of the Barrier Island to terminate at the Atlantic Ocean’s coast. The measured lagoon bed profile shows that the lagoon bottom at the study site ranges from 1 m to 3 m below the water surface (Figure 2). Groundwater levels collected from onshore piezometers on the Merritt and Barrier Islands were used to define the model boundary conditions. Eight stations of clustered piezometers were used to collect hydraulic head and lagoon water salinity below the transect, as depicted in Figure 2 (also shown as blue dots in Figure 1(c)). Each station contained a cluster of two monitoring piezometers at different depths ranging from 1.17 m to 3.66 m. An additional piezometer, deeper than the others (6.70 m), was later installed at the western station, bringing the total number of piezometers to 17. Table 1 provides more details on the horizontal locations measured from the Westshore stations (WS) and the screen elevation of each piezometer in NGVD29. Eight additional samples were collected from the lagoon surface water at sites corresponding to the eight monitoring stations at the lagoon bed elevations (Table 1). Adding those lagoon bed samples to the ones collected from the piezometers, a total of 25 samples were obtained during each sampling campaign. Temporal groundwater salinity ranges measured at the 25 locations, the average temporal lagoon water salinity, and the measured temporal lagoon water elevation are presented in Table 2. Owing to the difficulty of fieldwork in such a saline environment, the installation of deeper piezometers wasn’t feasible. Moreover, given the relatively large width of the lagoon, the number of monitoring points is relatively scarce to achieve reliable model calibration and validation. All salinity measurements were accomplished using a YSI 85 probe with a range of 0–180 ppt. Hydraulic head and salinity data were observed during three sampling dates conducted in July 2014, October 2014, and May 2015. The conversion of observed groundwater hydraulic heads below the lagoon to equivalent freshwater heads was necessary to account for salinity effects after generating the interpolated equipotential contour maps. This conversion was accomplished using Eq. (1).
${{H}_{fresh}}=\frac{{{\rho }_{salt}}}{{{\rho }_{fresh}}}{{h}_{salt}}-\frac{{{\rho }_{salt}}-{{\rho }_{fresh}}}{{{\rho }_{fresh}}}H$ (1)
where, Hfresh represents freshwater head in m; hsalt represents seawater head in m; H stands for elevation in m; ρfresh = density of freshwater, taken as 1000 kg/m3; ρsalt = density of seawater, taken as 1025 kg/m3.
Figure 2. Data collection piezometer cluster distribution underneath the lagoon bed
Sediment samples of the lagoon bed were collected from five of the monitoring stations to estimate the horizontal hydraulic conductivity (Kh) of the aquifer by the equation Kh = C(d10)2, where d10 is the effective diameter, and C is an empirical constant. A horizontal hydraulic conductivity of 20 m/d was calculated by averaging the estimated conductivity at all sampling points.
Table 1. Sampling locations and screen depths of the offshore piezometers and bed points
|
Station |
Distance from WS (m) |
NGVD29 Elevation (m) |
|||
|
Shallow |
Deep |
Deeper |
Lagoon Bed |
||
|
WS |
0 |
-1.089 |
-3.570 |
-5.282 |
0.328 |
|
WS1 |
29 |
-1.080 |
-3.575 |
- |
-0.171 |
|
S1 |
944 |
-3.086 |
-5.576 |
- |
-2.172 |
|
S2 |
1920 |
-3.454 |
-5.944 |
- |
-2.540 |
|
S3 |
2858 |
-3.664 |
-6.154 |
- |
-2.750 |
|
S4 |
3825 |
-3.434 |
-5.924 |
- |
-2.520 |
|
S5 |
4771 |
-3.164 |
-5.654 |
- |
-2.250 |
|
ES |
5730 |
-1.226 |
-3.716 |
- |
0.328 |
Table 2. Groundwater salinity ranges, lagoon surface water elevation, and average lagoon water salinity
|
Sampling Date |
Groundwater Salinity Range (ppt) |
Average Lagoon Surface Water Salinity (ppt) |
Lagoon Surface Water Elevation (m NGVD29) |
|
July 2014 |
1.2–31 |
31 |
0.362 |
|
October 2014 |
1.3–26 |
26 |
0.568 |
|
May 2015 |
1.3–28 |
24.5 |
0.299 |
3.2 Model development and simulations
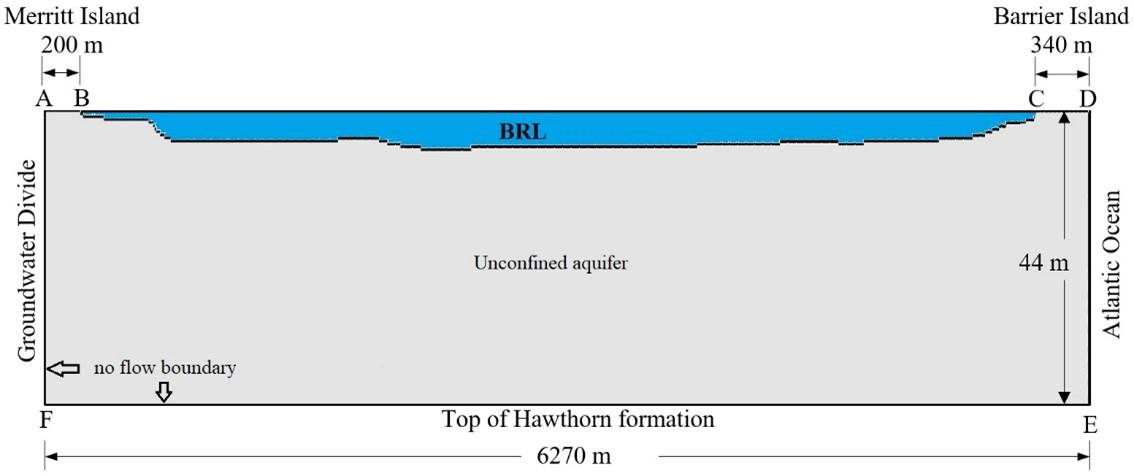
Numerical simulations were accomplished in the numerical environment of the groundwater flow and solute transport code SEAWAT [39]. The 2D cross-sectional domain of the model was 6270 m long and 44 m deep (Figure 3). The horizontal 6270 m stretch of the model covers the region from the Merritt Island groundwater divide to the Ocean. Boundaries A-B and C-D represent the fresh groundwater boundaries on Merritt Island and Barrier Island, respectively, and were represented in the model as constant head and concentration boundaries. The Hawthorn formation and the groundwater divide boundaries E-F and A-F, respectively, were assigned No-flow characteristics. The saltwater boundaries of the lagoon bed, B-C, and the Atlantic Ocean, D-E, were simulated by constant heads and concentrations. The normalized concentration of the sea boundary was 1, while the lagoon transect boundary was assigned a concentration of Cm/35000, with Cm representing the observed lagoon concentration based on seawater salinity of 35000. The initial concentration, Co, of the entire aquifer was set to zero, whereas the initial head was set to 44 m (total depth of the aquifer). The finite difference domain discretization included a single one-meter row, 176 columns, and 50 layers. Column spacing ranged from 4 to 40 m, and layer spacing ranged from 0.25 to 2.5 m. The model run was set to steady state with an implicit finite difference framework in the GCG solver. In total, three identically discretized steady-state models were developed, one for each sampling period (July 2014, October 2014, and May 2015). The only difference among the three models is that each uses boundary conditions representing a different stress period corresponding to a specific temporal sampling trip. An alternative approach would be to develop a single transient model incorporating all three stress periods. However, this would yield identical results to those obtained by the current approach, but the model would be more run-time demanding. Furthermore, in our current approach, viewing and post-processing results for a specific period is slightly more straightforward.
Figure 3. Model domain of the Banana River Lagoon (BRL) site developed in SEAWAT
3.3 Interpolation and uncertainty analysis of inverse distance weighting
The 25 piezometric head observations gathered in July 2014 were used to develop equipotential contours using IDW interpolation. Since the collected head data are limited relative to the model domain, 18 additional synthetic head values were extracted from the IDW surface for July 2014 and used with the original 25 points as head targets in model calibration to compensate for data scarcity. With a larger number of data points (larger sample), the reliability of the statistical analysis of model calibration can also be improved. The IDW interpolation-based synthetic points do not represent independent measurements. Instead, these points constitute mathematical approximations based on the actual field observations. As a result, using these synthetic points as spatial calibration constraints for the SEAWAT model may introduce spatial patterns and uncertainty to the model results.
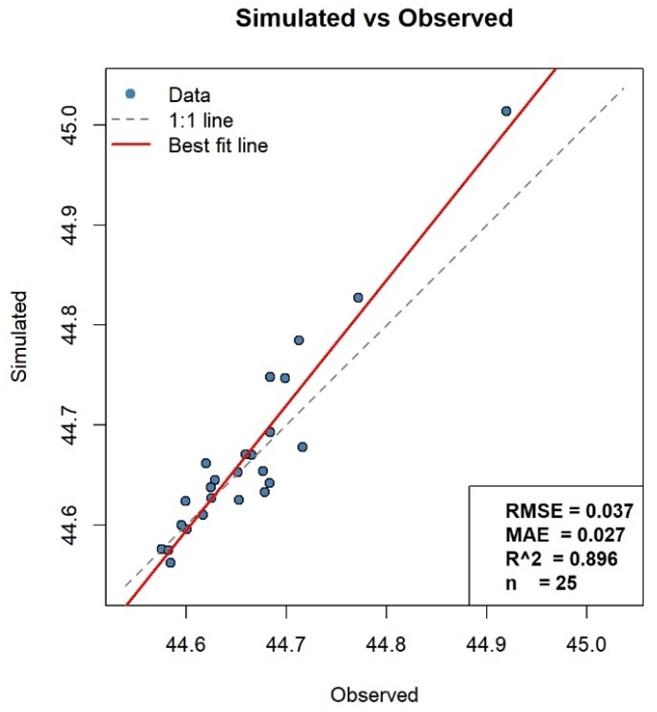
To evaluate the uncertainty inherent in the interpolation procedure, a leave-one-out cross-validation (LOOCV) procedure was employed. The LOOCV procedure was conducted by running the IDW interpolation of the actual field observations 25 times. In each run, one of the field observations was omitted, and its value was simulated by interpolating the rest of the field observations. The simulated observations were plotted against their actual field values, and the prediction error was quantified by RMSE, MAE, and R². The graphical and statistical procedures were performed using the R programming language.
The effect of uncertainty in interpolation-based points on the model SGD predictions was quantified using two calibration scenarios. One scenario used only the originally observed data as calibration constraints, while the second used the originally observed data plus the interpolated data as constraints. The difference between the two estimated SGD values was quantified and evaluated.
Due to their inherent uncertainty, the IDW-generated points were used as auxiliary calibration targets instead of independent targets. This was accomplished by downweighting these points in the objective function in the Parameter Estimation Software (PEST) calibration runs.
3.4 Calibration and validation
The procedure adopted in the calibration of the SEAWAT model was to use the July 2014 dataset for calibration and then validate the model using the October 2014 and May 2015 data. Since aquifer hydraulic conductivity usually controls groundwater flow [40], a sensitivity analysis was conducted to look into how sensitive the SEAWAT model was to Kh and Kv. During the sensitivity analysis, Kh was maintained at 20 m/d while using a single Kv for the entire domain. The Kv values tested during the sensitivity analysis were 0.2, 0.02, and 0.002 m/d. The sensitivity analysis aimed to calibrate the model and identify the Kv distribution that yields a close visual match between the simulated and observed groundwater head contours from July 2014. The model was initially calibrated using the PEST [41], and the calibration was further refined manually. PEST requires head calibration targets to optimize the objective function. The higher the number of targets, the higher the number of spatial constraints and the better the spatial conditioning of model calibration. Therefore, the model calibration was assessed in two scenarios: Scenario 1 with only the original 25 head observations as calibration targets, and Scenario 2 with the original 25 head observations plus the 18 IDW-based synthetic data points as targets. However, to compensate for the uncertainty inherent in the synthetic targets, they were downweighted in the PEST optimization of the objective function. The downweighting was based on the interpolation uncertainty analysis.
Following model calibration using a graphical comparison of the simulated and observed groundwater contours, the model goodness of fit was assessed statistically using the RMSE, t-test, and Nash-Sutcliffe efficiency (NSE) index [42]. There is no established standard for determining whether a model performs well or poorly, even though RMSE is frequently used in model calibration analyses with the aim of minimizing this measure. This is because the statistic's value usually varies depending on the units of measurement. At a 95 percent confidence level, the null hypothesis that the means of the simulated and observed groundwater heads are statistically equal was tested using a paired t-test. The goodness of fit between model results and measured heads is indicated by the NSE, which ranges from negative infinity to 1. While a value of zero or negative indicates that the mean of the measured data is a better predictor than the predicted values, a value of one indicates an ideal fit. An NSE value >0.5 would indicate a satisfactory match between the tested datasets.
A scatter plot of the 25 simulated versus observed head data points obtained from the LOOCV uncertainty analysis of the IDW interpolation is shown in Figure 4. With an R² of 0.896, RMSE of 0.037, and MAE of 0.027, the simulated values appear to agree strongly with the observed values. However, it should be noted that, ranging from 44.58 to 44.95 m, the observed head values are characterized by a narrow range of 0.37 m. Therefore, given such a narrow range, the absolute values of the RMSE and MAE error metrics may not meaningfully reflect the goodness of fit. Thus, normalizing these metrics by dividing the absolute values by the range of the observed data and multiplying by 100 to report the errors in percentage format provides a meaningful interpretation of the statistics. Therefore, with a range of 0.37 m, the normalized RMSE and MAE for the IDW-simulated head values are 10% and 7%, respectively. It can be concluded that the IDW-simulated values show moderate agreement with the observed values. Figure 4 also reveals that the best-fit line closely aligns with the 1:1 line at head values below 44.8 m, where most values cluster closely around the 1:1 line. The single value exceeding 44.8 m is the head of 44.95 m measured at the deepest piezometer. At this location, the best-fit line diverges the most from the 1:1 line. Since this location is relatively isolated and distant from the other piezometric locations, it exhibits the greatest deviation from the 1:1 line.
Figure 4. Uncertainty analysis of inverse distance weighting (IDW)-simulated synthetic head data points
The SEAWAT sensitivity analysis results showed that, even with an order of magnitude change in Kh, no notable effect on the model output was observed. However, significant shifts in the locations and shapes of groundwater head distributions were observed as Kv varied between 0.2 and 0.002 m/d (Figures 5(a)–(c)). The analysis revealed that the Kh value of 20 m/d estimated from sieve analysis of sediments can be used for the entire model domain without significantly affecting the results. Major changes in the simulated head contours with varying Kv indicate that the model sensitivity is mainly related to Kv (Figures 5(a)–(d)). Model calibration in Scenario 1 using only the 25 head observations as calibration targets produced the head distribution shown in Figure 5(d). In Scenario 2, when the 18 synthetic IDW-simulated targets were used with the original observations, model calibration produced the head distribution shown in Figure 5(e). A visual comparison of Scenario 1 results (Figure 5(d) with the measured distribution (Figure 5(f)) reveals only moderate agreement with the field observations. However, in Scenario 2, the visual comparison between the model-simulated head distribution (Figure 5(e)) and the measured distribution (Figure 5(f)) improved significantly. It is worth noting that, to account for uncertainty in the synthetic head targets, those targets were downweighted during the PEST optimization of the objective function. All synthetic targets were assigned a weight of 0.7 in the PEST settings, while the original observations were assigned a weight of 1. Figures 5(e) and (f) show that the calibrated model using Scenario 2 closely resembles the shape and magnitude of the measured head contours. This indicates that, by visual comparison, the simulated head data correlate strongly with the field data. Therefore, the final calibration was based on Scenario 2. This calibration was further verified by running the calibrated model under two different boundary conditions measured in October 2014 (Figure 6) and May 2015 (Figure 7). The calibrated hydraulic conductivity distribution in Scenario 2 was validated using the freshwater equipotential line distributions of October 2014 and May 2015, as shown in Figures 6 and 7, respectively. It can be observed that, even though the shapes and magnitudes of the groundwater contours were different between these two data collection times and those of July 2014, Figures 6 and 7 indicate a good match between the simulated and observed groundwater head distributions.
Table 3 summarizes the results of the sensitivity analysis, graphical comparison, statistical evaluation, and the predicted SGD during Scenarios 1 and 2. Graphical comparison using single Kv values of 0.2, 0.02, or 0.002 m/d across the entire model domain yielded poor visual comparison. But it clearly shows high model sensitivity to the Kv of the aquifer. Calibrating the spatial distribution of Kv based on Scenario 2 yielded a moderate visual comparison and an estimated SGD of 38 m³·yr⁻¹·m⁻¹ (Table 3). However, incorporating the IDW-generated synthetic targets yielded a good visual comparison and an SGD of 46 m³·yr⁻¹·m⁻¹. Thus, under the current data scarcity, the model would underestimate the SGD by about 17% if the IDW-generated synthetic points were not incorporated. The results show that a major Kv value of 0.2 m/d can be used for most of the aquifer, with lower Kv values down to 1 × 10⁻⁶ m/d also used near the transect bed. Across all model runs, including the sensitivity analysis runs, the RMSE remained low, even when visual comparisons suggested poor calibration. This is because of the small data range, as mentioned earlier. Thus, relying solely on RMSE as a statistical measure for evaluating the goodness of fit in model calibration is insufficient, even though the final calibrated model achieved the lowest RMSE of 0.02.
Table 3. Statistical measures and predicted submarine groundwater discharge (SGD) for the sensitivity analysis and calibration scenarios
|
Scenario |
Kv (m/d) |
Graphical Status |
RMSE (m) |
t-Test |
NSE |
Yearly SGD (m³·yr⁻¹·m⁻¹) |
|
Sensitivity analysis |
2 × 10⁻¹ |
Poor |
0.08 |
Reject |
-3.88 |
158 |
|
2 × 10⁻² |
Poor |
0.07 |
Reject |
-2.77 |
93 |
|
|
2 × 10⁻³ |
Poor |
0.08 |
Reject |
-3.39 |
31 |
|
|
Scenario 1 |
Calibration |
Moderate |
0.03 |
Accept |
0.34 |
38 |
|
Scenario 2 |
Calibration |
Good |
0.02 |
Accept |
0.82 |
46 |
The t-test results aligned well with the visual assessments. When the visual comparison indicated good calibration, the test accepted the null hypothesis of equal means (p > 0.05), whereas discrepancies in visual matching corresponded to statistically significant deviations. Furthermore, Table 3 shows that despite moderately acceptable model performance in Scenario 1, the NSE values for the calibrated model were less than satisfactory (<0.5), indicating poor calibration. The disagreement between the statistical measures and visual comparisons could be attributed to the small sample size used in the analysis.
The inclusion of 18 additional head points obtained from IDW interpolation in Scenario 2 significantly improved the NSE from 0.34 to 0.82 compared to Scenario 1. This improvement in NSE is due to improved model calibration in Scenario 2, which increased the agreement between the observed and simulated data. This enhancement in NSE, derived from the supplementary head data in Scenario 2, aligns with both the t-test results and visual calibration assessments.
It can be inferred from the statistical analysis that the Kv representation in groundwater models is a key factor controlling realistic simulations of head distribution and SGD estimation in the studied coastal aquifer.
Figure 8. Simulated submarine groundwater discharge (SGD) flow directions and salinity in July 2014 (top) and October 2014 (bottom)
This emphasizes the importance of precise representation of Kv heterogeneous distribution as opposed to using uniform values throughout the entire model domain. Poor representation of Kv distribution within numerical models remarkably shifts estimated SGD from realistic values, which would lead to inaccurate water resources management decisions. The simulations also revealed that significant volumes of SGD find their way into the lagoon. It is estimated that through each one meter of the shoreline, the lagoon received an SGD of 46 m³·yr⁻¹·m⁻¹ in July 2014, 69 m³·yr⁻¹·m⁻¹ in October 2014, and 56 m³·yr⁻¹·m⁻¹ in May 2015.
Figure 8 depicts the simulated flow patterns of SGD and the simulated salinity distribution for July 2014 and October 2014. The simulation shows that some of the SGD originates from terrestrial sources (Merritt Island and Barrier Island), while the rest originates from the Ocean and is referred to as marine SGD. Figure 8 also shows that the saltwater intrusion wedge encroaching on the sea boundary extends deeper into the aquifer in July 2014 than in October 2014. This is due to the higher terrestrial hydraulic gradient in October 2014, which creates higher advection towards the sea, pushing the saltwater wedge back. This is further explained by the higher SGD of 69 m³·yr⁻¹·m⁻¹ of shoreline estimated for October 2014, compared to 46 m³·yr⁻¹·m⁻¹ of shoreline in July 2014.
Given that SGD is one of the main conduits of contaminants into coastal aquifers, such large amounts of SGD may have potential implications for transporting large fluxes of anthropogenic nutrients into the water body, with subsequent implications for the species that reside in the lagoon. Perhaps, one of the most critical potential implications of SGD on the lagoon ecosystem is increased HABs, which can substantially reduce light penetration into the seagrass and could eventually result in devastating impacts such as fish kills. Shifting the lagoon from a seagrass-dominated to an HABs-dominated ecosystem can also pose the potential for hypoxia and anoxia following the HABs decay, leading to negative impacts on the lagoon’s species. However, in the current study, no measurements of SGD nutrient fluxes were conducted. Future studies that incorporate such measurements and quantify those potential nutrient fluxes and the associated ecological implications are needed.
This study developed a hydrological model to estimate the SGD rates into the BRL, a coastal lagoon, under data-scarce conditions. An extensive fieldwork has been conducted to characterize the site and collect head and salinity data for the model development, calibration, and validation. Due to the saline environment of the site, the collected data are limited compared to the model domain. Interpolation of collected data has been found to provide additional synthetic data that serve to improve spatial conditioning of model calibration and statistical evaluation. Significant volumes of terrestrial and marine SGD are found to reach the BRL at the study site. Such elevated SGD volumes may have potential ecological implications through nutrient transport into the lagoon waters and chemical recycling from ocean sediments. However, the severity of such impacts depends on SGD nutrient loads that are not measured in the current study.
Another key takeaway from this work is that interpolation tools, such as IDW, were useful for providing calibration targets under data-scarce conditions. However, we emphasize that interpolation does not replace field observations and thus, the proposed approach represents a practical supplementary method rather than an alternative to long-term monitoring. The NSE statistic has proven to provide a reliable evaluation of the model’s goodness of fit. However, the current approach might not be applicable to other coastal sites with different conditions; therefore, further investigations at other sites are strongly suggested.
The findings of this study are specific to the hydrogeologic setting of the BRL and may not directly apply to other coastal systems with different hydrogeologic and land-use conditions. However, similar SGD behavior might occur across other coastal environments with comparable settings. Thus, future studies at other coastal systems with both comparable and different conditions are needed to evaluate the applicability of these findings.
The findings of this work also present several practical implications for the sustainable management of coastal regions. By enhancing hydrologic simulations in data-scarce coastal areas, where monitoring is limited, the interpolation-based approach can provide solutions for the management of coastal resources by expanding spatial information. Enhanced spatial representation of data can also support better identification of coastal zones vulnerable to environmental implications such as eutrophication and saltwater intrusion. By enabling characterization of the spatial and temporal variability of SGD, sensitive and vulnerable ecological systems in data-scarce regions can be more effectively identified and subsequently protected. Finally, since coastal regions are among the most vulnerable systems facing climate change implications, such as sea level rise, reliable emulations serving under data-scarce conditions offer a useful tool for climate change mitigation and adaptation management decisions.
[1] Roy, P., Pal, S.C., Chakrabortty, R., Chowdhuri, I., Saha, A., Shit, M. (2022). Climate change and groundwater overdraft impacts on agricultural drought in India: Vulnerability assessment, food security measures and policy recommendation. Science of the Total Environment, 849: 157850. https://doi.org/10.1016/j.scitotenv.2022.157850
[2] Zhang, J., Liesch, T., Goldscheider, N. (2025). Impacts of climate change and human activities on global groundwater storage from 2003 to 2022. Journal of Hydrology, 664: 134298. https://doi.org/10.1016/j.jhydrol.2025.134298
[3] Konikow, L.F., Kendy, E. (2005). Groundwater depletion: A global problem. Hydrogeology Journal, 13(1): 317-320. https://doi.org/10.1007/s10040-004-0411-8
[4] Gleeson, T., Wada, Y., Bierkens, M.F.P., Van Beek, L.P.H. (2012). Water balance of global aquifers revealed by groundwater footprint. Nature, 488(7410): 197-200. https://doi.org/10.1038/nature11295
[5] Kurwadkar, S. (2019). Occurrence and distribution of organic and inorganic pollutants in groundwater. Water Environment Research, 91(10): 1001-1008. https://doi.org/10.1002/wer.1166
[6] Al-Taliby, W., Pandit, A. (2023). Estimation of nitrogen and phosphorus fluxes into a Barrier Island lagoon via meteoric groundwater discharge. Science of the Total Environment, 886: 163927. https://doi.org/10.1016/j.scitotenv.2023.163927
[7] Hill, M.C. (1998). Methods and Guidelines for Effective Model Calibration; with Application to UCODE, a Computer Code for Universal Inverse Modeling, and MODFLOWP, a Computer Code for Inverse Modeling with MODFLOW. Water-Resources Investigations Report 98-4005. Reston, VA: U.S. Geological Survey. https://doi.org/10.3133/wri984005
[8] Al-Taliby, W., Pandit, A., Heck, H.H., Ali, N. (2016). Numerical modeling of groundwater flow below an estuary using MODFLOW and SEAWAT—Comparison of results. In World Environmental and Water Resources Congress 2016, West Palm Beach, Florida, pp. 265-274. https://doi.org/10.1061/9780784479865.028
[9] Guo, X., Zhang, C. (2000). Hydraulic gradient comparison method to estimate aquifer hydraulic parameters under steady-state conditions. Groundwater, 38(6): 815-826. https://doi.org/10.1111/j.1745-6584.2000.tb00679.x
[10] Hart, D.J., Bradbury, K.R., Feinstein, D.T. (2005). The vertical hydraulic conductivity of an aquitard at two spatial scales. Groundwater, 44(2): 201-211. https://doi.org/10.1111/j.1745-6584.2005.00125.x
[11] Dausman, A.M., Doherty, J., Langevin, C.D., Sukop, M.C. (2010). Quantifying data worth toward reducing predictive uncertainty. Groundwater, 48(5): 729-740. https://doi.org/10.1111/j.1745-6584.2010.00679.x
[12] Moore, C., Doherty, J. (2005). Role of the calibration process in reducing model predictive error. Water Resources Research, 41(5): W05020. https://doi.org/10.1029/2004wr003501
[13] Poeter, E.P., Hill, M.C. (1997). Inverse models: A necessary next step in ground-water modeling. Groundwater, 35(2): 250-260. https://doi.org/10.1111/j.1745-6584.1997.tb00082.x
[14] Ejaz, F., Wöhling, T., Höge, M., Nowak, W. (2021). Lumped geohydrological modelling for long-term predictions of groundwater storage and depletion. Journal of Hydrology, 606: 127347. https://doi.org/10.1016/j.jhydrol.2021.127347
[15] Yang, Y., Yeh, H., Huang, C., et al. (2025). Assessing groundwater dynamics in data-scarce mountainous regions using a lumped parameter groundwater model. Terrestrial Atmospheric and Oceanic Sciences, 36(1): 28. https://doi.org/10.1007/s44195-025-00112-x
[16] Switzman, H., Coulibaly, P., Adeel, Z. (2015). Modeling the impacts of dryland agricultural reclamation on groundwater resources in Northern Egypt using sparse data. Journal of Hydrology, 520: 420-438. https://doi.org/10.1016/j.jhydrol.2014.10.064
[17] Du, X., Lu, X., Hou, J., Ye, X. (2018). Improving the reliability of numerical groundwater modeling in a data-sparse region. Water, 10(3): 289. https://doi.org/10.3390/w10030289
[18] Aghlmand, R., Abbasi, A. (2019). Application of MODFLOW with boundary conditions analyses based on limited available observations: A case study of Birjand Plain in East Iran. Water, 11(9): 1904. https://doi.org/10.3390/w11091904
[19] Barbosa, S.A., Jones, N.L., Williams, G.P., et al. (2023). Exploiting Earth observations to enable groundwater modeling in the data-sparse region of Goulbi Maradi, Niger. Remote Sensing, 15(21): 5199. https://doi.org/10.3390/rs15215199
[20] Skaskevych, A., Lee, J., Jung, H.C., et al. (2019). Application of GRACE to the estimation of groundwater storage change in a data-poor region: A case study of Ngadda catchment in the Lake Chad Basin. Hydrological Processes, 34(4): 941-955. https://doi.org/10.1002/hyp.13613
[21] Rusli, S.R., Bense, V.F., Taufiq, A., Weerts, A. (2023). Quantifying basin-scale changes in groundwater storage using GRACE and one-way coupled hydrological and groundwater flow model in the data-scarce Bandung groundwater Basin, Indonesia. Groundwater for Sustainable Development, 22: 100953. https://doi.org/10.1016/j.gsd.2023.100953
[22] Tziatzios, G., Sidiropoulos, P., Vasiliades, L., Lyra, A., Mylopoulos, N., Loukas, A. (2021). The use of the pilot points method on groundwater modelling for a degraded aquifer with limited field data: The case of Lake Karla aquifer. Water Science & Technology: Water Supply, 21(6): 2633-2645. https://doi.org/10.2166/ws.2021.133
[23] Mahmod, W.E., Watanabe, K., Zahr-Eldeen, A.A. (2013). Analysis of groundwater flow in arid areas with limited hydrogeological data using the Grey Model: A case study of the Nubian Sandstone, Kharga Oasis, Egypt. Hydrogeology Journal, 21(5): 1021-1034. https://doi.org/10.1007/s10040-013-0959-2
[24] Pande, S., Savenije, H.H.G., Bastidas, L.A., Gosain, A.K. (2012). A parsimonious hydrological model for a data scarce dryland region. Water Resources Management, 26(4): 909-926. https://doi.org/10.1007/s11269-011-9816-z
[25] Klaas, D.K.S.Y., Imteaz, M.A., Arulrajah, A. (2017). Development of groundwater vulnerability zones in a data-scarce eogenetic karst area using head-guided zonation and particle-tracking simulation methods. Water Research, 122: 17-26. https://doi.org/10.1016/j.watres.2017.05.056
[26] Castilla-Rho, J.C., Mariethoz, G., Kelly, B.F.J., Andersen, M.S. (2014). Stochastic reconstruction of paleovalley bedrock morphology from sparse datasets. Environmental Modelling & Software, 53: 35-52. https://doi.org/10.1016/j.envsoft.2013.10.025
[27] Masocha, M., Dube, T., Owen, R. (2020). Using an expert-based model to develop a groundwater pollution vulnerability assessment framework for Zimbabwe. Physics and Chemistry of the Earth, Parts A/B/C, 115: 102826. https://doi.org/10.1016/j.pce.2019.102826
[28] Yasin, K.H., Gelete, T.B., Iguala, A.D., Kebede, E. (2024). Optimal interpolation approach for groundwater depth estimation. MethodsX, 13: 102916. https://doi.org/10.1016/j.mex.2024.102916
[29] Slomp, C.P., Van Cappellen, P. (2004). Nutrient inputs to the coastal ocean through submarine groundwater discharge: Controls and potential impact. Journal of Hydrology, 295(1): 64-86. https://doi.org/10.1016/j.jhydrol.2004.02.018
[30] Santos, I.R., Burnett, W.C., Chanton, J.P., Mwashote, B., Suryaputra, I.G.N.A., Dittmar, T. (2008). Nutrient biogeochemistry in a Gulf of Mexico subterranean estuary and groundwater-derived fluxes to the coastal ocean. Limnology and Oceanography, 53(2): 705-718. https://doi.org/10.4319/lo.2008.53.2.0705
[31] Luo, M., Zhang, Y., Xiao, K., et al. (2023). Effect of submarine groundwater discharge on nutrient distribution and eutrophication in Liaodong Bay, China. Water Research, 247: 120732. https://doi.org/10.1016/j.watres.2023.120732
[32] Santos, I.R., Chen, X., Lecher, A.L., et al. (2021). Submarine groundwater discharge impacts on coastal nutrient biogeochemistry. Nature Reviews Earth & Environment, 2: 307-323. https://doi.org/10.1038/s43017-021-00152-0
[33] Montiel, D., Lamore, A., Stewart, J., Dimova, N. (2019). Is submarine groundwater discharge (SGD) important for the historical fish kills and harmful algal bloom events of Mobile Bay? Estuaries and Coasts, 42(2): 470-493. https://doi.org/10.1007/s12237-018-0485-5
[34] Scheidt, D.M., Provancha, J.A., Stolen, E.D., et al. (2026). A multi-decadal aerial survey reveals patterns in manatee abundance and response to seagrass die-offs. Frontiers in Marine Science, 13: 1725777. https://doi.org/10.3389/fmars.2026.1725777
[35] Phlips, E.J., Badylak, S., Lasi, M.A., et al. (2015). From red tides to green and brown tides: Bloom dynamics in a restricted subtropical lagoon under shifting climatic conditions. Estuaries and Coasts, 38: 886-904. https://doi.org/10.1007/s12237-014-9874-6
[36] Brown, D., Kenner, W., Crooks, J., Foster, J. (1962). Water resources of Brevard County, Florida. Report of Investigations 28, U.S. Geological Survey, Tallahassee, FL. https://doi.org/10.35256/ri28
[37] Al-Taliby, W., Pandit, A. (2017). Comparison of solutions of coupled and uncoupled models for the Henry problem. In World Environmental & Water Resources Congress 2017, Sacramento, California, United States, pp. 89-102. https://doi.org/10.1061/9780784480625.010
[38] Al-Taliby, W., Dekhn, H. (2022). Modeling of groundwater pollution by former seawater in submarine groundwater discharge driven by saltwater intrusion. Journal of Ecological Engineering, 23(2): 166-175. https://doi.org/10.12911/22998993/144393
[39] Langevin, C.D., Shoemaker, W.B., Guo, W. (2003). MODFLOW-2000, the U.S. Geological Survey Modular Ground-Water Model–Documentation of the SEAWAT-2000 Version with the Variable-Density Flow Process (VDF) and the Integrated MT3DMS Transport Process (IMT). U.S. Geological Survey Open-File Report 2003-426. Reston, VA: U.S. Geological Survey. https://doi.org/10.3133/ofr03426
[40] Loaiciga, H., Meillier, L., Clark, J. (2008). Groundwater dating and flow-model calibration in the Kern Water Bank, California. Journal of Hydrologic Engineering, 13(11): 1029-1036. https://doi.org/10.1061/(ASCE)1084-0699(2008)13:11(1029)
[41] Doherty, J. (2010). PEST: Model-Independent Parameter Estimation—User Manual: 5th edition. Watermark Numerical Computing, Brisbane, Australia. https://www.nrc.gov/docs/ML0923/ML092360221.pdf.
[42] Nash, J.E., Sutcliffe, J.V. (1970). River flow forecasting through conceptual models part I—A discussion of principles. Journal of Hydrology, 10(3): 282-290. https://doi.org/10.1016/0022-1694(70)90255-6