
Andik Isdianto* | Zulfikar Muhammad Krisdananjaya | Rudianto | Tri Djoko Lelono | Gatut Bintoro | Arief Setyanto | Nico Rahman Caesar | Gilang Rusrita Aida | Uun Yanuhar | Aulia Lanudia Fathah | Berlania Mahardika Putri | Dwi Candra Pratiwi
© 2026 The authors. This article is published by IIETA and is licensed under the CC BY 4.0 license (http://creativecommons.org/licenses/by/4.0/).
OPEN ACCESS
Sea turtle nesting beaches are priority habitats that require evidence-based spatial management under increasing human pressure along tropical coasts. This study evaluated the habitat suitability of Olive Ridley nesting beaches at Sumbreng Beach (SB) and Taman Kili-Kili Beach (TKB), Trenggalek (East Java), and assessed how suitability outputs can support operational zoning for disturbance control. Field measurements were collected in December 2022 using purposive sampling at active nesting sectors, combining beach morphology (length, width, slope), substrate characteristics (sand fraction, temperature, pH, humidity), nearshore water conditions (temperature, pH, salinity), vegetation presence, mapped built structures, distance to adjacent feeding areas, and tidal patterns. A weighted Habitat Suitability Index (HSI) framework was applied to score each attribute into three suitability classes and to compute site-level HSI values, complemented by a proportional contribution analysis and a simple one-at-a-time sensitivity check using observed field variability to identify threshold-sensitive parameters. Both sites were classified as very suitable (S1), with HSI values of 85.71% (SB) and 90.48% (TKB), driven primarily by high sand fractions and gentle beach slopes. Beach width was consistently scored as not suitable (S3) because local widths exceeded the adopted literature cutoff, while nesting activity was recorded at both sites during 2020–2022, with higher annual landings at TKB. Field observations indicated stronger night-time disturbance at SB, including artificial light spill, human presence, and debris, despite a 0% built footprint on the sandy strip at both sites. Overall, the results indicate that short-term, night-time disturbance management is likely more actionable than geomorphic intervention for these beaches. The study demonstrates how HSI outputs can be translated into zoning-compatible, auditable rules that prioritize protecting a functional dark, low-traffic nesting corridor while directing access and facilities to lower-suitability sectors.
Olive Ridley turtle, nesting habitat, Habitat Suitability Index, coastal zoning, light pollution, night-time disturbance, community-based monitoring, Trenggalek
Sea turtles are long-lived marine reptiles of high ecological and cultural significance. Six of the seven global species occur in Indonesia: green turtle (Chelonia mydas), hawksbill turtle (Eretmochelys imbricata), Olive Ridley turtle (Lepidochelys olivacea), loggerhead turtle (Caretta caretta), flatback turtle (Natator depressus), and leatherback turtle (Dermochelys coriacea) [1]. Among them, the Olive Ridley is the most abundant, yet its population has declined significantly, leading to its classification as Endangered by the IUCN and its listing in Appendix I of CITES [2, 3]. As flagship species, sea turtles function as indicators of coastal ecosystem health and serve as catalysts for community-based conservation and sustainable tourism. Sustaining nesting beaches is therefore directly linked to biodiversity protection and to maintaining coastal socio-ecological benefits.
The success of sea turtle nesting is intrinsically linked to the biophysical characteristics of beaches, such as sand granulometry, slope, vegetation cover, and microclimate, which are crucial for successful incubation and hatching [4]. These vital habitats, however, face escalating pressures from climate variability [5], predation [6], coastal development, egg harvesting, and unregulated tourism [2]. Olive Ridleys exhibit natal homing, but their nesting strategy can be flexible when disturbance increases, including shifts to alternative sites when established grounds become degraded [7, 8]. This flexibility does not reduce conservation urgency; instead, it expands the set of sites that may need protection as “backup” or emerging rookeries. For coastal governance, nesting beaches thus represent priority areas where targeted, evidence-based impact management is essential.
Habitat Suitability Index (HSI) models are commonly used to integrate multiple environmental attributes into interpretable suitability classes that support conservation planning. HSI approaches provide a structured way to summarize complex habitat conditions and offer a transparent basis for comparing sites using consistent variables, thresholds, and weights. However, many applications remain largely descriptive at the site level and stop at classification, without translating HSI outputs into operational rules that can be monitored and audited in the field. This limitation is especially relevant in nesting systems where short-term, human-driven pressures-lighting, night-time access, and debris-can shift rapidly within a single nesting season. As a result, static geomorphic indicators may not fully reflect the functional nesting space available at night, even when overall biophysical suitability is high. Within sea turtle nesting contexts, this limitation is most evident when suitability scores are reported without a mechanism that converts them into verifiable disturbance controls on the nesting strip.
Indonesia has established spatial planning instruments-the Coastal Area and Small Islands Zoning Plan (RZWP3K) and the Essential Ecosystem Area (EEA) framework-that legally integrate ecological protection with development control. In practice, a gap often persists between habitat science and spatial policy because quantitative ecological assessments are seldom embedded as explicit zoning and permitting conditions. This gap matters because enforceability typically depends on clear, measurable requirements (e.g., night-access rules and lighting controls) rather than broad policy statements alone. In this study, HSI is used not only to quantify habitat conditions, but also to support an operational zoning logic-core, buffer, and limited-use-that can be aligned with RZWP3K/EEA implementation [6]. Translating habitat evidence into zoning-compatible rules is therefore treated as a central motivation, not as an afterthought.
Community participation is critical for long-term effectiveness and social legitimacy of nesting-site protection, particularly where routine monitoring and compliance depend on local capacity. In Trenggalek, community-based groups such as POKMASWAS support nest monitoring and protection and provide on-the-ground implementation of site rules [9]. Despite the availability of spatial planning instruments (RZWP3K/EEA), studies in the region still rarely demonstrate a clear pathway that connects quantitative habitat assessment outputs (e.g., HSI classes) to planning-compatible zoning rules that can be implemented and checked through local participation. This context makes community-based monitoring a practical mechanism for making HSI-informed zoning auditable, rather than an optional add-on. Embedding monitoring roles in the zoning logic also helps ensure that disturbance controls can be evaluated consistently across seasons.
Prior work has characterized Olive Ridley nesting at Taman Kili-Kili Beach (TKB) [10], but no equivalent standardized habitat assessment has been reported for the adjacent Sumbreng Beach (SB). This imbalance creates a practical evidence gap for regional planning because decisions on access, facilities, or coastal use may proceed without comparable ecological information for SB. A paired assessment of SB and TKB therefore provides a more consistent basis for prioritization and for interpreting site-level constraints under the same HSI framework. Accordingly, this study evaluates nesting habitat suitability at SB and TKB using an HSI workflow, identifies the attributes that most constrain suitability under the adopted scoring scheme, and proposes an HSI-informed zoning and monitoring approach aligned with RZWP3K/EEA and community-based implementation. The intent is to strengthen the linkage from index-based screening to measurable disturbance controls in core nesting spaces, rather than to generalize thresholds beyond the study area.
2.1 Study area and study design
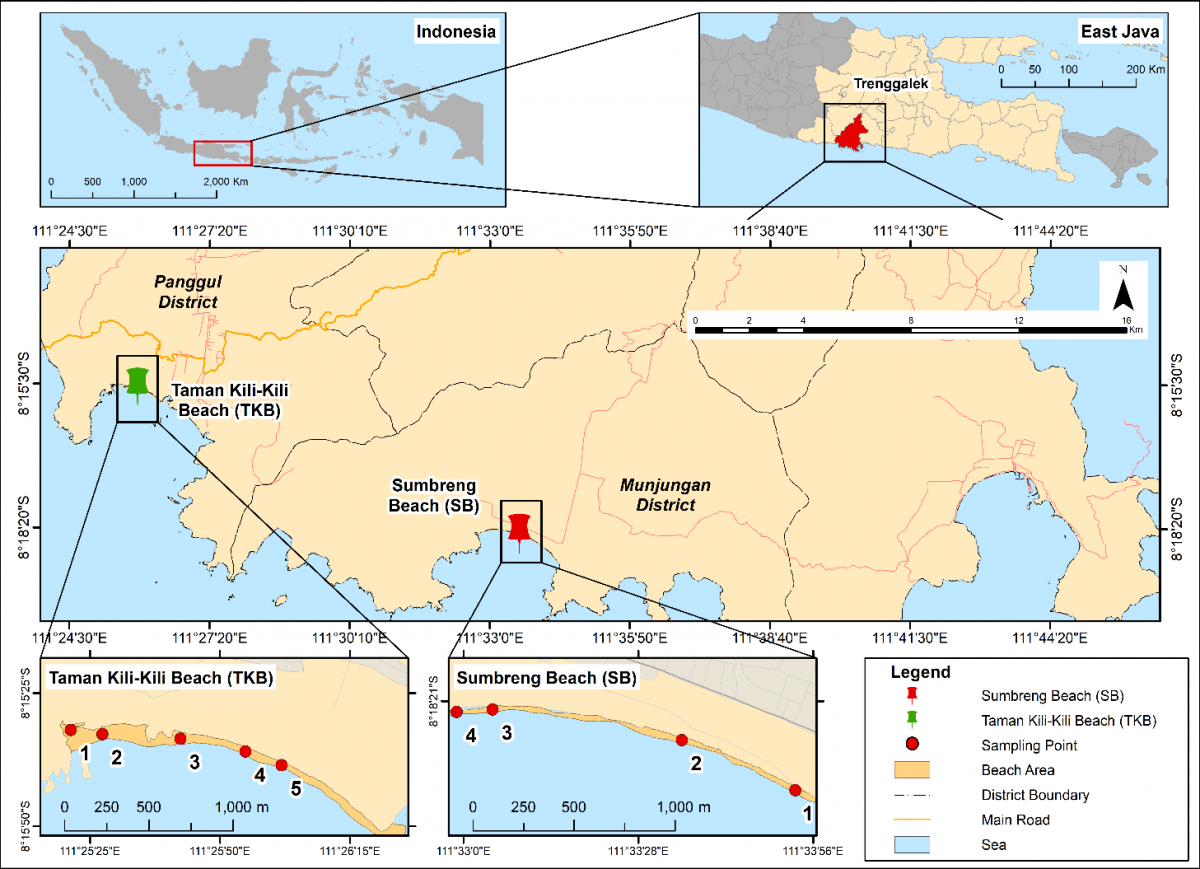
This study was conducted at two primary nesting sites for the Olive Ridley turtle in Trenggalek, East Java: SB in Munjungan District and TKB in Panggul District. Field data collection took place in December 2022. Observation points were determined by purposive sampling, focusing on areas with recent records of sea turtle nesting activity (Figure 1).
Figure 1. Study location
At each site, we measured biophysical attributes relevant to Olive Ridley nesting. These included macro-scale parameters (beach length, width, slope) and substrate-specific parameters (granulometric composition, temperature, pH, humidity). We also recorded contextual variables such as beach vegetation, presence of built structures, distance to nearest feeding areas (coral reefs), and hydro-oceanographic conditions (water pH, temperature, salinity, tidal patterns).
2.2 Data collection and measurements
Beach length and width were measured ex situ in ArcGIS by heads-up digitizing. Width was defined as the combined extent of the supratidal and intertidal zones [10]. Beyond geometric width, we interpret an effective dark-corridor width at night as the undisturbed, low-light nesting strip used as a management metric. This concept informs zoning but does not alter field measurements. Beach slope was measured in situ along transects perpendicular to the shoreline using a tape, staff, and spirit level, with the angle (°) computed following research [11]. Substrate attributes were measured within the primary nesting zone. Water parameters were recorded in situ in the nearshore using calibrated field meters. Built structures were mapped by digitizing building footprints within the beach buffer and expressed as a percentage of the sandy beach area. Distance to feeding areas was calculated as the shortest straight-line distance from the nesting sector to the nearest coral reef patch. Unless otherwise stated, continuous variables are reported as mean ± SD with 95% confidence intervals (95% CI) and sample sizes (n).
2.3 Habitat Suitability Index scoring and thresholds
Habitat suitability was evaluated using an HSI model, with variables, scoring thresholds, and weights adopted from established standards for sea turtle nesting habitats [12, 13]. Each measured variable was converted into a suitability score using literature-based thresholds (Table 1) and classified into three categories: S1 (Very Suitable; score = 3), S2 (Suitable; score = 2), and S3 (Not Suitable; score = 1). Where Roman numerals are used in tables, they correspond to the same classes (I = S1, II = S2, III = S3). Site-level HSI values were classified into S1-S3 using the thresholds in Table 2.
Table 1. Habitat Suitability Index (HSI) matrix
|
No. |
Biophysical Attributes |
Weight |
Suitability |
Source |
||
|
S1 |
S2 |
S3 |
||||
|
1 |
Beach Slope Angle (°) |
3 |
1–30 |
31–58 |
>58 |
[12] |
|
2 |
Beach Width (m) |
3 |
25–43 |
7–24 |
<7/>43 |
[12] |
|
3 |
Vegetation |
3 |
Vegetation Present |
No Vegetation/Open Land |
Buildings and water |
[12] |
|
4 |
Sand Fraction (%) |
5 |
96–99 |
90–96 |
<90 |
[14, 15] |
|
5 |
Slope Gradient (%) |
3 |
Flat (0–3), Slope (3–8) |
Slope (8–16), Slightly Steep (16–30) |
Steep > 65, Very steep |
[12] |
|
6 |
Buildings (%), calculated on sandy beach zone only |
1 |
0 |
1–3 |
>3 |
[16] |
|
7 |
Distance to Feeding Area (km) |
3 |
0 |
1–5 |
>5 |
[17] |
Table 2. Habitat Suitability Index (HSI) standards
|
No. |
Description |
Score |
|
1 |
Very Suitable (S1) |
HSI > 69.86% |
|
2 |
Suitable (S2) |
HSI (66.67%–69.86%) |
|
3 |
Not Suitable (S3) |
HSI < 66.67% |
Notes: Nmax = 63 represents the maximum possible weighted score when all habitat variables receive the highest suitability score.
A specific methodological note applies to the Beach Width parameter. The adopted framework classifies widths >43 m as S3 [12]. Because this threshold may not fully capture the night-time usable nesting strip under human disturbance conditions, we retained the standard scoring for consistency and evaluated its local interpretability in the Discussion as a potential source of underestimation for otherwise suitable wide beaches.
2.4 Weighting scheme
Variable weights ($w_i$) followed the adopted HSI framework (Table 1) [12, 13]. Sand fraction was given the highest weight (weight = 5) because substrate composition directly affects nest chamber stability, gas exchange, and thermal buffering. Beach morphology, including beach slope and width (weight = 3), was included, reflecting its influence on accessibility and available nesting space. Remaining contextual variables (e.g., vegetation, built structures on the sandy strip, and distance to feeding area) were weighted as specified in Table 1 to ensure transparent and consistent parameterization.
2.5 Habitat Suitability Index computation and classification
2.5.1 Data summary
For each site, transects and samples were treated as replicates. Continuous variables (e.g., beach width, slope, substrate temperature-ST, substrate pH-SpH, substrate humidity-SH; and, where applicable, water temperature-WT, water pH-WpH, salinity-WS) as mean ± SD with the corresponding sample size. No inferential hypothesis tests were conducted because the HSI was applied as a screening and decision-support assessment rather than a hypothesis-testing framework.
2.5.2 Habitat Suitability Index calculation
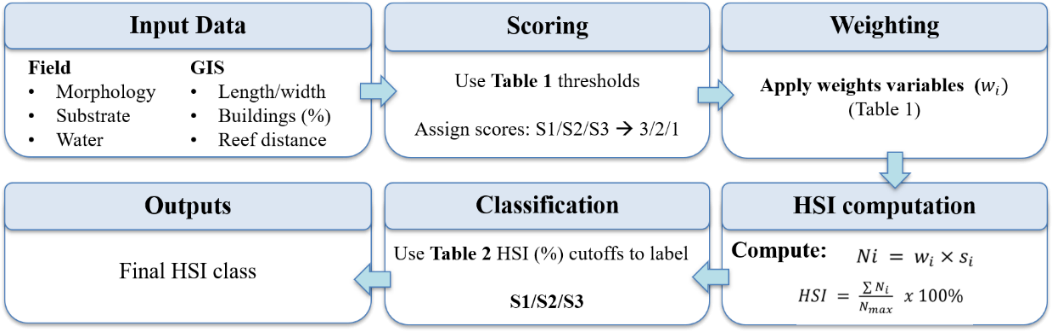
Habitat suitability was evaluated using the HSI classes and weights ($w_i$) defined in Table 1 and Table 2. The overall HSI assessment workflow is summarized in Figure 2. Each variable was first assigned a suitability score (3, 2, or 1) ($s_i$) based on the threshold ranges in Table 2 (S1 = 3, S2 = 2, S3 = 1). Weighted scores were then calculated as:
$N_i=w_i \times s_i$ (1)
and aggregated to compute the site-level index:
$H S I=\frac{\sum N_i}{N_{\max }} \times 100 \%$ (2)
where, $N_i$ is the weighted score for variable $i, ~w_i$ is the variable weight, $S_i$ is the suitability score, and $N_{\text {max }}$ is the maximum possible weighted score when all variables receive a score of 3. In this configuration, $N_{\max }=63$.
Figure 2. Workflow of Habitat Suitability Index (HSI)
2.5.3 Classification, contributions, and scenario
Site-level HSI values were then classified into S1–S3 using the thresholds in Table 2, and parameter definitions and scoring ranges are summarized in Table 1.
$P_i=\frac{N_i}{\sum N_i} \times 100 \%$ (3)
Additionally, an illustrative single-parameter scenario was evaluated by changing the Beach Width class from S3 to S1 while holding other variables constant to demonstrate the influence of width classification on HSI outcomes.
2.6 Ethics and compliance
All field activities were strictly non-invasive: no turtles, eggs, or nests were handled, captured, or removed, and observations were conducted at prescribed distances and within permitted hours. The work complied with Indonesian regulations on the protection of sea turtles and their habitats and was carried out with the knowledge and permission of local site managers and conservation authorities (including POKMASWAS) at Sumbreng and Taman Kili-Kili.
2.7 Uncertainty and sensitivity check
A simple one-at-a-time sensitivity check was conducted to avoid treating the HSI as purely deterministic. For each continuous attribute measured in the field, inputs were perturbed within the observed variability (mean ± SD; n = 3), and the suitability score (S1–S3) was reassigned using the same thresholds in the adopted HSI matrix. All other variables and weights were held constant, and the resulting change in HSI (ΔHSI) and whether the site-level HSI class changed were recorded for SB and TKB. This check was intended as a transparency step to identify threshold-sensitive parameters rather than a full probabilistic uncertainty analysis.
3.1 Site characteristics of nesting beaches (Sumbreng Beach vs Taman Kili-Kili Beach)
We assessed key beach morphology and nearshore physicochemical parameters at two nesting sites in SB and TKB. Comparative results are reported in Table 3 and Table 4.
3.1.1 Beach morphology and slope
Beach morphology strongly shapes Olive Ridley nesting outcomes [18]. As shown in Table 3, SB had a longer shoreline than TKB (3,572 vs 1,483 m), and both exceeded the 867 m suitability threshold [19]. Beach width exceeded the reported optimal range (7–43 m) [12] at both sites (SB 50.9 ± 8.48 m; TKB 57.26 ± 17.36 m). Mean beach slope angles were very gentle at both sites (SB 1.49 ± 0.62°; TKB 2.03 ± 0.72°), with corresponding slope gradients of 2.60 ± 1.07% and 3.55 ± 1.26%, both within favorable bands that support access and reduce erosion risk [20]. Slope and width are commonly evaluated together in nest-site selection [21, 22]; coastal permits should reflect this configuration through setback and night-access rules to minimize trampling and edge erosion.
Table 3. Environmental parameters at Sumbreng Beach (SB) and Taman Kili-Kili (TKB)
|
Parameters |
SB |
TKB |
Standard |
|
Beach Length (m) |
3,572 |
1,483 |
867 [12] |
|
Beach Width (m) |
50.9 ± 8.48 |
57.26 ± 17.36 |
7–43 [12] |
|
Beach Slope (°) |
1.49 ± 0.62 |
2.03 ± 0.72 |
1–58 [12] |
|
Beach Slope (%) |
2.60 ± 1.07 |
3.55 ± 1.26 |
0–30 [12] |
|
Substrate Type (%) |
Sand: 99.52; Gravel: 0.48 |
Sand: 100 |
Sand: 90–99 [12] |
|
ST (℃) |
30.5 ± 1.22 |
30.4 ± 2.95 |
24–32 [23] |
|
SpH |
7.1 ± 0.2 |
6.97 ± 0.04 |
6.5–7.5 [24] |
|
SH (%) |
39 ± 4.14 |
31.7 ± 1.40 |
35–45 [25, 26] |
|
WT (℃) |
28.1 ± 0.05 |
30.8 ± 0.06 |
20–30 [27] |
|
WpH |
6.8 ± 0.02 |
6.8 ± 0.01 |
7–8.5 [28] |
|
WS (ppt) |
31 |
33 |
20–35 [27] |
Note: Sumbreng Beach (SB), Taman Kili-Kili Beach (TKB), Substrate Temperature (ST), Substrate pH (SpH), Substrate Humidity (SH), Water Temperature (WT), Water pH (WpH), and Water Salinity (WS).
Table 4. Beach vegetation
|
No. |
Latin Name |
Local Name |
SB |
TKB |
|
1 |
Cocos nucifera |
Coconut |
√ |
√ |
|
2 |
Pandanus tectorius |
Pandan Laut |
√ |
√ |
|
3 |
Ipomoea pes- caprae |
Beach Morning Glory |
√ |
√ |
|
4 |
Casuarina equisetifolia |
Sea Casuarina |
√ |
√ |
|
5 |
Barringtonia asiatica |
Butun |
√ |
× |
|
6 |
Thespesia populnea |
Waru Laut |
√ |
× |
|
7 |
Terminalia catappa |
Ketapang |
√ |
√ |
|
8 |
Centella asiatica |
Asiatic Pennywort |
× |
× |
|
9 |
- |
Shrub plants |
√ |
√ |
Note: Sumbreng Beach (SB), Taman Kili-Kili Beach (TKB).
3.1.2 Substrate and nearshore environmental conditions
Substrate composition is a primary ecological driver [23]. According to Table 3, SB (sand 99.52%) and TKB (sand 100%) exhibited highly sandy substrates that support gas exchange, moisture retention, and hatchling emergence [22, 23]. This supports a low-regret management strategy that prioritizes maintaining a dark, open sandy nesting corridor while reducing disturbance rather than modifying beach geomorphology.
Substrate temperatures were within the preferred incubation range (SB: 30.5 ± 1.22 ℃; TKB: 30.4 ± 2.95 ℃; reference range: 24–32 ℃) [24]. Substrate pH was near neutral at both sites (SB: 7.1 ± 0.2; TKB: 6.97 ± 0.04; reference range: 6.5–7.5) [25]. Substrate humidity at SB (39.0 ± 4.14%) was within the adopted 35–45% reference range, whereas TKB (31.7 ± 1.40%) was below it. Moisture conditions are ecologically relevant because variation in nest moisture can influence incubation conditions and subsequent hatchling performance [26]. In nearshore waters, WT values of 28.1–30.8 ℃ and WS values of 31–33 ppt were broadly consistent with reported guidance [19], while WpH at both sites was approximately 6.8, slightly below the 7–8.5 reference range [27], warranting routine water-quality monitoring. Overall, environmental conditions were generally supportive of nesting and hatching, although targeted monitoring remains advisable where measured conditions approach or fall outside reference ranges, particularly for substrate humidity at TKB and nearshore WpH at both sites.
3.1.3 Beach vegetation
Olive Ridleys tend to nest in more open areas away from dense vegetation, with multiple studies reinforcing preferences for open sands over shaded sites [7, 29]. SB and TKB share dominants such as Pandanus tectorius and Ipomoea pes-caprae, with Cocos nucifera common at SB (Table 4).
3.1.4 Percentage of beach structures
Built structures were located outside the sandy strip at both sites, yielding 0% built footprint on sand (Table 5) [30, 31]. Total mapped building areas were ±854 m² (SB) and ±1,801 m² (TKB). Although no buildings directly occupied the sandy nesting strip, indirect anthropogenic pressures, such as artificial light spillover and night-time human activity, may still affect nesting-site suitability. Therefore, spatial controls should be complemented by lighting standards and regulated night access.
Table 5. Percentage of beach structures
|
Station |
Area (m2) |
Building Area (m2) |
Building Percentage |
|
SB |
±182,172 |
±854 |
0% |
|
TKB |
±84,531 |
±1,801 |
0% |
Note: Sumbreng Beach (SB), Taman Kili-Kili Beach (TKB).
3.1.5 Distance from beach to feeding area
The distances from the nesting beaches to adjacent coral reefs (SB: approximately 1.51 km; TKB: approximately 0.98 km) are ecologically relevant because shorter commuting distances can improve foraging efficiency and reduce energetic costs [30, 31]. Coral reefs function as critical feeding habitats supporting turtle populations and ecosystem health [32, 33]; reef degradation alters prey availability and foraging behavior [34]. From a management standpoint, seasonal regulation of nearshore fishing during peak nesting months can reduce bycatch risk along these commuting corridors (Table 6).
Table 6. Distance from beach to feeding area
|
Station |
Distance to Feeding Area (km) |
|
SB |
±1.51 |
|
TKB |
±0.98 |
Note: Sumbreng Beach (SB), Taman Kili-Kili Beach (TKB).
3.1.6 Tidal patterns
Average tidal height of ~77 cm at both sites lies within the 20–80 cm band supportive of nesting approaches [14]. Tidal phase is known to modulate landing timing and incubation outcomes [35]. Olive Ridley landings can synchronize with favorable tidal cycles that improve reproductive efficiency [36]. Nesting females typically use higher tides to reach the supratidal zone and retreat on the ebb, reducing locomotion costs [37]. Accordingly, seasonal tide windows should guide night-access scheduling and beach-cleaning timing to minimize disturbance during peak nocturnal activity.
3.2 Nesting activity/landings of Olive Ridley turtles (2020–2022)
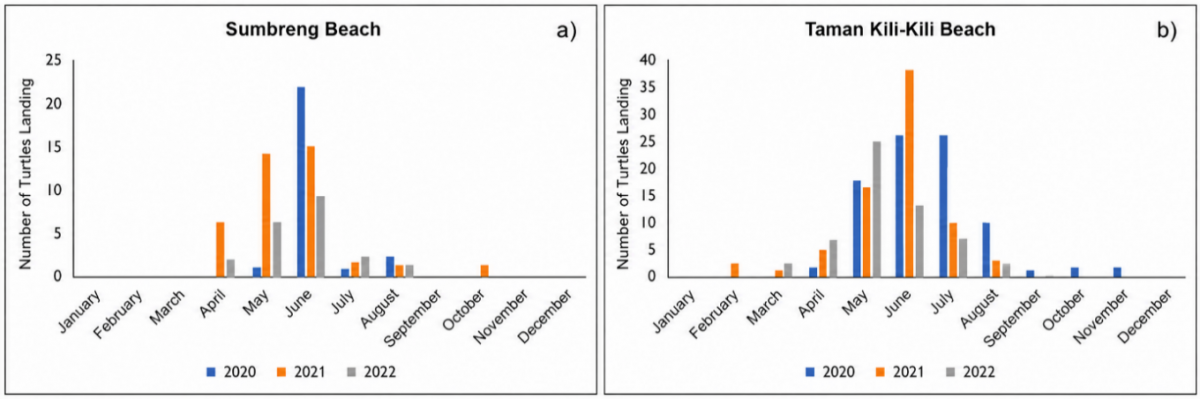
Based on landing records from 2020–2022, TKB consistently hosted higher numbers of turtle landings than SB (Table 7). Species composition differs between sites: TKB recorded only Olive Ridley turtles, whereas SB supported a broader assemblage (Hawksbill, Loggerhead, Olive Ridley, Flatback, and Green) according to POKMASWAS reports. Seasonally, landings occurred from April-October at SB and February–November at TKB (Figure 3), with a shared peak during April–August. Monthly maxima varied-e.g., SB peaked in June 2020, whereas TKB peaked in June 2021; annual totals were highest at TKB in 2020 (85 landings; Table 7). A causal attribution to specific external drivers cannot be confirmed from the available landing records alone.
Table 7. Number of turtle landings (2020–2022)
|
Station |
2020 |
2021 |
2022 |
|
SB |
22 |
38 |
20 |
|
TKB |
85 |
76 |
56 |
Note: Sumbreng Beach (SB), Kili-Kili Beach (TKB).
Figure 3. Graph of turtle landings from 2020–2022: (a) Sumbreng Beach (SB); (b) Taman Kili-Kili Beach (TKB)
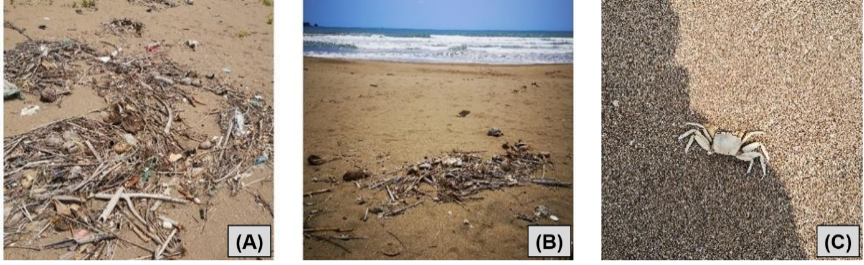
Figure 4. Threats to sea turtle nesting sites: (a) Marine debris at Sumbreng Beach (SB), (b) marine debris at Taman Kili-Kili Beach (TKB), (c) ghost crab (Ocypode sp.) observed as a potential predator of eggs and hatchlings
The monthly series indicates a consistent seasonal pattern across sites, with landings concentrated in the April–August period and low, sporadic counts outside the peak season (Figure 3). SB shows a shorter landing window (April–October) compared with TKB (February–November), while the largest monthly peaks occur in the early–mid dry season (Figure 3). These descriptors are reported to characterize season length and peak timing; the current dataset does not include standardized observation effort or covariate logs (e.g., storm events, visitor intensity, lighting compliance), so drivers of interannual peaks cannot be formally assessed.
3.3 Observed threats and predators
At SB, the following were observed: port-related activity, nearshore fishing activity, visible artificial lighting, human presence at night, and marine debris (Figure 4(A) and (B)). At TKB, overall human activity was observed to be lower during the survey period. Although whale sharks (Rhincodon typus) occur near SB, their planktivorous diet makes them unlikely primary predators; observed risks are better explained by anthropogenic disturbance and common nest predators (e.g., Ocypode crabs, ants; Figure 4(C)). Egg consumption has declined following conservation efforts, but community vigilance and enforcement remain essential.
3.4 Habitat Suitability Index of Olive Ridley turtle
In Table 8, both sites scored S3/III for beach width, while other attributes were mostly S1/I. The HSI classified both sites as S1, with HSI values of 85.71% (SB) and 90.48% (TKB) (Table 9). The primary between-site difference in the scoring matrix was distance to feeding area (SB score 2 vs TKB score 3; Table 9).
Table 8. Scoring of Olive Ridley turtle habitat suitability
|
No. |
Biophysical Attributes |
Weight |
SB |
TKB |
|
1 |
Beach Slope Angle (°) |
3 |
1.49 ± 0.62 (I) |
2.03 ± 0.72 (I) |
|
2 |
Beach Width (m) |
3 |
50.9 ± 8.48 (III) |
57.26 ± 17.36 (III) |
|
3 |
Vegetation |
3 |
Vegetated (I) |
Vegetated (I) |
|
4 |
Sand Fraction (%) |
5 |
99.52 (I) |
100 (I) |
|
5 |
Slope Gradient (%) |
3 |
2.60 ± 1.07 (I) |
3.55 ± 1.26 (I) |
|
6 |
Buildings (%) |
1 |
0 (I) |
0 (I) |
|
7 |
Distance to Feeding Area (km) |
3 |
±1.51 (II) |
±0.98 (I) |
Note: Roman numerals indicate suitability class: I = S1 (very suitable; score 3), II = S2 (suitable; score 2), III = S3 (not suitable; score 1), Sumbreng Beach (SB), Taman Kili-Kili Beach (TKB).
Table 9. Assessment of habitat suitability
|
No. |
Biophysical Attributes |
Weight |
SB (Score) |
Ni |
TKB (Score) |
Ni |
|
1 |
Beach Slope Angle |
3 |
3 |
9 |
3 |
9 |
|
2 |
Beach Width |
3 |
1 |
3 |
1 |
3 |
|
3 |
Vegetation |
3 |
3 |
9 |
3 |
9 |
|
4 |
Sand Fraction |
5 |
3 |
15 |
3 |
15 |
|
5 |
Slope Gradient |
3 |
3 |
9 |
3 |
9 |
|
6 |
Buildings-Structures |
1 |
3 |
3 |
3 |
3 |
|
7 |
Distance to Feeding Area |
3 |
2 |
6 |
3 |
9 |
|
Total |
21 |
54 |
|
57 |
|
|
|
Habitat Suitability Index (HSI) (%) |
|
85.71 |
|
90.48 |
|
|
Note: Suitability scores: 3 = S1 (very suitable), 2 = S2 (suitable), 1 = S3 (not suitable). Ni= weight × score. Sumbreng Beach (SB), Taman Kili-Kili Beach (TKB).
4.1 Key drivers of differences between Sumbreng Beach and Taman Kili-Kili Beach
Landings were recorded at both sites (Table 7; Figure 3) even though beach width was scored S3/III at SB and TKB, indicating that site use can occur across a range of beach-width conditions under the applied scoring scheme. The two beaches also share several supportive physical attributes (Table 3 and Table 8). However, annual landing totals differed across 2020–2022 and remained consistently higher at TKB, which also showed a longer landing window (Table 7; Figure 3). These patterns indicate that factors beyond beach geometry may contribute to differences in site use.
Field observations showed that night-time disturbance was generally greater at SB than at TKB. This interpretation is consistent with comparative evidence that anthropogenic pressure can contribute to divergent outcomes among nearby nesting rookeries [38, 39]. However, linking specific monthly peaks or annual differences to particular disturbance factors is beyond the resolution of the present landing records because the dataset does not include effort-standardized monitoring or disturbance covariates.
Hydro-oceanographic conditions were broadly supportive at both sites. The mean tidal height (~77 cm) lies within a range that facilitates access to the supratidal zone for nesting and return movements [36]. Because tidal conditions were similar at SB and TKB, they are unlikely to fully explain the observed differences in landing frequency.
4.2 Interpretation of Habitat Suitability Index and potential bias/limitations of scoring
The coexistence of an overall S1 classification with an S3/III beach-width score indicates that the HSI is sensitive to the adopted width threshold. Mean beach width at both sites exceeded the >43 m cutoff, although nesting activity was still recorded, suggesting that this literature-derived threshold may not fully capture local functional nesting conditions. The width classification should therefore be interpreted as a threshold-sensitive constraint rather than evidence that the beaches are generally unsuitable. More broadly, the HSI functions here as a structured screening tool whose local interpretation depends on the transferability of individual thresholds. The functional implication of this mismatch is further developed through the dark-corridor concept in Section 4.4.
4.3 Limiting factors and threats to nesting success
Field observations indicated that anthropogenic disturbance was more pronounced at SB than at TKB. At SB, observed pressures included port-related activity, nearshore fishing activity, visible artificial lighting, human presence at night, and marine debris on or near the nesting area (Figure 4). At TKB, overall human activity was lower during the survey period. These differences are important because both beaches otherwise showed broadly suitable biophysical conditions, suggesting that local disturbance may reduce the functional quality of nesting habitat even where overall HSI values remain high.
Among these pressures, night-time disturbance is particularly relevant. Artificial light spill and human presence can interfere with nesting behavior and hatchling orientation [37]. Nearshore fishing activity may also increase disturbance and bycatch risk along turtle movement corridors, particularly in coastal areas influenced by port-related activities [40]. More broadly, anthropogenic development and nocturnal human activity can reduce the functional quality of marine turtle nesting beaches [41]. Notably, the sandy strip itself had a 0% built footprint at both sites (Table 5), indicating that disturbance may remain substantial even when facilities are located outside the nesting strip, particularly where lighting is visible from the beach, or night-time access is unmanaged.
Marine debris was observed at both sites and may act as a physical barrier and an additional source of beach-level disturbance (Figure 4). Biological threats were also present but appeared to be more localized. Potential nest predators such as ghost crabs (Ocypode sp.) and ants were observed (Figure 4) and may affect eggs or hatchlings.
Hydro-oceanographic conditions were generally supportive during the study period; however, nearshore water pH was approximately 6.8 at both SB and TKB, slightly below the 7–8.5 guideline, supporting the need for routine water-quality vigilance (Table 3) [42]. Overall, the evidence indicates that night-time disturbance and marine debris represent the most directly observed and manageable pressures, while fishing-related risk, predation, and water quality remain additional factors requiring monitoring.
4.4 Functional dark corridor framework
The HSI pattern observed at both sites-high overall suitability (S1) alongside a consistently low width score (S3/III) at both SB and TKB-highlights a recurring mismatch between overall site suitability and the literature-based beach-width threshold used in the adopted scoring framework (Table 8 and Table 9). This suggests that the main practical constraint is not beach width per se, but the effective night-time nesting corridor, defined here as the portion of the sandy strip that remains dark and low-traffic during nesting and return movements.
Table 10. Habitat Suitability Index (HSI)-informed zoning and adaptive compliance indicators
|
Zone |
Concise Definition |
Core Rule(s) and Measure(s) |
Key Indicator(s) |
Adaptive Trigger → Response |
|
Core nesting corridor (S1-dominant) |
Main sandy strip used for nesting; must remain dark and low-traffic at night |
Restrict unmanaged night access during peak months; ensure no direct light visibility toward the sandy strip (shield/redirect/relocate fixtures); route necessary movement behind vegetation. |
Light visible from sandy strip (Y/N); night-incursion count (#/night); monthly landings/nests (trend) |
Recurrent visibility/incursions → extend restricted hours; upgrade shielding/relocate lights; shift to guided-only access and tighter enforcement |
|
Buffer zone (transition belt) |
Vegetated/backshore belt acting as light screen and controlled access route |
Maintain vegetation as screen; keep activities controlled; apply shielded lighting; provide signage and guided routing; targeted debris control near access points. |
Spillover light at corridor edge (Y/N); route violations (#); debris hotspot occurrence (Y/N) |
Rising spillover/violations → tighten routing; add shielding; increase patrol frequency during peak months |
|
Limited-use zone (S2–S3-dominant) |
Visitor/facility area kept away from the corridor; should not expand toward sandy strip |
Concentrate amenities here; prohibit beach-facing lights (full cut-off, oriented away); manage crowding; strengthen waste management; night activities only under supervision. |
Any light visible from sandy strip (Y/N); unmanaged crowding events (#); litter overflow (Y/N) |
Repeated non-compliance → relocate/retrofit fixtures; restrict operating hours; cap visitors; strengthen enforcement |
Note: Zoning emphasizes the functional night-time nesting strip (“dark corridor”) and observed night-time disturbance. Monitoring is intensified during peak landing months.
A specific operational definition is applied in this study. The dark corridor is treated as a functional night-time spatial unit and is operationalized using auditable disturbance proxies, including light visibility from the sandy strip (yes/no) and night-time incursion frequency (entries per night) (Table 10). This framing is useful because it directs management toward short-term controls (light visibility and night-time access) rather than toward geomorphic modification. Wider beach profiles may also interact with night-time disturbance (e.g., artificial lighting and human access) by reducing the extent of the sandy strip that remains functionally dark and undisturbed for nesting (i.e., narrowing the effective dark corridor) [43]. This interpretation is consistent with reports that Olive Ridleys tend to prefer long shorelines with relatively sheltered, narrower oviposition strips [12, 44]. Accordingly, the practical leverage point is to protect a usable corridor through lighting control and guided night access routed behind vegetation, instead of attempting to modify beach morphology.
To operationalize the corridor concept at the site level, HSI outputs and suitability classes can be translated into a simple zoning arrangement-core (S1-dominant) nesting corridor, buffer (mixed S1-S2 backshore/adjacent areas), and limited-use (S2-S3) access and facility sectors-so that the highest-suitability corridor is protected while human activities are concentrated in lower-suitability sectors [45, 46]. Consistent with evidence from protected-area settings, suitability-based zoning can improve nesting outcomes when it actively reduces disturbance within core nesting spaces [47]. In this study, the corridor/zoning framework functions as a conceptual and interpretive layer that links the HSI-width mismatch (Table 8 and Table 9) to monitoring-ready site rules with auditable indicators (Table 10), rather than as a standalone practical suggestion.
4.5 Policy integration, participation, and ecotourism management
4.5.1 Policy integration (RZWP3K and essential ecosystem area)
Integrating HSI-informed zoning with existing coastal planning instruments can strengthen the practical application of nesting-habitat protection. Core nesting corridors may be treated as higher-protection areas, buffer zones as protective transition belts, and limited-use sectors as areas where controlled activities can be accommodated under relevant coastal spatial-planning arrangements [48]. Alignment with RZWP3K and Essential Ecosystem Area (EEA) frameworks can provide a planning basis for incorporating ecological considerations into decisions concerning tourism and coastal development [49].
HSI-derived spatial information may also support environmental assessment and permitting by informing site-specific conditions, such as restrictions on night-time access, lighting controls, and seasonal monitoring. These measures can complement broader ecosystem-management objectives and conservation-oriented coastal use [50]. Their effectiveness, however, depends on implementation capacity, local monitoring, and coordination among responsible institutions and community groups.
4.5.2 Community participation (community-based planning)
Community engagement is important for translating zoning provisions into consistent site-level implementation. Local surveillance and stewardship groups such as POKMASWAS can support nest monitoring, reporting, and compliance activities at both sites [51, 52]. Participatory planning may also improve the legitimacy and feasibility of seasonal restrictions, including controlled night-time access during peak nesting periods [53, 54]. Co-management approaches can further link conservation responsibilities with locally acceptable livelihood options and shared stewardship arrangements [55-57]. Accordingly, community participation should be considered an implementation mechanism supporting HSI-informed zoning rather than a separate component of habitat suitability assessment.
4.5.3 Sustainable ecotourism
HSI-informed zoning can provide a spatial basis for directing visitor activities away from core nesting corridors. Limited-use sectors may accommodate low-impact ecotourism where visitor activities remain spatially separated from nesting areas and are subject to explicit disturbance controls [58]. Locally managed ecotourism may also support alternative livelihoods, conservation outreach, and environmental education [59]. Community stewardship and coordinated governance can further support compliance and conservation-related benefits, including education and local financing mechanisms [60].
This study demonstrates that Sumbreng Beach (SB) and Taman Kili-Kili Beach (TKB) provide broadly suitable biophysical conditions for Olive Ridley nesting, particularly because of their high sand fractions and gentle beach slopes, resulting in overall S1 habitat suitability classifications. However, beach width was consistently classified as S3 under the adopted threshold, indicating that a high overall HSI can coexist with an unfavorable score for a single threshold-based attribute. Field observations further indicate that night-time disturbance, particularly artificial light spill, human presence, and marine debris, may constrain the functional nesting space, with these pressures observed more prominently at SB than at TKB. The proposed dark-corridor framework therefore provides an operational approach for translating HSI results into measurable, corridor-focused management measures without requiring geomorphic modification.
This work is limited by its two-site scope, snapshot field measurements (December 2022), limited within-site replication, and a short landing record (2020–2022) derived from local monitoring logs that may vary in reporting completeness and patrol effort. Future work should extend seasonal sampling, standardize and quantify night-time disturbance and landing monitoring, and evaluate the effectiveness of lighting and access controls using before–after or comparative designs.
[1] Jemarut, W., Webliana, B.K., Sari, D.P. (2021). Kajian yuridis perlindungan penyu. Jurnal Ilmiah Dunia Hukum, 6(1): 1-10. https://doi.org/10.35973/jidh.v6i1.2613
[2] Cáceres-Farias, L., Reséndiz, E., Espinoza, J., Fernández-Sanz, H., Alfaro-Núñez, A. (2022). Threats and vulnerabilities for the globally distributed olive ridley (Lepidochelys olivacea) sea turtle: A historical and current status evaluation. Animals, 12(14): 1837. https://doi.org/10.3390/ani12141837
[3] Isdianto, A., Luthfi, O.M., Asadi, M.A., et al. (2022). Penyu: Biologi, habitat & ancaman. Malang, Indonesia: UB Media. https://www.researchgate.net/publication/373105470_Penyu_Biologi_Habitat_Ancaman.
[4] Coria-Monter, E., Durán-Campos, E. (2017). The relationship between the massive nesting of the olive ridley sea turtle (Lepidochelys olivacea) and the local physical environment at La Escobilla, Oaxaca, Mexico, during 2005. Hidrobiologica, 27(2): 201-209. https://doi.org/10.24275/uam/izt/dcbs/hidro/2017v27n2/Coria
[5] Robinson, N.J., Lazo-Wasem, E.A., Paladino, F.V., Zardus, J.D., Pinou, T. (2017). Assortative epibiosis of leatherback, olive ridley and green sea turtles in the eastern tropical Pacific. Journal of the Marine Biological Association of the United Kingdom, 97(6): 1233-1240. https://doi.org/10.1017/S0025315416000734
[6] Lei, J., Booth, D.T. (2017). Who are the important predators of sea turtle nests at wreck rock beach? PeerJ, 2017(6): e3515. https://doi.org/10.7717/peerj.3515
[7] Chattopadhyay, N.R., Chetia, A., Machahary, K.Q., Dupak, O. (2018). Assessment of conservation measures for olive ridley sea turtle (Lepidochelys olivacea) along Rushikulya Rookery, Ganjam Disrict, Odisha, India. International Journal of Marine Biology and Research, 3(1): 1-9. https://doi.org/10.15226/24754706/3/1/00121
[8] Arango, B.G., Ensminger, D.C., Moreno-Santillán, D.D., et al. (2022). Oxidative stress is a potential cost of synchronous nesting in olive ridley sea turtles. Antioxidants, 11(9): 1772. https://doi.org/10.3390/antiox11091772
[9] Afandy, Y.A., Yulianda, F., Agus, S.B., Liew, L.P. (2016). Habitat suitability and zoning analysis for green turtle Chelonia mydas in the marine conservation areas of Pangumbahan Turtle Park, Sukabumi. Jurnal Ilmu dan Teknologi Kelautan Tropis, 8(2): 539-552. https://doi.org/10.29244/jitkt.v8i2.15820
[10] Pratama, A.A., Romadhon, A. (2020). Characteristics of turtle enterprise habitat in Kili-Kili Park Beach, Trenggalek Regency and Hadiwarno Park Beach, Pacitan Regency. Juvenil: Jurnal Ilmiah Kelautan dan Perikanan, 1(2): 8-12. https://doi.org/10.21107/juvenil.v1i2.7574
[11] Parinding, Z., Basuni, S., Purnomo, H., Kosmaryandi, N., Wardiatno, Y. (2015). Nesting physical-characteristic of Chelonia mydas in Kaimana-West Papua. Jurnal Ilmu Pertanian Indonesia (JIPI), 20(1): 26-32.
[12] Pratama, V.D., Sukandar, Marjono, Kurniawan, A. (2021). Suitability analysis of habitat and ecotourism of olive ridley sea turtle (Lepidochelys olivacea) in development of turtle conservation strategy at Taman Kili-Kili Beach. ECSOFiM: Journal of Economic, Social, and Fisheries and Marine, 9(1): 86-100. https://doi.org/10.21776/ub.ecsofim.2021.009.01.07
[13] Zajac, Z., Stith, B., Bowling, A.C., Langtimm, C.A., Swain, E.D. (2015). Evaluation of habitat suitability index models by global sensitivity and uncertainty analyses: A case study for submerged aquatic vegetation. Ecology and Evolution, 5(13): 2503-2517. https://doi.org/10.1002/ece3.1520
[14] Nuitja, I.N.S. (1992). Biology and Ecology of Sea Turtle Conservation. Bogor, Indonesia: IPB Press.
[15] Nurbaeti, N., Yulianda, F., Fahrudin, A. (2016). Green turtle (Chelonia Mydas) conservation-based beach tourism management in Pangumbahan, Sukabumi Regency, West Java. Bogor Agricultural University (IPB). http://repository.ipb.ac.id/handle/123456789/82613.
[16] Yulianda, F. (2007). Marine ecotourism as an alternative to conservation-based resources utilization. Department of Waters and Resources Management Faculty of Fisheries and marine Sciences, Bogor Agricultural University, Bogor.
[17] Putra, A.P., Djunarsjah, E., Abidin, H.Z. (2023). Changes in the normal baseline due to changes in the Coast's dynamics and their effects on the sea boundary in Weh Island, Nanggroe Aceh Darussalam, Indonesia. Ocean & Coastal Management, 242: 106698. https://doi.org/10.1016/j.ocecoaman.2023.106698
[18] Rao, C., Pusapati, C., Muralidharan, M., Kale, N., Barnes, A., Shanker, K. (2023). Distribution patterns of nearshore aggregations of olive ridley sea turtles (Lepidochelys olivacea) in Rushikulya, Odisha, India: Implications for spatial management measures. Aquatic Conservation: Marine and Freshwater Ecosystems, 33(4): 379-388. https://doi.org/10.1002/aqc.3927
[19] Sabilillah, M.K., Bengen, D.G. and Sunuddin, A. (2014). Characteristics of olive ridley turtle (Lepidochelys olivacea, Hirth 1971) nesting habitat in Air Hitam Nature Tourism Park, Bengkulu. Institut Pertanian Bogor. http://repository.ipb.ac.id/handle/123456789/74418.
[20] Halls, J.N., Randall, A.L. (2018). Nesting patterns of loggerhead sea turtles (Caretta caretta): Development of a multiple regression model tested in North Carolina, USA. International Journal of Geo-Information, 7(9): 348. https://doi.org/10.3390/ijgi7090348
[21] Narayani, S., Venu, S., Silva, A.J.D. (2018). Comparison of beach profiles conducive for turtle nesting in Andaman. Journal of Threatened Taxa, 10(10): 12337-12343. https://doi.org/10.11609/jott.3373.10.10.12337-12343
[22] Waluyo, Sari, A.N., Rufaida, K.F. (2024). The impact shoreline modifications on lekang turtle (Lepidochelys olivacea) conservation along coastal of Kulonprogro, Indonesia. Jurnal Ilmu Dan Teknologi Kelautan Tropis, 16(1): 1-26. https://doi.org/10.29244/jitkt.v16i1.48399
[23] Parinding, Z. (2021). Preferensi habitat persarangan penyu di kawasan pulau kecil. CENDEKIA: Jurnal Ilmu Pengetahuan, 1(2): 8-14. https://doi.org/10.51878/cendekia.v1i2.114
[24] Samosir, S.H., Hernawati, T., Yudhana, A., Haditanojo, W. (2018). The difference between natural with semi-natural nest conduct the incubation period and hatching rate of lekang turtle’s egg (Lepidochelys olivacea) in Boom Seashore Banyuwangi. Jurnal Medik Veteriner, 1(2): 33-37. https://doi.org/10.20473/jmv.vol1.iss2.2018.33-37
[25] Wyneken, J., Lohmann, K.J., Musick, J.A. (2013). The Biology of Sea Turtles, Volume III. CRC Press.
[26] Gatto, C.R., Reina, R.D. (2020). Sea turtle hatchling locomotor performance: incubation moisture effects, ontogeny and species-specific patterns. Journal of Comparative Physiology B, 190(6): 779-793. https://doi.org/10.1007/s00360-020-01307-z
[27] U.S. Fish and Wildlife Service. (2019). Standard conditions for care and maintenance of captive sea turtles.
[28] Government of the Republic of Indonesia. (2021). Government Regulation of the Republic of Indonesia Number 22 of 2021 on the Implementation of Environmental Protection and Management. Indonesia. https://peraturan.bpk.go.id/Details/161852/pp-no-22-tahun-2021.
[29] Tomillo, P.S., Fonseca, L., Paladino, F.V., Spotila, J.R., Oro, D. (2017). Are thermal barriers 'higher' in deep sea turtle nests? PLoS ONE, 12(5): e0177256. https://doi.org/10.1371/journal.pone.0177256
[30] Idris, A.R., Putri, C., Adiwijaya, M.G., et al. (2020). Assessment of coral reefs health in Nature Recreation Park (TWA = Taman Wisata Alam) Sangiang Island, Banten. In The 3rd International Conference on Marine Science (ICMS) 2019 "Towards Sustainable Marine Resources and Environment", Bogor City, Indonesia, 429(1): 012020. https://doi.org/10.1088/1755-1315/429/1/012020
[31] Dujon, A.M., Schofield, G., Lester, R.E., Papafitsoros, K., Hays, G.C. (2018). Complex movement patterns by foraging loggerhead sea turtles outside the breeding season identified using Argos-linked Fastloc-Global Positioning System. Marine Ecology, 39: e12489. https://doi.org/10.1111/maec.12489
[32] Cardona, L., Campos, P., Velásquez-Vacca, A. (2020). Contribution of green turtles Chelonia mydas to total herbivore biomass in shallow tropical reefs of oceanic islands. PLoS ONE, 15(1): e0228548. https://doi.org/10.1371/journal.pone.0228548
[33] Hempson, T.N., Graham, N.A.J., Macneil, M.A., Williamson, D.H., Jones, G.P., Almany, G.R. (2017). Coral reef mesopredators switch prey, shortening food chains, in response to habitat degradation. Ecology and Evolution, 7: 2626-2635. https://doi.org/10.1002/ece3.2805
[34] Perry, C.T., Murphy, G.N., Graham, N.A.J., Wilson, S.K., Januchowski-Hartley, F.A., East, H.K. (2015). Remote coral reefs can sustain high growth potential and may match future sea-level trends. Scientific Reports, 5: 18289. https://doi.org/10.1038/srep18289
[35] Smyth, C.W., Sarmiento-Ramírez, J.M., Short, D.P.G., Diéguez-Uribeondo, J., O'Donnell, K., Geiser, D.M. (2019). Unraveling the ecology and epidemiology of an emerging fungal disease, sea turtle egg fusariosis (STEF). PLoS Pathog, 15(5): e1007682. https://doi.org/10.1371/journal.ppat.1007682
[36] Tomillo, P.S., Fonseca, L.G., Ward, M., et al. (2020).The impacts of extreme El Niño events on sea turtle nesting populations. Climate Change, 159: 163-176. https://doi.org/10.1007/s10584-020-02658-w
[37] Hintz, K.J., Hintz, C.J., Hester, E., Grossman, D. (2023). Radiometric calibration of consumer cameras for measuring coastal light pollution. In Proceedings of SPIE Volume 12543: Ocean Sensing and Monitoring XV, Article 125430G. SPIE. https://doi.org/10.1117/12.2661914
[38] Cheng, I.J., Cheng, W.H., Chan, Y.T. (2018). Geographically close, yet so different: contrasting long-term trends at two adjacent sea turtle nesting populations in Taiwan due to different anthropogenic effects. PLoS ONE, 13(7): e0200063. https://doi.org/10.1371/journal.pone.0200063
[39] Ohana, T., Arantes, L.S., Tikochinski, G., et al. (2025). Green turtle conservation in the genomic era-monitoring an endangered Mediterranean population and its breeding habits. Ecology and Evolution, 15(4): e71124. https://doi.org/10.1002/ece3.71124
[40] Ng, C.K.Y., Gu, H.X., Li, T.H., et al. (2018). Identifying habitat hot spots and migratory corridors of green turtles in the South China region. Aquatic Conservation: Marine and Freshwater Ecosystems, 28(5): 1181-1191. https://doi.org/10.1002/aqc.2923
[41] Biddiscombe, S.J., Smith, E.A., Hawkes, L.A. (2020). A global analysis of anthropogenic development of marine turtle nesting beaches. Remote Sense, 12(9): 1492. https://doi.org/10.3390/rs12091492
[42] Reséndiz, E., Lara-Uc, M.M. (2018). Health assessments in free-ranging sea turtles: Perspective of animal welfare in wildlife. In Animal Welfare, IntechOpen. https://doi.org/10.5772/intechopen.76111
[43] Maulana, F., Ulfah, M., Aulia, F., Murniadi, Alza, G., Rahmi, T., Kandi, O. (2024). Sea turtle landing and distribution in Aceh Jaya district. In the 5th International Conference on Fisheries, Aquatic, and Environmental Sciences (ICFAES 2023), EDP Sciences, p. 8. https://doi.org/10.1051/bioconf/20248703027
[44] Morais, M., Tiwari, M. (2022). Surveys of the Angolan coast uncover the largest olive ridley sea turtle nesting population in the Atlantic and the largest non-arribada population globally. Oryx-the International Journal of Conservation, 56(5): 789-797. https://doi.org/10.1017/s003060532100065x
[45] Faisho, M.L., Yogia, M.A., Prayuda, R., Khotami, Wahyudi, S. (2024). Evaluating conservation assistance programs in the Anambas Islands marine protected area using the CIPP model. International Journal of Sustainable Development and Planning, 19(4): 1529-1538. https://doi.org/10.18280/ijsdp.190429
[46] Rudianto, R., Darmawan, V., Isdianto, A., Bintoro, G. (2022). Restoration of coastal ecosystems as an approach to the integrated mangrove ecosystem management and mitigation and adaptation to climate changes in north coast of East Java. Journal of Coastal Conservation, 26(4): 37. https://doi.org/10.1007/s11852-022-00865-4
[47] Isdianto, A., Wibowo, R.A., Kudrati, A.V., et al. (2025). Impact of coral recruitment on ecosystem sustainability in Sempu Island Nature Reserve, Indonesia. Journal of Design & Nature and Ecodynamics, 20(1): 73-82. https://doi.org/10.18280/ijdne.200108
[48] Pratama, V.D., Dewi, C.S.U., Sukandar, et al. (2025). Sustainable marine tourism planning in South Malang: A feasibility and zoning approach for balanced development. International Journal of Sustainable Development and Planning, 20(4): 1515-1523. https://doi.org/10.18280/ijsdp.200414
[49] Murniasih, S., Hendarto, E., Hilmi, E. (2022). The mangrove density, diversity, and environmental factors as important variables to support the conservation program of essential ecosystem area in Muara Kali Ijo, Pantai Ayah, Kebumen. Jurnal Sylva Lestari, 10(3): 400-416. https://doi.org/10.23960/jsl.v10i3.596
[50] Isdianto, A., Musalima, F.P.A., Setyanto, A., et al. (2025). Sustainable management of coral reefs and marine tourism at Kondang Merak Beach Indonesia. International Journal of Sustainable Development and Planning, 20(7): 2741-2752. https://doi.org/10.18280/ijsdp.200701
[51] Zikargae, M.H., Woldearegay, A.G., Skjerdal, T. (2022). Assessing the roles of stakeholders in community projects on environmental security and livelihood of impoverished rural society: A nongovernmental organization implementation strategy in focus. Heliyon, 8(10): e10987. https://doi.org/10.1016/j.heliyon.2022.e10987
[52] Tu, C., Ma, H.Q., Li, Y., et al. (2022). Transdisciplinary, co-designed and adaptive management for the sustainable development of Rongcheng, a coastal city in China in the context of human activities and climate change. Frontiers in Environmental Science, 10: 670397. https://doi.org/10.3389/fenvs.2022.670397
[53] Duadji, N., Tresiana, N., Putri, A.M.L.S., Riniarti, M. (2022). Can the implementation of conservation village increase the environmental support in forest management in Bukit Barisan Selatan National Park, Lampung, Indonesia? International Journal of Sustainable Development and Planning, 17(3): 751-763. https://doi.org/10.18280/ijsdp.170306
[54] Bello, F.G., Lovelock, B., Carr, N. (2016). Enhancing community participation in tourism planning associated with protected areas in developing countries: Lessons from Malawi. Tourism and Hospitality Research, 18(3): 309-320. https://doi.org/10.1177/1467358416647763
[55] Kagungan, D., Hartoyo, H., Sutiyoso, B.U., Meutia, I.F. (2022). Millennials as cross-cutting interpreters on village's tourism development policy in Lampung Province. International Journal of Sustainable Development and Planning, 17(8): 2641-2648. https://doi.org/10.18280/ijsdp.170833
[56] Larson, L.R., Conway, A.L., Krafte, K.E., Hernandez, S.M., Carroll, J.P. (2016). Community-based conservation as a potential source of conflict around a protected area in Sierra Leone. Environmental Conservation, 43(3): 242-252. https://doi.org/10.1017/s0376892916000096
[57] Susana, I., Alvi, N.N., Persada, C. (2017). Realization of sustainable tourism through empowerment of local communities on Pahawang Island, Pesawaran, Lampung Province. TATA LOKA, 19(2): 117-128. https://doi.org/10.14710/tataloka.19.2.117-128
[58] Kaharuddin, K., Pudyatmoko, S., Fandeli, C., Martani, W. (2020). Local Communities participation in ecotourism development. Jurnal Ilmu Kehutanan, 14(1): 42-54. https://doi.org/10.22146/jik.57462
[59] Purwoko, A., Nurrochmat, D.R., Ekayani, M., Rijal, S., Garura, H.L. (2022). Examining the economic value of tourism and visitor preferences: A portrait of sustainability ecotourism in the Tangkahan Protection Area, Gunung Leuser National Park, North Sumatra, Indonesia. Sustainability, 14(8272). https://doi.org/10.3390/su14148272
[60] Zamzami, L., Aliman, M., Azwar. (2021). The effect of ecotourism development on marine conservation area in West Sumatera, Indonesia. GeoJournal of Tourism and Geosites, 38(4): 1166-1174. https://doi.org/10.30892/gtg.38423-757