Oral Colonization by Candida Species and Methicillin-Resistant Staphylococcus aureus in Patients with Malignant and Potentially Malignant Lesions

Yasameen H. Ali
© 2026 The author. This article is published by IIETA and is licensed under the CC BY 4.0 license (http://creativecommons.org/licenses/by/4.0/).
OPEN ACCESS
The present research investigated the prevalence of Candida spp. and methicillin-resistant Staphylococcus aureus (MRSA) co-colonization of the oral mucosa of cancer patients. A cross-sectional study was conducted among 105 cancer patients. Oral swabs were taken and cultured for the presence of Candida spp. and Staphylococcus aureus. The identification of Candida isolates was carried out employing RAPIDYeast Plus. Antimicrobial susceptibility testing and multiplex polymerase chain reaction (PCR) were used to characterize Staphylococcus aureus resistance and virulence genes. The prevalence of Candida spp. among the participants was 80.0% (84/105). Among the 84 Candida-positive participants, 105 Candida isolates were recovered because several patients exhibited mixed-species colonization. C. albicans/C. dubliniensis accounted for 66 isolates (62.9%), followed by the C. parapsilosis complex (26 isolates, 24.8%) and C. glabrata (13 isolates, 12.3%). Poor oral hygiene was observed in 80% of participants and was significantly associated with Candida colonization (p < 0.001). Of the 105 Staphylococcus aureus isolates obtained, 87.6% showed resistance to one or more antibiotics, while 53.3% exhibited multidrug resistance (MDR). The predominant resistance genes were blaZ (74.3%), mecA (42.9%), and mecC (18.1%), and the most common virulence gene was tsst (34.3%). The findings demonstrate a high burden of fungal colonization in immunocompromised patients and emphasize the necessity for improved diagnostic techniques and infection control measures in the oncology environment.
C. albicans, Staphylococcus aureus, multidrug-resistant Staphylococcus aureus, cancer patients, RAPIDYeast Plus, oral colonization
Candida spp. and Staphylococcus aureus have acquired new significance in clinical microbiology [1-3]. Both organisms, especially methicillin-resistant strains (methicillin-resistant Staphylococcus aureus, MRSA), have become critical pathogens in oral health because of their roles in biofilm-related infections and rising antimicrobial resistance (AMR) [4-6]. Candida is usually a normal organism in the mouth of healthy people, but it can be pathogenic in cases of immunosuppression, poor hygiene, or wearing of prostheses [7]. Equally, MRSA inhabits the nose, throat, and skin, presenting a significant risk of infection because of its multidrug resistance (MDR) and invasive capability [8]. Reports from Iraq [9] have recorded a 7.2% nasal MRSA colonization rate among ICU patients and an oxacillin resistance rate exceeding 34% among healthcare-associated infections. The synergistic relationship of C. albicans and Staphylococcus aureus has been observed in such circumstances as angular cheilitis, with both of them attached to the oral mucosa and intensifying the clinical signs [10]. The disease and treatment of cancer patients make them especially susceptible to mucosal damage and microbial dysbiosis because of weakened immunity. Although C. albicans is the most common, non-albicans Candida are becoming involved in antifungal-resistant infections, particularly among hospitalized people [11].
Approximately 800 microbial species can live in the oral cavity, and changes in the microbiota, particularly in malignant or potentially malignant lesions, can predispose to infections [12]. Despite this, few studies have identified Candida spp. or assessed their co-colonization with MRSA in oral cancer patients, especially prior to treatment. According to Talapko et al. [13], Candida was present in 70% of healthy people, and other researchers relate its pathogenicity to other factors, such as immunosuppression, smoking, and dietary practices. A review of the global literature published between 2018 and 2025 [14-18] indicates widespread AMR in Staphylococcus aureus, with high resistance rates reported for penicillin, erythromycin, clindamycin, and oxacillin. The mecA gene was frequently co-detected with virulence markers such as sea, hla, pvl, and tsst. Reported MDR rates ranged from 24% to 100%, highlighting the global burden of Staphylococcus aureus strains exhibiting both resistance and virulence.
This confirms the necessity of molecular surveillance, prudent antibiotic consumption, and quick diagnostics, such as multiplex polymerase chain reaction (PCR) [19, 20].
The present research fills a big gap by determining the Candida spp. and assessing their co-colonization with MRSA in patients with malignant and potentially malignant lesions of the mouth in Baghdad, Iraq, an underrepresented area in the literature. The findings will contribute to the understanding of the severity of the infection, trends of resistance, and implications of the infection on treatment strategies by concentrating on the fungal and bacterial colonization. The results are intended to aid in early diagnosis, inform antimicrobial stewardship, and enhance oral health outcomes among immunocompromised groups.
2.1 Study population
This was a cross-sectional descriptive observational study to evaluate the presence of oral cavity colonization by Candida spp. and the coexistence of co-colonization with Staphylococcus aureus strains, including MRSA, in cancer patients. The population of the investigation group was made up of 105 participants. These patients were treated in cancer centers that were registered at Baghdad Medical College from January 2023 to December 2023. Participants in the study were adults (>24 years) with a confirmed diagnosis of cancer who provided written informed consent and attended the participating oncology centers between January and December 2023. Eligible participants had completed their planned cancer treatment (surgery, chemotherapy, radiotherapy, or combined therapy) before oral sample collection and were enrolled during routine follow-up visits.
2.2 Sample collection for microbiological analysis
Sampling targeted both clinically evident lesions and adjacent oral mucosal surfaces. Sterile swabs were used to sample four intraoral locations, including the hard palate, buccal mucosa, dorsum of the tongue, and floor of the mouth, in a Z-pattern movement. Participants were instructed not to eat, drink, smoke, brush their teeth, or use mouthwash for at least 2 h before sample collection. Swabs were combined with 2 mL of sterile saline per patient and transported at 2–8 ℃ for laboratory analysis within 2 h of collection and processed immediately upon arrival.
To isolate Staphylococcus aureus, aliquots of the combined samples from swabs taken from the hard palate, buccal mucosa, dorsum of the tongue, and floor of the mouth were plated on blood agar and mannitol salt agar (MSA). The bacteria were allowed to grow for a period of time under standard growth conditions for bacteria, and those that resembled Staphylococcus aureus based on their appearance and biochemical characteristics were identified as such.
2.3 Determination of the colony-forming unit of Candida
To measure the colony-forming unit (CFU) of Candida, 500 µL of the combined sample was diluted in 4.5 mL of sterile saline. Serial dilutions (10⁻¹ to 10⁻³) were plated onto Sabouraud dextrose agar (40 g/L dextrose, 10 g/L peptone, and 15 g/L agar) supplemented with chloramphenicol, and the culture was incubated at 37 ℃ for 48 h. Typical colonies of Candida (opaque, creamy, white to beige, 0.5–20 mm) were counted, and the CFU was determined by the following formula [21]:
$C F U=$ number of colonies $\times$ dilution factor $\times 10$
2.4 Identification of Candida spp.
At least 10% of the Candida-like morphology colonies were stained with lactophenol blue and viewed under a microscope. Round-to-oval blastoconidia with budding were some of the diagnostic features used for characterization. Confirmed colonies were subcultured on 2% SDA at 37 ℃, and then the culture was incubated at 37 ℃ for 48 h.
2.5 Species-level characterization of Candida
The RAPIDYeast Plus system (Thermo Scientific) was then used to perform species-level identification, following the instructions of the manufacturer. Candida spp. identification was confirmed using the Electronic RapID Coded Compendium (ERIC) database criteria, including identification level (adequate), frequency (acceptable), bioscore (average 1/100), and probability values of 98% or higher. All results were recorded in duplicate to ensure reliability and reproducibility. Also, isolates carrying mecA and/or mecC genes were classified as MRSA regardless of cefoxitin susceptibility results. Cefoxitin resistance was additionally used as a phenotypic marker for methicillin resistance.
2.6 Characterization of Staphylococcus aureus colonization
Blood agar and MSA were used for the culture, and the plates were incubated at 37 ℃ for 24 h. The colonies were large, circular, creamy, opaque colonies with a white to golden-yellow color and characteristic β-hemolysis on blood agar. Production of yellow colonies on MSA with a yellow halo zone around the colonies confirmed positive fermentation of mannitol. To identify Staphylococcus aureus, a coagulase test was conducted. The colonies from MSA were transferred to brain heart infusion (BHI) broth and allowed to grow at 37 ℃ for 24 h. Citrated plasma (0.5 mL) was added to the culture and incubated. The culture was monitored for clotting at 2 h, 4 h, and 18 h. Colonies on nutrient agar were suspended in sterile physiological saline, and the turbidity was adjusted to the 0.5 McFarland standard (1.5 × 10⁸ CFU/mL) with a nephelometer.
2.7 Antimicrobial susceptibility testing
The disk diffusion test was used to determine the susceptibility of Staphylococcus aureus isolates on Mueller-Hinton agar following the Clinical and Laboratory Standards Institute (CLSI) guidelines. The bacterial suspension was spread, then antibiotic discs were placed in three directions, with erythromycin and clindamycin discs spaced by 16–24 mm. Plates were incubated at 35 ℃ for 16–18 h, and the interpretation of inhibition zones was done according to the CLSI standards (Table 1).
Table 1. List of the antimicrobials used and susceptibility criteria
|
Antimicrobial Agent |
Disk Conc. |
S |
SDD (mm) |
I (mm) |
R (mm) |
|
Penicillin (PEN) |
10 units |
≥30 mm |
— |
— |
≤29 |
|
Cefoxitin (FOX) |
30 µg |
≥23 mm |
— |
— |
≤22 |
|
Oxacillin (OXA) |
1 µg |
≥12 mm |
— |
— |
≤11 |
|
Ceftaroline (CPT) |
30 µg |
≥26 mm |
21–25 |
— |
≤20 |
|
Clindamycin (CLI) |
2 µg |
≥22 mm |
— |
16–21 |
≤15 |
|
Erythromycin (ERY) |
15 µg |
≥24 mm |
— |
15–23 |
≤14 |
|
Gentamicin (GEN) |
10 µg |
≥16 mm |
— |
14–15 |
≤13 |
|
Tetracycline (TET) |
30 µg |
≥20 mm |
— |
16–19 |
≤15 |
|
Levofloxacin (LEV) |
5 µg |
≥20 mm |
— |
17–19 |
≤16 |
|
Nitrofurantoin (NIT) |
300 µg |
≥18 mm |
— |
16–17 |
≤15 |
|
Trimethoprim-Sulfamethoxazole (SXT) |
1.25/23.75 µg |
≥17 mm |
— |
12–16 |
≤11 |
|
Linezolid (LZD) |
30 µg |
≥27 mm |
— |
24–26 |
≤23 |
|
Chloramphenicol (CHL) |
30 µg |
≥19 mm |
— |
14–18 |
≤13 |
|
Rifampicin (RIF) |
5 µg |
≥21 mm |
— |
18–20 |
≤17 |
|
Vancomycin (VAN) |
30 µg |
H.P. (per E-test) |
— |
— |
H.A. (per E-test) |
2.8 Determination of β-lactamase production
A penicillin G disc was used to evaluate the production of β-lactamase according to the CLSI guidelines. Isolates with no inhibition zone or with a sharp-edged halo were categorized as β-lactamase producers. In contrast, those with a diffuse, “beach-shaped” halo were considered negative for β-lactamase production [22].
2.9 Detection of inducible clindamycin resistance in Staphylococcus aureus
Inducible clindamycin resistance was detected by placing erythromycin and clindamycin discs 16–24 mm apart (center-to-center) on Mueller-Hinton agar and incubating the culture for 16–18 h. Isolates exhibiting a flattened, D-shaped zone of inhibition adjacent to the erythromycin disc around the clindamycin disc were classified as having inducible clindamycin resistance [22].
2.10 DNA extraction by heat shock
The heat shock technique was used to extract genomic DNA. Nutrient agar was used to culture Staphylococcus aureus over a period of 20 h. About 3–6 colonies were vortexed in 150 μL of molecular-grade water in a 1.5 mL Eppendorf tube. Heat shock was then applied to the suspension by boiling it in boiling water for 10 minutes and then freezing at -20 ℃ for 10 minutes to lyse the bacterial cells. Samples were centrifuged at 10,000 rpm for 5 minutes at room temperature. A 50 µL aliquot of DNA extract was retained as stock DNA, from which 0.7 µL was used as template in each PCR reaction [23].
2.11 Evaluation of DNA quality
Purity and concentration of the extracted DNA were measured on a Thermo Scientific NanoDrop Lite spectrophotometer. One microliter of molecular-grade water was first used to blank the instrument. Subsequently, 1 µL of each vortexed DNA sample was loaded onto the pedestal, and measurements were initiated using the “Measure” function. Absorbance was read at 260 nm and 280 nm, and the concentration of the DNA was calculated in ng/μL. A sample absorbance ratio between 260 and 280 with a ratio near 1.8 was regarded as being of acceptable purity [24].
2.12 Multiplex polymerase chain reaction
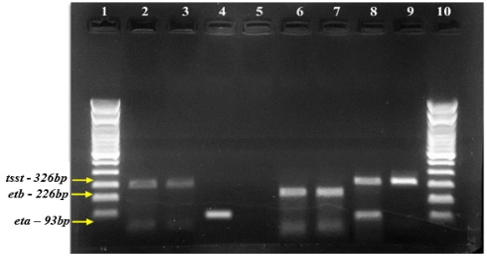
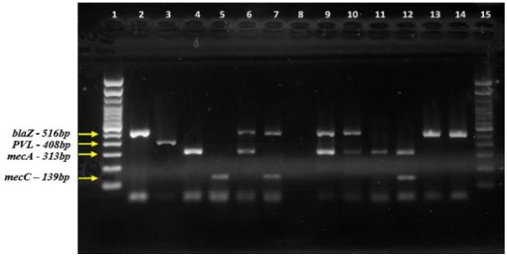
There were two multiplex PCR assays that were designed to amplify staphylococcal virulence and antimicrobial-resistance genes. Multiplex Set A focused on resistance genes (mecA, mecC, and blaZ) and the pvl virulence gene. Multiplex Set B was dedicated to virulence genes (eta, etb, and tsst). Table 2 depicts the hybridization temperatures and anticipated amplicon lengths. The KOD Hot Star DNA Polymerase kit (Novagen, Toyobo, Merck Millipore) was used to perform the PCR according to the manufacturer’s instructions. The PCR mixture contained the following: 2.5 μL of 10× Buffer, 2.5 μL of dNTPs, 0.5 μL of KOD polymerase, 1.5 μL of 25 μM MgSO4, and 0.4 μL of forward and reverse primers (10 mM) for each gene in multiplex Set A. In multiplex Set B, 0.3 μL of etb and tsst and 0.5 μL of eta were used. Finally, 0.7 μL of DNA template and molecular-grade water were added to arrive at a final reaction volume of 25 μL [24, 25].
Table 2. Attributes of the primers employed for the multiplex polymerase chain reaction (PCR) amplification [26]
|
Target Gene |
Primer Sequence (5’→3’) |
Amplicon Size (bp) |
Annealing Temperature (℃) |
Multiplex PCR Set |
|
mecA |
F: TCCAGATTACAACTTCACCAGG |
195 |
58 |
A |
|
mecC |
F: CGTTATGGTTCTGGAAGCAC |
265 |
56 |
A |
|
blaZ |
F: AACGACATTCCTTCATCGC |
362 |
60 |
A |
|
pvl |
F: CGAAGCAGGTGTTGCTTACA |
178 |
59 |
A |
|
eta |
F: AGTCAATGGTGCTGATGATGG |
145 |
61 |
B |
|
etb |
F: ACGGTCAACTTGGGAAACAA |
210 |
60 |
B |
|
tsst |
F: GGCTACAGGAGGTTTGTGGA |
298 |
59 |
B |
2.13 Agarose gel electrophoresis
Agarose gels (2% for PCR Set A, 1.5% for Set B) were prepared by dissolving 0.8 g or 0.6 g of agarose in 40 mL of 0.5× TBE buffer, respectively. To stain DNA, SYBR Safe (0.4 μL) was added, and the molten agarose solution was poured into a tray. The gel was placed in a horizontal electrophoresis unit (EasyCast™, Thermo Scientific) filled with 0.5× TBE, and the combs were removed. A 100 bp DNA ladder (10 μL) was loaded into one lane. PCR products (5 μL) were loaded into different wells with 1 μL of loading buffer (BlueJuice™, Thermo Fisher™). Electrophoresis was performed at 100 V in Set A and 90 V in Set B, and a Bio-Rad PowerPac was used; the duration of the electrophoresis was 30 and 40 minutes, respectively. Bands were visualized with a UV transilluminator [27].
2.14 Statistical analysis
Data were statistically analyzed employing Microsoft Excel (2019) and Statistical Package for the Social Sciences (SPSS; version 25). Univariate analysis was utilized to characterize the research population and important outcome variables. Frequencies and percentages were employed to summarize qualitative variables (age group, socioeconomic status, marital status, sample type, hospital service, and the presence of genes). In the case of quantitative variables, the measures of central tendency (mean and median) and dispersion (standard deviation or interquartile range, as needed) were determined. Associations between categorical variables (e.g., presence of resistance or virulence genes and clinical or demographic factors) were evaluated using the Chi-square test or Fisher’s exact test, depending on expected cell counts. Statistical significance was set at a 99% confidence level (p ≤ 0.01). Where significant, Cramer's V was employed to assess association strength: C = 0.0–0.1 (none), 0.1–0.3 (low), 0.3–0.5 (moderate), 0.5–1.0 (strong). In cases where significant associations were found, the strength of association was determined using Cramer's V coefficient [28]. Tables and graphs were used to present the descriptive statistics.
3.1 Sociodemographic characteristics of the study groups
This investigation included a total of 105 participants aged between 24 and 84 years. The mean age was 45.2 years for males and 42.6 years for females, and details of sociodemographic characteristics are given in Table 3.
Table 3. The sociodemographic characteristics of the study participants (n = 105)
|
Characteristic |
Category |
Frequency (n) |
Percentage (%) |
|
Gender |
Male |
80 |
76.2% |
|
Female |
25 |
23.8% |
|
|
Average Age |
Male |
— |
45.2 years |
|
Female |
— |
42.6 years |
|
|
Place of Origin |
Baghdad |
74 |
70.5% |
|
Mosul |
11 |
10.5% |
|
|
Basra |
20 |
19.0% |
|
|
Occupation |
Housewife |
21 |
20.0% |
|
Technical |
14 |
13.3% |
|
|
Teacher |
10 |
9.5% |
|
|
Consultant |
10 |
9.5% |
|
|
Salesperson |
9 |
8.6% |
|
|
Misc. Services |
12 |
11.4% |
|
|
Employee |
13 |
12.4% |
|
|
Ornamentation |
16 |
15.2% |
|
|
Educational Level |
Primary |
12 |
11.4% |
|
Secondary |
31 |
29.5% |
|
|
Technical |
28 |
26.7% |
|
|
Technology |
10 |
9.5% |
|
|
Professional |
24 |
22.9% |
|
|
Socioeconomic Stratum |
Stratum 1 |
17 |
16.2% |
|
Stratum 2 |
40 |
38.1% |
|
|
Stratum 3 |
34 |
32.4% |
|
|
Stratum 4 |
14 |
13.3% |
3.2 Clinical characteristics of the study group
Table 4 summarizes the clinical characteristics of the study population. Nearly half of the participants (49.5%) had been diagnosed with cancer more than one year before enrolment, and all participants had completed their planned cancer treatment before oral sample collection. Participants were recruited during routine follow-up visits at the participating oncology centers between January and December 2023. Additionally, 50.5% had a concomitant systemic disease, and 60.0% were receiving medication for these conditions.
Table 4. Clinical characteristics of the study population (n = 105)
|
Characteristic |
Category |
Frequency (n) |
Percentage (%) |
|
Time Since Diagnosis |
Less than six months |
42 |
40.0 |
|
Less than one year |
11 |
10.5 |
|
|
More than one year |
52 |
49.5 |
|
|
Type of Cancer |
Head and neck region |
42 |
40.0 |
|
Breast cancer |
21 |
20.0 |
|
|
Leukemia |
11 |
10.5 |
|
|
Colon |
11 |
10.5 |
|
|
Stomach |
11 |
10.5 |
|
|
Ovarian |
11 |
10.5 |
|
|
Presence of Systemic Disease |
Yes |
53 |
50.5 |
|
No |
52 |
49.5 |
|
|
Type of Systemic Disease |
Heart disease |
11 |
10.5 |
|
High blood pressure |
32 |
30.5 |
|
|
Diabetes |
11 |
10.5 |
|
|
Does not report |
51 |
48.5 |
|
|
Medication Use |
Yes |
63 |
60.0 |
|
No |
42 |
40.0 |
3.3 Oral health characteristics and Candida colonization profile of study participants
Ninety percent (90%) of the participants reported having a dental history; all patients reported brushing with toothpaste, and 70% did so three times a day. Sixty percent (60%) did not use mouthwash, and 50% did not floss. The results also showed that 60% of participants did not wear dentures, and the remaining 40% cleaned their dentures daily. All participants reported mild bacterial plaque, with 80% of this containing calculus. The clinical dental examination revealed coral-pink mucosa without alterations, a healthy tongue with a pale red color, a smooth appearance without cracks, moist, and tender to palpation. Regarding Candida colonization in the oral cavity of the participants, Candida was isolated from 84 of the oral mucosa samples, for a colonization frequency of 80% for this yeast. Among the 84 Candida-positive patients, several exhibited mixed oral colonization, with two or more Candida spp. recovered from the same oral sample. Therefore, although 84 patients were positive for Candida, a total of 105 Candida isolates were identified. Species frequencies presented in Table 5a and Table 5b are based on the total number of isolates rather than the number of patients. The colonization level measured by CFU using the Shapiro-Wilk test [29] was determined to be non-normally distributed (p < 0.05). Counts ranged from 1 to 1,800 CFU, with a median of 100 CFU. Table 5 presents the levels of Candida colonization in the oral mucosa samples. Five of the 84 samples had Candida counts ranging from 1 to 200 CFU, while one sample had counts greater than 1,000 CFU.
Table 5 presents the distribution of Candida spp. isolated from oral mucosa samples of the 84 Candida-positive patients. A total of 105 Candida isolates were recovered because several patients exhibited mixed-species colonization. Among these isolates, C. albicans/C. dubliniensis was the predominant species (66/105, 62.9%), followed by the C. parapsilosis complex (26/105, 24.8%) and C. glabrata (13/105, 12.3%). The mean age of patients harboring C. albicans/C. dubliniensis was 53.7 years. This species was recovered predominantly from male participants, accounting for 58 of the 66 isolates (87.9%), whereas female participants accounted for 8 isolates (12.1%). The average CFU counts were 117.5 for C. albicans/C. dubliniensis, 200 for the C. parapsilosis complex, and 1800 for C. glabrata. Based on the CFU counts obtained from oral mucosal samples, 42 of the 84 Candida-positive patients (50.0%) had Candida counts ranging from 1 to 200 CFUs, while 17 patients (20.2%) had counts between 201 and 400 CFUs, 24 patients (28.6%) had counts between 401 and 1000 CFUs, and 1 (1.2%) had a count greater than 1000 CFUs. The research determined that C. albicans/C. dubliniensis was present in most cancer types, with Candida being the most common type among the participants. However, we observed that there was no increased incidence of any type of Candida spp. relative to the type of cancer presented by the participants.
Table 5a. Distribution of Candida isolates
|
Candida spp. Identified |
Number of Isolates (n) |
Percentage of Isolates (%) |
Male (n) |
Female (n) |
|
C. albicans/C. dubliniensis |
66 |
62.9 |
58 |
8 |
|
C. parapsilosis complex |
26 |
24.8 |
15 |
11 |
|
C. glabrata |
13 |
12.3 |
7 |
6 |
|
Total |
105 |
100.0 |
80 |
25 |
Table 5b. Patient characteristics and oral Candida colonization parameters
|
Candida spp. |
Average Age (years) |
Average CFU Count |
1–200 CFU, n (%) |
201–400 CFU, n (%) |
401–1000 CFU, n (%) |
>1000 CFU, n (%) |
|
C. albicans/C. dubliniensis |
53.7 |
117.5 |
36 (54.5) |
12 (18.2) |
15 (22.7) |
3 (4.6) |
|
C. parapsilosis complex |
48.5 |
200 |
10 (38.5) |
7 (26.9) |
7 (26.9) |
2 (7.7) |
|
C. glabrata |
55.0 |
1800 |
1 (7.7) |
1 (7.7) |
2 (15.4) |
9 (69.2) |
|
Overall |
52.1 |
— |
42 (50.0) |
17 (20.2) |
24 (28.6) |
1 (1.2) |
3.4 Antimicrobial susceptibility against Staphylococcus aureus isolates
Regarding the antimicrobial response of the 105 isolates, using the disc diffusion method, it was observed that 88.6% presented resistance to at least one antimicrobial and 11.4% showed susceptibility to all antimicrobials. Among the highest resistance frequencies found, 81.0% showed resistance to penicillin, 59.1% to oxacillin, 51.5% to cefoxitin, and 46.7% to erythromycin. Resistance frequencies below 50% to other antimicrobials can be seen in Table 6.
Table 6. Antimicrobial susceptibility of Staphylococcus aureus isolates evaluated using the disk diffusion method
|
Antimicrobial |
Resistant, n (%) |
Sensitive, n (%) |
Intermediate, n (%) |
SDD, n (%) |
|
PEN |
85 (81.0) |
20 (19.0) |
N/A |
N/A |
|
OXA |
62 (59.0) |
43 (41.0) |
N/A |
N/A |
|
FOX |
54 (51.4) |
51 (48.6) |
N/A |
N/A |
|
ERY |
49 (46.7) |
40 (38.1) |
16 (15.2) |
N/A |
|
CLI |
37 (35.2) |
61 (58.1) |
7 (6.7) |
N/A |
|
GEN |
37 (35.2) |
63 (60.0) |
5 (4.8) |
N/A |
|
LEV |
32 (30.5) |
70 (66.7) |
3 (2.9) |
N/A |
|
LZD |
17 (16.2) |
72 (68.6) |
16 (15.2) |
N/A |
|
TET |
14 (13.3) |
90 (85.7) |
1 (1.0) |
N/A |
|
RIF |
12 (11.4) |
92 (87.6) |
1 (1.0) |
N/A |
|
SXT |
11 (10.5) |
93 (88.6) |
1 (1.0) |
N/A |
|
VAN |
9 (8.6) |
96 (91.4) |
N/A |
N/A |
|
CPT |
10 (9.5) |
83 (79.0) |
N/A |
12 (11.4) |
|
CHL |
8 (7.6) |
96 (91.4) |
1 (1.0) |
N/A |
|
NIT |
3 (2.9) |
100 (95.2) |
2 (1.9) |
N/A |
3.5 Evaluation of beta-lactamase production using the penicillin disc
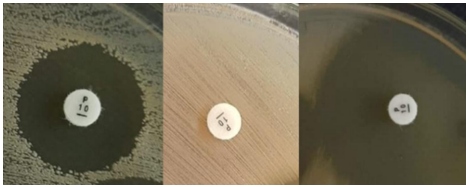
Analysing the response of isolates to the penicillin disc as an indicator of β-lactamase production, 84 isolates (80.0%) were identified as enzyme producers. Among these, 57 isolates (67.9%) exhibited a cliff-shaped inhibition halo (Pattern A), while 27 isolates (32.1%) showed no visible halo (Pattern B). The remaining 21 isolates (20.0%), classified as non–β-lactamase producers, displayed a beach-shaped inhibition halo (Pattern C) (Figure 1).
Figure 1. Screening for β-lactamase production using a penicillin diffusion disc. (a) β-lactamase-producing isolate, cliff-shaped halo edge of the penicillin disc, (b) β-lactamase-producing isolate, absence of a penicillin disc halo, (c) negative isolate for β-lactamase production, beach-shaped halo border
3.6 Detection of erythromycin-induced clindamycin resistance
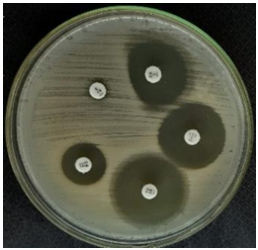
Evaluating the D-test, 11 isolates (10.5%) showed a flattening of the clindamycin inhibition zone just adjacent to the erythromycin disk, forming a D-shaped halo (Figure 2). Of these 11 isolates, 63.6% were present in MRSA isolates and only 36.4% in MSSA isolates.
Figure 2. Detection of erythromycin-induced clindamycin resistance (D-positive test, D-shaped halo)
3.7 Resistance profiles of Staphylococcus aureus isolates
Forty-two different resistance profiles were found, of which IQ15 (multiple resistance to PEN-FOX-OXA-CLI-ERY-GEN-LEV) was most frequently present with 13 isolates (12.4%), followed by IQ42 with 12 isolates (11.4%), IQ40 (PEN-ERY) with 7 isolates (6.7%), and IQ22 (PEN-FOX-OXA-ERY-LZD) with 5 isolates (4.8%), among other profiles whose frequencies are shown in Table 7. Furthermore, of the total isolates, 56 (53.3%) were MDR, 21 (20.0%) were resistant to only two groups of antimicrobials, and 15 (14.3%) were resistant to only one group of antimicrobials. In contrast, 13 isolates (12.4%) were fully susceptible to all tested antimicrobials.
Table 7. Antimicrobial resistance (AMR) profiles of Staphylococcus aureus isolates
|
Resistance Profile Code |
Modified Resistance Profile |
Frequency (n) |
Percentage (%) |
|
IQ1* |
PEN-CPT-OXA-CPT-CLI-ERY-GEN-TET-LEV-NIT-SXT-LZD-CHL-RIF-VAN |
1 |
0.95 |
|
IQ2* |
PEN-FOX-OXA-CPT-CLI-ERY-GEN-TET-LEV-SXT-LZD-MOX-RIF |
2 |
1.90 |
|
IQ3* |
PEN-OXA-CPT-CLI-ERY-TET-LEV-SXT-LZD-RIF |
1 |
0.95 |
|
IQ4* |
PEN-FOX-OXA-CPT-CLI-ERY-GEN-TET-LZD-RIF |
2 |
1.90 |
|
IQ5* |
PEN-CLI-ERY-GEN-TET-LEV-SXT-LZD-RIF-FEP |
1 |
0.95 |
|
IQ6* |
PEN-FOX-CPT-CPT-CLI-ERY-GEN-LEV-SXT-CHL |
1 |
0.95 |
|
IQ7* |
PEN-FOX-OXA-CLI-GEN-TET-LEV-CHL-RIF-VAN |
1 |
0.95 |
|
IQ8* |
PEN-FOX-OXA-CPT-CLI-ERY-GEN-LEV-RIF |
3 |
2.86 |
|
IQ9* |
PEN-FOX-OXA-CPT-CLI-ERY-GEN-LEV-SXT |
2 |
1.90 |
|
IQ10* |
PEN-FOX-CPT-CLI-ERY-GEN-TET-LZD-RIF |
1 |
0.95 |
|
IQ11* |
PEN-FOX-OXA-CLI-ERY-GEN-AMX-RIF-VAN |
1 |
0.95 |
|
IQ12* |
PEN-FOX-OXA-CLI-NIT-LZD-RIF-VAN |
1 |
0.95 |
|
IQ13* |
PEN-FOX-OXA-CPT-CLI-ERY-GEN-LEV |
4 |
3.81 |
|
IQ14* |
PEN-OXA-CPT-CLI-ERY-GEN-LZD-RIF |
1 |
0.95 |
|
IQ15* |
PEN-FOX-OXA-CLI-ERY-GEN-LEV |
13 |
12.38 |
|
IQ16* |
PEN-CLI-GEN-TET-LEV-LZD |
1 |
0.95 |
|
IQ17* |
PEN-FOX-OXA-CLI-ERY-LZD |
1 |
0.95 |
|
IQ18* |
PEN-FOX-CLI-ERY-GEN-LEV-CHL |
1 |
0.95 |
|
IQ19* |
PEN-FOX-OXA-ERY-GEN-LEV |
1 |
0.95 |
|
IQ20* |
PEN-FOX-OXA-CPT-RIF |
1 |
0.95 |
|
IQ21* |
PEN-CPT-OXA-SXT-LZD |
1 |
0.95 |
|
IQ22* |
PEN-FOX-OXA-ERY-LZD |
5 |
4.76 |
|
IQ23* |
FOX-OXA-TET-CHL |
1 |
0.95 |
|
IQ24* |
PEN-CPT-OXA-CLI-ERY |
1 |
0.95 |
|
IQ25* |
PEN-FOX-ERY-LZD-NAL |
1 |
0.95 |
|
IQ26 |
PEN-FOX-OXA-LZD |
2 |
1.90 |
|
IQ27* |
PEN-OXA-CLI-ERY-GEN |
2 |
1.90 |
|
IQ28 |
PEN-FOX-RIF-GEN |
1 |
0.95 |
|
IQ29* |
PEN-CPT-ERY-TET-NIT |
1 |
0.95 |
|
IQ30* |
LEV-LZD-CRO |
1 |
0.95 |
|
IQ31 |
FOX-OXA-LZD |
1 |
0.95 |
|
IQ32* |
PEN-ERY-LZD-AZM |
1 |
0.95 |
|
IQ33 |
PEN-FOX-OXA-ERY |
4 |
3.81 |
|
IQ34* |
OXA-ERY-MFX |
1 |
0.95 |
|
IQ35 |
PEN-OXA-FEP |
1 |
0.95 |
|
IQ36* |
PEN-GEN-TET |
1 |
0.95 |
|
IQ37 |
PEN-OXA-ERY |
2 |
1.90 |
|
IQ38 |
PEN-LZD |
2 |
1.90 |
|
IQ39 |
CLI-ERY |
1 |
0.95 |
|
IQ40 |
PEN-ERY |
7 |
6.67 |
|
IQ41 |
OXA |
3 |
2.86 |
|
IQ42 |
PEN |
12 |
11.43 |
3.8 Virulence and resistance genes in Staphylococcus aureus isolates
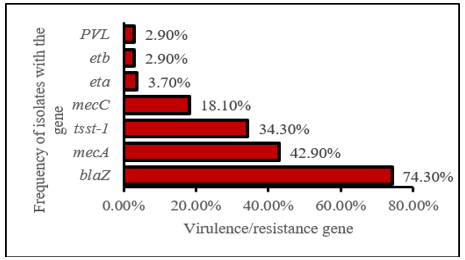
Regarding the frequency of isolates presenting virulence and resistance genes, multiplex PCRs (Figures 3 and 4) revealed that 78 isolates (74.3%) presented the blaZ gene, followed by 45 isolates (42.9%) with the mecA gene, 36 (34.3%) with the tsst gene, and 19 (18.1%) with the mecC gene. The other genes were less frequent among the remaining isolates, as shown in Figure 5.
Figure 5. Frequency of Staphylococcus aureus isolates according to the virulence and resistance genes evaluated in this study
3.9 Genetic profiles of Staphylococcus aureus isolates
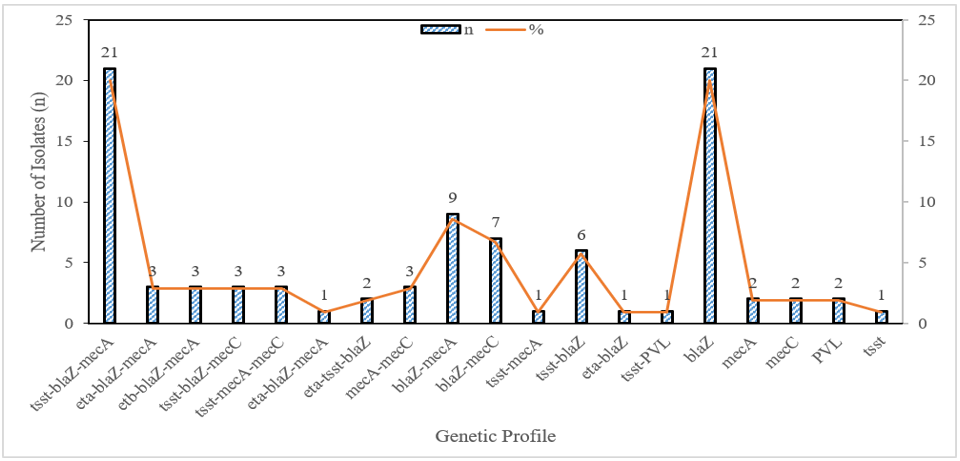
Of the 105 isolates, 92 presented at least one of the genes evaluated (87.6%). Evaluating the frequency of genetic profiles, 19 distinct profiles were found, among which profiles containing the blaZ gene (coding for penicillinase) were the most frequent. The profile containing only the blaZ gene and the profile containing the tsst-blaZ-mecA genes (20.0% for both profiles) stood out with 21 isolates. Following these two, the profile in which 9 isolates presented the blaZ-mecA genes (8.6%) and 7 isolates contained the blaZ-mecC genes (6.7%). The remaining genetic profiles are shown in Figure 6.
3.10 Frequency of Multidrug-resistant Staphylococcus aureus isolates
Of the 105 isolates, 59 (56.2%) were classified as MRSA based on the presence of the mecA and mecC genes and resistance to cefoxitin (Table 8). Among the MRSA isolates, 44 (74.6%) were positive for the mecA gene, 18 (30.5%) were positive for the mecC gene, and 52 (88.1%) were resistant to cefoxitin. It was also observed that among the isolates that had the mecA and mecC genes and those that were cefoxitin-resistant, the coexistence of all three traits was found in 6 isolates (5.7%). Among the 52 cefoxitin-resistant isolates, 42 (80.8%) were positive for the mecA gene, whereas 16 (30.8%) were positive for the mecC gene. In addition, three isolates (2.9%) had both mecA and mecC genes present. Likewise, three isolates (2.9%) were found to be carrying only the mecA gene, and three (2.9%) were carrying only the mecC gene. Furthermore, all of the isolates that were resistant to cefoxitin had at least one of the mec genes.
Table 8. Source characteristics associated with MRSA and MSSA isolates
|
Variable |
Characteristic |
MRSA (n = 59) |
% |
MSSA (n = 46) |
% |
Cramer's V |
p-Value |
|
Gender |
Male |
45 |
76.3 |
35 |
76.1 |
0.003 |
0.287 |
|
Female |
14 |
23.7 |
11 |
23.9 |
|||
|
Hospital Department |
Outpatient |
23 |
39.0 |
31 |
67.4 |
0.009 |
0.298 |
|
Inpatient |
21 |
35.6 |
7 |
15.2 |
|||
|
Emergency |
15 |
25.4 |
8 |
17.4 |
|||
|
Cefoxitin (FOX) Susceptibility |
Resistant |
52 |
88.1 |
0 |
0.0 |
0.891 |
< 0.001 |
|
Sensitive |
7 |
11.9 |
46 |
100.0 |
|||
|
mecA Gene |
Positive |
44 |
74.6 |
0 |
0.0 |
0.750 |
< 0.001 |
|
Negative |
15 |
25.4 |
46 |
100.0 |
|||
|
mecC Gene |
Positive |
18 |
30.5 |
0 |
0.0 |
0.402 |
< 0.001 |
|
Negative |
41 |
69.5 |
46 |
100.0 |
3.11 Characteristics associated with the presence of Multidrug-resistant Staphylococcus aureus isolates
The association between MRSA status and gender (p = 0.287) or hospital department (p = 0.298) was not statistically significant. According to Cramer's V, both variables showed negligible associations (gender, C = 0.003; hospital department, C = 0.009). In contrast, cefoxitin (FOX) resistance showed a highly significant association with MRSA (p < 0.001) and a strong association according to Cramer's V (C = 0.891). No statistically significant associations were observed for the mecA (p = 0.765) or mecC (p = 0.415) genes, as reported in Table 8.
3.12 Isolates with virulence-resistance genes by sample type
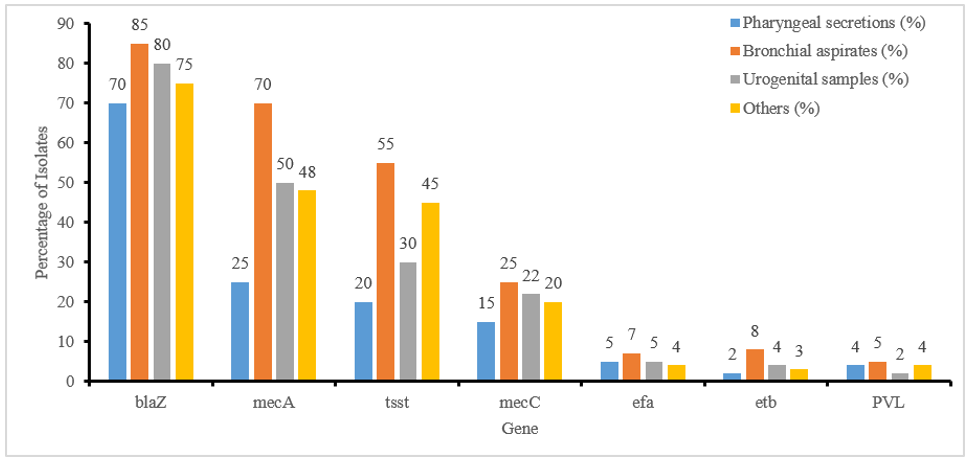
Isolates harbouring the blaZ gene were the most frequently detected across all clinical sample types. Notably, at least one isolate from pharyngeal secretions or bronchial aspirates contained one of the evaluated genes. In contrast, no isolates from urogenital samples or other sample types carried the etb or pvl genes. Among the bronchial aspirate isolates, the most prevalent genes were blaZ (85%), mecA (70%), tsst (55%), and etb (8%). Conversely, isolates from pharyngeal secretions showed a lower frequency of blaZ, mecA, tsst, mecC, eta, and etb genes (Figure 7).
The present research examined the occurrence of Candida spp. within the oral mucosa of cancer patients and their contribution to oral infections. The research involved 10 patients (aged 24 to 84). The findings showed that there was a high prevalence of C. albicans and C. dubliniensis that were isolated in 63% of the cases. The findings are consistent with earlier research, including that by Whibley et al. [31], who also observed a C. albicans prevalence. C. albicans is the most commonly isolated species, although non-albicans species have increased. It was found that poor oral hygiene was a contributing factor. Mathur et al. [32] concluded that poor dental hygiene or lack of dental care was identified in more than 42% of the study participants with cancer, which directly correlates with Candida infections. C. albicans was also identified in over half of their cases by Sabino et al. [33], which supports the significance of a timely diagnosis and a coordinated medical response to help avoid complications.
Candida infections have also grown, particularly in immunocompromised people, such as those with hematological diseases. C. glabrata was isolated in the present research in a 55-year-old patient with leukemia. This complements a report by Hassan et al. [34], which indicated increased colonization of C. glabrata in patients with low T-cell counts, such as individuals with AIDS, undergoing transplants, and cancer patients. Further, the non-albicans species C. parapsilosis was detected in a 66-year-old female patient who had ovarian cancer. As Branco et al. [35] observed, C. parapsilosis was on the rise throughout Latin America, with a particular focus on patients with intravenous or catheter-related infections and long-term catheter or device usage. Patel [36] suggested a risk of Candida infection is a threshold of 200 CFU/mL. Although counts of 200-400 CFU/mL may be taken as normal, counts over 400 CFU/mL give a higher probability of symptomatic candidiasis. In the present investigation, the majority of the patients had concentrations of 1–200 CFU/mL, and two patients were within the carrier range. A patient with a count of 1,800 CFU/mL had not yet developed any infection symptoms, which means that a high CFU count doesn't mean symptoms of infection are guaranteed to develop. One interesting finding was the significantly higher mean CFU associated with C. glabrata (1800 CFU) than with C. albicans/C. dubliniensis (117.5 CFU). These observations indicate that C. glabrata could establish higher colonization levels in immunocompromised patients and might be a clinically relevant opportunistic species. Increased persistence and antifungal tolerance of C. glabrata isolates have been reported in previous studies.
Hamzavi et al. [37] emphasized the need for a professional approach and timely treatment of Candida infections, especially in conjunction with cancer treatment. The adherence to oral hygiene practices in this study was reflected by 70% reporting brushing more than three times per day. Regular tooth care, such as applying mouthwashes, flossing, and denture hygiene, is vital to lessening microbial colonization and complications. This present research is a preliminary step towards studying Candida colonization in the mouth of cancer patients. While it wasn't particularly convenient to have access to data or patient recruitment as a result of institutional limitations and COVID-19, the study clearly shows a growing trend of non-albicans species, which may have distinct pathogenic profiles or treatment resistance. It employed the traditional method and multiplex PCR to reveal information about resistance genes and virulence factors that were desperately sought nationally.
Among the 105 Staphylococcus aureus isolates, resistance was highest to penicillin (85/105, 81.0%), followed by oxacillin (62/105, 59.0%) and cefoxitin (54/105, 51.4%) (Table 6). These findings are comparable to those reported by Zaid and Mujahid [38], who reported high resistance levels to beta-lactams. This is because of two mechanisms: the production of beta-lactamases that break down the antibiotic and the presence of the mecA gene that codes for the PBP-2a protein, which allows cell wall synthesis to continue even when the antibiotic is inhibiting beta-lactamase. This resistance is due to the frequent use of beta-lactams in clinical practice. Hu et al. [39] and Márquez-Oviedo et al. [40] reported that resistance to penicillin is frequently attributed to the production of plasmid-mediated beta-lactamase (blaZ) in bacteria. In this study, the penicillin disk test was used, and the detection of beta-lactamase was confirmed in 80.0% of isolates, which is in accordance with the CLSI guidelines that this test is a sensitive method for detecting beta-lactamase. Oxacillin and cefoxitin resistance were found in 58.1% and 50.5% of isolates, slightly lower than the results of Idrees et al. [41]. One can explain the difference by the difference in clinical settings of the isolates. The levels of resistance in this study are consistent with the ones provided by Liang et al. [42] except that the current study revealed low-level resistance to vancomycin (6.8)—an anomaly relative to the past. The resistance rates to rifampicin, chloramphenicol, and trimethoprim-sulfamethoxazole were also similar to previous research. Nonetheless, the resistance rates of clindamycin, erythromycin, and gentamicin were less than those found by Andrade et al. [43].
This study identified resistance to linezolid (17/105, 16.2%) and vancomycin (9/105, 8.6%), in contrast to Hakim et al. [44], who reported no resistance to these last-line antibiotics. Resistance to levofloxacin (32/105, 30.5%), tetracycline (14/105, 13.3%), and rifampin (12/105, 11.4%) was higher than that reported in previous studies. Resistance to ceftaroline (10/105, 9.5%) is of particular concern because it is generally considered an effective therapeutic option against MRSA. Linezolid, vancomycin, and ceftaroline resistance are present, and there is an urgent need to understand the underlying resistance mechanisms via molecular surveillance. Resistance to 3 or more antimicrobial classes was seen in 53.3% of the isolates, which is similar to the findings of Liang et al. [42] and Moges et al. [45] but lower than the finding of Quispe et al. [46], which reported an MDR of 82.2%. These rates of MDR underscore the clinical complexities of treating Staphylococcus aureus infections with no detailed resistance profile. Also, 10.5% of isolates had inducible clindamycin resistance (iMLSB phenotype), 63.6% of which were MRSA. This is similar to that of Silvagni et al. [47] but is contrary to that of Saderi et al. [48], which indicates a geographic variation in the expression of iMLSB. Diagnosis of iMLSB is important to prevent treatment failure with clindamycin.
The identification of MRSA is traditionally based on the mecA gene, which codes for PBP-2a. Nonetheless, Vindel and Cercenando [49] discovered MRSA strains that do not have mecA and have mecC, which is 70 percent homologous to mecA. Thus, both genes and cefoxitin resistance were used as markers of MRSA in this study. In 56.2% of the isolates, MRSA was discovered. Even though 42.9% contained mecA, this research established a strong statistical association between MRSA and cefoxitin resistance, mecA, and mecC (p < 0.001). MRSA was detected four times more often in bronchial aspirates, and the sample type demonstrated an intermediate association, but gender and origin showed lower correlations. MRSA prevalence varies globally: 80.0% in Saudi Arabia [50], 55.1% in China [6], and 46.1% in Peru [46]. In Spain, the pediatric isolates contained only 15.4% of the isolates with the study underlining the geographic variability and the need for local surveillance systems. The most frequent resistance pattern (IQ15) was: Penicillin, Cefoxitin, Oxacillin, Clindamycin, Erythromycin, Gentamicin, Levofloxacin [51]. The same patterns were found by Gómez-Gamboa et al. [52] for resistance to beta-lactams, and then for resistance to macrolides and lincosamides. MecA was found in over 80% of the samples, in agreement with previous local reports. These samples had the highest resistance profile in the IQ15 and the blaZ, mecA, and tsst gene combination profiles. Molecular methods of detection, especially multiplex PCR, played a critical role in the detection of both resistance and virulence genes. The most frequently detected resistance gene was blaZ (78/105, 74.3%), followed by mecA (45/105, 42.9%) and mecC (19/105, 18.1%). This distribution is comparable to that reported by Andrzejczuk et al. [53], who also observed that blaZ was the predominant resistance gene, whereas mecC was detected less frequently. The presence of virulence and resistance genes is important. The blaZ, mecA, and tsst genes, which encode the TSST-1 toxin capable of causing severe systemic reactions, were the most common gene combination. The four virulence genes were screened in all isolates: tsst, eta, etb, and pvl. The tsst gene was most common (34.3%), in line with Fijałkowski et al. [54]. Other studies, namely those conducted by Amelia et al. [55] and Ade et al. [56], reported a higher occurrence of pvl, eta, and tsst, respectively. These discrepancies may reflect differences in strain distribution and suggest that virulence gene expression may occur independently of AMR profiles, warranting further investigation into their distribution in both resistant and non-resistant strains.
This study was limited by its cross-sectional design, which precluded causal inferences, and its conduct at a single center with a relatively small sample size, potentially limiting generalizability. The diagnostic accuracy of the identification of Candida spp. was reduced using RAPIDYeast. Furthermore, no antifungal susceptibility testing was done, and molecular sequencing was not available to confirm species identification.
Another limitation in the current study is that the identification was performed using the RAPIDYeast Plus system. While this technique allows for a practical and fast way of identifying yeast, it cannot distinguish C. albicans from C. dubliniensis and cannot further identify specific species within the C. parapsilosis complex. Thus, when C. albicans/C. dubliniensis and C. parapsilosis complex are cited as isolated yeasts, they need to be considered as Candida spp. complexes, not as specific Candida spp. This limitation can affect the Candida spp. distribution presented in the results since it might lead to an underestimation or overestimation of specific Candida spp. within their respective complexes. Future research needs to utilize molecular techniques such as PCR, Matrix-Assisted Laser Desorption/Ionization Time-of-Flight Mass Spectrometry (MALDI-TOF MS), and DNA sequencing to precisely identify Candida spp. at the species level. All participants had completed their planned cancer treatment before sample collection; therefore, the findings reflect oral microbial colonization during the post-treatment follow-up period rather than during active cancer therapy.
The study’s findings revealed critical observations on the oral colonization of Candida spp. and co-isolation of multidrug-resistant Staphylococcus aureus (MRSA) in cancer patients. Out of 105 individuals, C. albicans/C. dubliniensis was the most common species (62.5%), with colonization strongly related to poor oral hygiene and the use of prosthetics. The findings demonstrate that C. albicans/C. dubliniensis was the predominant Candida spp. identified among immunocompromised patients. In addition, C. glabrata and C. parapsilosis were identified, supporting the increasing recognition of non-albicans Candida spp. in oncology patients. Among the 105 Staphylococcus aureus isolates, 56 (53.3%) were multidrug-resistant, and 59 (56.2%) were classified as MRSA. The blaZ gene was detected in 78 isolates (74.3%), whereas the frequency of the mecA gene should be verified and reported consistently with the denominator used in the manuscript. The statement that 87.6% of isolates were resistant to one or more antimicrobial agents should also be verified against the original antimicrobial susceptibility dataset. The findings demonstrate substantial AMR among the isolates, with the presence of virulence genes, particularly tsst, indicating the potential for enhanced pathogenicity. The results highlight the necessity to implement integrated screening, timely diagnostics, and antimicrobial stewardship. This pilot study forms the basis for broader surveillance epidemiology and emphasizes molecular fingerprinting for the appropriate management of oncology patient infections. Oral screening for Candida spp. and MRSA should be part of routine care for malignant and premalignant oral lesions. Oral hygiene measures and antibiotic stewardship programs with molecular confirmation of resistance markers should be integrated into the care for oncology patients. Further multicenter studies with a large sample size and antifungal susceptibility testing are necessary.
[1] Zago, C.E., Silva, S., Sanitá, P.V., Barbugli, P.A., Dias, C.M., Lordello, V.B., Vergani, C.E. (2015). Dynamics of biofilm formation and the interaction between Candida albicans and methicillin-susceptible (MSSA) and -resistant Staphylococcus aureus (MRSA). PLOS ONE, 10(4): e0123206. https://doi.org/10.1371/journal.pone.0123206
[2] Baharvand, R., Fallah, F., Jafari, P., Azimi, L. (2024). Co-colonization of methicillin-resistant Staphylococcus aureus and Candida spp. in children with malignancies. AMB Express, 14(1): 22. https://doi.org/10.1186/s13568-024-01667-7
[3] Kaushik, A., Kest, H., Sood, M., Steussy, B.W., Thieman, C., Gupta, S. (2024). Biofilm producing methicillin-resistant Staphylococcus aureus (MRSA) infections in humans: Clinical implications and management. Pathogens, 13(1): 76. https://doi.org/10.3390/pathogens13010076
[4] Silva, V., Peirone, C., Amaral, J.S., et al. (2020). High efficacy of ozonated oils on the removal of biofilms produced by methicillin-resistant Staphylococcus aureus (MRSA) from infected diabetic foot ulcers. Molecules, 25(16): 3601. https://doi.org/10.3390/molecules25163601
[5] Carolus, H., Van Dyck, K., Van Dijck, P. (2019). Candida albicans and Staphylococcus species: A threatening twosome. Frontiers in Microbiology, 10: 2162. https://doi.org/10.3389/fmicb.2019.02162
[6] Yu, J., Han, W., Xu, Y., et al. (2024). Biofilm-producing ability of methicillin-resistant Staphylococcus aureus clinically isolated in China. BMC Microbiology, 24(1): 241. https://doi.org/10.1186/s12866-024-03380-8
[7] Williams, D., Lewis, M. (2011). Pathogenesis and treatment of oral candidosis. Journal of Oral Microbiology, 3(1): 5771. https://doi.org/10.3402/jom.v3i0.5771
[8] Shoaib, M., Aqib, A.I., Muzammil, I., et al. (2023). MRSA compendium of epidemiology, transmission, pathophysiology, treatment, and prevention within one health framework. Frontiers in Microbiology, 13: 1067284. https://doi.org/10.3389/fmicb.2022.1067284
[9] Hussein, N., Assafi, M., Ijaz, T. (2017). Methicillin-resistant Staphylococcus aureus nasal colonisation amongst healthcare workers in Kurdistan Region, Iraq. Journal of Global Antimicrobial Resistance, 9: 78-81. https://doi.org/10.1016/j.jgar.2017.01.010
[10] Montelongo-Jauregui, D., Lopez-Ribot, J.L. (2018). Candida interactions with the oral bacterial microbiota. Journal of Fungi, 4(4): 122. https://doi.org/10.3390/jof4040122
[11] Talapko, J., Meštrović, T., Dmitrović, B., et al. (2023). A putative role of Candida albicans in promoting cancer development: A current state of evidence and proposed mechanisms. Microorganisms, 11(6): 1476. https://doi.org/10.3390/microorganisms11061476
[12] Wang, X.L., Xu, H.W., Liu, N.N. (2023). Oral microbiota: A new insight into cancer progression, diagnosis and treatment. Phenomics, 3(5): 535-547. https://doi.org/10.1007/s43657-023-00124-y
[13] Talapko, J., Juzbašić, M., Matijević, T., et al. (2021). Candida albicans—The virulence factors and clinical manifestations of infection. Journal of Fungi, 7(2): 79. https://doi.org/10.3390/jof7020079
[14] Yuan, H., Xu, J., Wang, Y., et al. (2025). The global antimicrobial resistance trends of Staphylococcus aureus and influencing factors. Microbiology Research, 16(6): 118. https://doi.org/10.3390/microbiolres16060118
[15] Salam, M.A., Al-Amin, M.Y., Salam, M.T., et al. (2023). Antimicrobial resistance: A growing serious threat for global public health. Healthcare, 11(13): 1946. https://doi.org/10.3390/healthcare11131946
[16] An, N.V., Hai, L.H.L., Luong, V.H., et al. (2024). Antimicrobial resistance patterns of Staphylococcus aureus isolated at a general hospital in Vietnam between 2014 and 2021. Infection and Drug Resistance, 17: 259-273. https://doi.org/10.2147/IDR.S437920
[17] Touaitia, R., Mairi, A., Ibrahim, N.A., Basher, N.S., Idres, T., Touati, A. (2025). Staphylococcus aureus: A review of the pathogenesis and virulence mechanisms. Antibiotics, 14(5): 470. https://doi.org/10.3390/antibiotics14050470
[18] Foster, T.J. (2017). Antibiotic resistance in Staphylococcus aureus. Current status and future prospects. FEMS Microbiology Reviews, 41(3): 430-449. https://doi.org/10.1093/femsre/fux007
[19] Wielders, C.L., Fluit, A.C., Brisse, S., Verhoef, J., Schmitz, F.J. (2002). mecA gene is widely disseminated in Staphylococcus aureus population. Journal of Clinical Microbiology, 40(11): 3970-3975. https://doi.org/10.1128/JCM.40.11.3970-3975.2002
[20] Tluanpuii, V., Mahajan, R.K. (2025). Detection of the mecA gene and its association with antimicrobial resistance among coagulase-negative staphylococci isolated from clinical samples in a tertiary care hospital: A cross-sectional study. Cureus, 17(4): e81643. https://doi.org/10.7759/cureus.81643
[21] Pfeiffer, C.D., Samsa, G.P., Schell, W.A., Reller, L.B., Perfect, J.R., Alexander, B.D. (2011). Quantitation of Candida CFU in initial positive blood cultures. Journal of Clinical Microbiology, 49(8): 2879-2883. https://doi.org/10.1128/JCM.00609-11
[22] Skov, R., Lonsway, D.R., Larsen, J., Larsen, A.R., Samulioniené, J., Limbago, B.M. (2021). Evaluation of methods for detection of β-lactamase production in MSSA. Journal of Antimicrobial Chemotherapy, 76(6): 1487-1494. https://doi.org/10.1093/jac/dkab032
[23] Lin, R., Yang, Z., Aweya, J.J., et al. (2025). Selection of antimicrobial peptides derived from Bacillus cereus: Investigation of their antimicrobial activity and mechanism of action against Staphylococcus aureus. LWT, 216: 117312. https://doi.org/10.1016/j.lwt.2024.117312
[24] Bruijns, B., Hoekema, T., Oomens, L., Tiggelaar, R., Gardeniers, H. (2022). Performance of spectrophotometric and fluorometric DNA quantification methods. Analytica, 3(3): 371-384. https://doi.org/10.3390/analytica3030025
[25] McClure, J.A., Conly, J.M., Lau, V., et al. (2006). Novel multiplex PCR assay for detection of the staphylococcal virulence marker Panton-Valentine leukocidin genes and simultaneous discrimination of methicillin-susceptible from -resistant staphylococci. Journal of Clinical Microbiology, 44(3): 1141-1144. https://doi.org/10.1128/JCM.44.3.1141-1144.2006
[26] Butler, J.M., Devaney, J.M., Marino, M.A., Vallone, P.M. (2001). Quality control of PCR primers used in multiplex STR amplification reactions. Forensic Science International, 119(1): 87-96. https://doi.org/10.1016/s0379-0738(00)00412-6
[27] Hashiba, M., Tomino, A., Takenaka, N., et al. (2016). Clostridium perfringens infection in a febrile patient with severe hemolytic anemia. The American Journal of Case Reports, 17: 219-223. https://doi.org/10.12659/AJCR.895721
[28] Infanger, D., Schmidt-Trucksäss, A. (2019). P value functions: An underused method to present research results and to promote quantitative reasoning. Statistics in Medicine, 38(21): 4189-4197. https://doi.org/10.1002/sim.8293
[29] González-Estrada, E., Villaseñor, J., Acosta-Pech, R. (2022). Shapiro-Wilk test for multivariate skew-normality. Computational Statistics, 37: 1935-1951. https://doi.org/10.1007/s00180-021-01188-y
[30] Clinical and Laboratory Standards Institute. (2024). CLSI M100TM-Performance Standards for Antimicrobial Susceptibility Testing (34th Edition). Clinical and Laboratory Standards Institute. https://www.darvashco.com/wp-content/uploads/2024/07/CLSI-2024_compressed-1.pdf.
[31] Whibley, N., Gaffen, S.L. (2015). Beyond Candida albicans: Mechanisms of immunity to non-albicans Candida species. Cytokine, 76(1): 42-52. https://doi.org/10.1016/j.cyto.2015.07.025
[32] Mathur, R., Singhavi, H.R., Malik, A., Nair, S., Chaturvedi, P. (2019). Role of poor oral hygiene in causation of oral cancer—A review of literature. Indian Journal of Surgical Oncology, 10(1): 184-195. https://doi.org/10.1007/s13193-018-0836-5
[33] Sabino, R., Veríssimo, C., Pereira, Á.A., Antunes, F. (2020). Candida auris, an agent of hospital-associated outbreaks: Which challenging issues do we need to have in mind? Microorganisms, 8(2): 181. https://doi.org/10.3390/microorganisms8020181
[34] Hassan, Y., Chew, S.Y., Than, L.T.L. (2021). Candida glabrata: Pathogenicity and resistance mechanisms for adaptation and survival. Journal of Fungi, 7(8): 667. https://doi.org/10.3390/jof7080667
[35] Branco, J., Miranda, I.M., Rodrigues, A.G. (2023). Candida parapsilosis virulence and antifungal resistance mechanisms: A comprehensive review of key determinants. Journal of Fungi, 9(1): 80. https://doi.org/10.3390/jof9010080
[36] Patel, M. (2022). Oral cavity and Candida albicans: Colonisation to the development of infection. Pathogens, 11(3): 335. https://doi.org/10.3390/pathogens11030335
[37] Hamzavi, S.S., Amanati, A., Badiee, P., et al. (2019). Changing face of Candida colonization pattern in pediatric patients with hematological malignancy during repeated hospitalizations, results of a prospective observational study (2016-2017) in Shiraz, Iran. BMC Infectious Diseases, 19(1): 759. https://doi.org/10.1186/s12879-019-4372-x
[38] Zaid, T.A.R., Mujahid, A.R. (2023). Prevalence of multidrug resistant Staphylococcus aureus and their pathogenic toxins genes in Iraqi patients, 2022-2023. Iranian Journal of Medical Microbiology, 17(5): 559-570. https://doi.org/10.30699/ijmm.17.5.559
[39] Hu, W., Wang, Y., Zhou, L., et al. (2024). Nasal Staphylococcus aureus carriage and antimicrobial resistance profiles among community-dwelling adults in Jiangsu, China. Infectious Diseases and Therapy, 13(6): 1215-1233. https://doi.org/10.1007/s40121-024-00969-4
[40] Márquez-Oviedo, A., Romero-Coasaca, A.C., Requena-Mendizábal, M.F., et al. (2021). Resistance of Staphylococcus aureus strains isolated from the oral mucosa in a young Peruvian population. International Journal of Odontostomatology, 15(3): 634-638. https://doi.org/10.4067/S0718-381X2021000300634
[41] Idrees, M.M., Saeed, K., Shahid, M.A., et al. (2023). Prevalence of mecA- and mecC-associated methicillin-resistant Staphylococcus aureus in clinical specimens, Punjab, Pakistan. Biomedicines, 11(3): 878. https://doi.org/10.3390/biomedicines11030878
[42] Liang, Y., Tu, C., Tan, C., et al. (2019). Antimicrobial resistance, virulence genes profiling and molecular relatedness of methicillin-resistant Staphylococcus aureus strains isolated from hospitalized patients in Guangdong Province, China. Infection and Drug Resistance, 12: 447-459. https://doi.org/10.2147/IDR.S192611
[43] Andrade, D., Lara, T., Grijalva, M. (2023). Multi-locus sequence typing (MLST) of clinical isolates of methicillin-resistant Staphylococcus aureus (MRSA) from systemic infections in two hospitals in Quito-Ecuador. Acta Microbiologica Hellenica, 67: 1-7.
[44] Hakim, S.T., Arshed, S., Iqbal, M., Javaid, S. (2007). Vancomycin sensitivity of Staphylococcus aureus isolates from hospital patients in Karachi, Pakistan. Libyan Journal of Medicine, 2(4): 176-179. https://doi.org/10.4176/070624
[45] Moges, F., Tamiru, T., Amare, A., et al. (2023). Prevalence of methicillin-resistant Staphylococcus aureus and multidrug-resistant strains from patients attending the referral hospitals of Amhara Regional State, Ethiopia. International Journal of Microbiology, 2023: 3848073. https://doi.org/10.1155/2023/3848073
[46] Quispe, A.M., Soza, G., Pons, M.J. (2021). Multidrug resistance and its association with Enterobacteriales and age among pregnant Peruvian women with bacteremia. Journal of Infection in Developing Countries, 14(12): 1402-1409. https://doi.org/10.3855/jidc.12569
[47] Silvagni, M., Guillén, R., Rodríguez, F., Espínola, C., Grau, L., Velázquez, G. (2019). Inducible resistance to clindamycin in methicillin-resistant Staphylococcus aureus isolated from Paraguayan children. Revista Chilena de Infectología, 36(4): 455-460. https://doi.org/10.4067/S0716-10182019000400455
[48] Saderi, H., Emadi, B., Owlia, P. (2011). Phenotypic and genotypic study of macrolide, lincosamide and streptogramin B (MLSB) resistance in clinical isolates of Staphylococcus aureus in Tehran, Iran. Medical Science Monitor, 17(2): BR48-BR53. https://doi.org/10.12659/msm.881386
[49] Vindel, A., Cercenado, E. (2016). Methicillin-resistant Staphylococcus aureus carrying the mecC gene: An emerging problem? Enfermedades Infecciosas y Microbiología Clínica, 34(5): 277-279. https://doi.org/10.1016/j.eimc.2016.01.010
[50] Alanzi, T.K., Alhazmi, O.A., Alanezi, K., et al. (2024). Prevalence of methicillin-resistant Staphylococcus aureus in Saudi Arabia: A systematic review and meta-analysis. Cureus, 16(9): e70230. https://doi.org/10.7759/cureus.70230
[51] Ferrando Monleón, S., Bretón-Martínez, J.R., Piolatti Luna, A., et al. (2024). Prevalence and risk factors for methicillin-resistant Staphylococcus aureus infection in children. Revista Española de Quimioterapia, 37(2): 170-175. https://doi.org/10.37201/req/113.2023
[52] Gómez-Gamboa, L., Nuñez, D., Perozo-Mena, A., Bermúdez-González, J., Marín, M. (2016). Multidrug-resistant (MDR) Staphylococcus aureus in a Maracaibo’s hospital, Venezuela. Kasmera, 44(1): 53-65.
[53] Andrzejczuk, S., Cygan, M., Dłuski, D., Stępień-Pyśniak, D., Kosikowska, U. (2023). Staphylococcal resistance patterns, blaZ and SCCmec cassette genes in the nasopharyngeal microbiota of pregnant women. International Journal of Molecular Sciences, 24(9): 7980. https://doi.org/10.3390/ijms24097980
[54] Fijałkowski, K., Peitler, D., Karakulska, J. (2016). Staphylococci isolated from ready-to-eat meat – Identification, antibiotic resistance and toxin gene profile. International Journal of Food Microbiology, 238: 113-120. https://doi.org/10.1016/j.ijfoodmicro.2016.09.004
[55] Amelia, S., Kusumawati, R.L., Hasibuan, M., Winda, L., Balatif, R., Ivander, A. (2024). Prevalence of Panton-Valentine leucocidin (pvl) and exfoliative toxin A (eta) gene within methicillin resistant and susceptible Staphylococcus aureus in an urban tertiary hospital: A molecular epidemiology pilot study. F1000Research, 12: 1002. https://doi.org/10.12688/f1000research.134641.2
[56] Ade, T., Odewale, G., Daji, M., Ohirhian, J., Ojedele, R. (2022). Association of TSST-1 gene with phenotypic antibiotic resistance among clinical Staphylococcus aureus isolates in a tertiary healthcare centre. Microbes and Infectious Diseases, 4(2): 450-458. https://doi.org/10.21608/mid.2022.150189.1348