Anak Agung Ayu Wulandira Sawitri Djelantik* | Putu Perdana Kusuma Wiguna | Dewa Ayu Anom Yuarini | Ni Luh Made Pradnyawathi | Iqbal Putut Ash Shidiq
© 2026 The authors. This article is published by IIETA and is licensed under the CC BY 4.0 license (http://creativecommons.org/licenses/by/4.0/).
OPEN ACCESS
Flooding is one of the most frequent natural hazards in Indonesia and poses potential threats to agricultural systems, particularly traditional subak landscapes in Bali. This study aimed to assess terrain-based flood susceptibility and estimate potential economic exposure associated with subak agricultural land and irrigation infrastructure in East Denpasar District, Denpasar City, Indonesia. A Geographic Information System (GIS)-based approach was employed using the Topographic Wetness Index (TWI) to characterize terrain-controlled water accumulation and relative wetness. Spatial overlay analysis was conducted to identify agricultural land and irrigation networks located within different terrain-based flood susceptibility categories. Potential economic exposure was estimated from agricultural areas and irrigation lengths within the high and moderate susceptibility categories using paddy production costs per hectare and a standardized irrigation rehabilitation cost per meter. The results showed that 68.82 ha (12.56%) and 71.44 ha (13.04%) of subak agricultural land were classified within the high and moderate flood susceptibility categories, respectively. Furthermore, 10,641.14 m (13.62%) and 16,655.28 m (21.31%) of irrigation channels were located within the high and moderate susceptibility categories, respectively. The estimated potential agricultural production exposure was USD 59,751.60, while potential irrigation infrastructure exposure reached approximately USD 4.27 million, resulting in a combined potential economic exposure of approximately USD 4.33 million. These estimates represent one-time, scenario-based economic exposure under the selected susceptibility and unit-cost assumptions, rather than observed or annual flood losses. The findings demonstrate the usefulness of integrating terrain-based flood susceptibility mapping with spatial economic valuation to identify agricultural and irrigation assets potentially exposed to water accumulation and to support preliminary flood risk reduction, irrigation management, and agricultural resilience planning.
economic valuation, terrain-based flood susceptibility assessment, Geographic Information System, irrigation infrastructure, subak, Topographic Wetness Index
Indonesia’s tropical climate, monsoonal rainfall regime, and diverse topographic conditions make the country highly vulnerable to hydrometeorological hazards, particularly floods. Flooding is commonly defined as the inundation of normally dry land resulting from increased water volume or as surface water overflow exceeding normal levels [1, 2]. In urban and peri-urban environments, flood events are typically intensified by extreme rainfall, inadequate drainage systems, land-use change, and watershed disturbances [3]. Flood disasters have long been part of Indonesia’s environmental history, generating recurring socio-economic disruptions and environmental degradation [4].
Flooding remains the most frequent natural disaster in Indonesia, accounting for a substantial proportion of annual disaster occurrences relative to earthquakes, landslides, tsunamis, and volcanic eruptions [5]. Beyond direct physical damage, floods impose significant economic consequences across multiple sectors, including agriculture. In agricultural systems, flood impacts manifest through crop losses, soil productivity decline, damage to irrigation infrastructure, and disruption of farming operations. These effects translate into reduced yields, income instability, and heightened production risk—critical concerns within agribusiness and regional food systems [6].
Bali Province, despite its strong economic dependence on tourism, still retains agricultural landscapes that play essential roles in food production, ecological regulation, and cultural preservation. Among these landscapes, the subak system represents one of the most important traditional agricultural institutions, supporting rice production while maintaining the socio-cultural identity of Balinese communities [7]. However, these agricultural areas are increasingly exposed to environmental pressures, particularly flood hazards, which threaten both agricultural productivity and the sustainability of subak landscapes.
East Denpasar District represents a particularly dynamic peri-urban and tourism-supporting area where urban functions coexist with traditional agricultural land use. The district is characterized by relatively low-lying topography and a dense drainage network, conditions that contribute to its susceptibility to flooding. Recent flood events have highlighted this vulnerability, with reported impacts on several subak areas, including crop lodging, inundation, and disruption of agricultural activities. According to data from the Denpasar City Agriculture Office, between January and mid-February 2025, extreme weather conditions impacted approximately 25.58 ha of paddy fields in Denpasar City. Heavy rainfall and strong winds caused widespread lodging of rice plants and inundation of agricultural land, affecting several subak areas, including Subak Tegal Lantang, Subak Renon, Subak Sidakarya, Subak Intaran Barat, Subak Kerdung, Subak Kepaon, and Subak Margaya.
East Denpasar District was selected as the study area because it represents a highly dynamic agricultural landscape where productive subak systems persist within an increasingly developed urban environment. The district exhibits notable flood susceptibility associated with low-lying terrain, drainage limitations, and increased surface runoff resulting from changing land-use patterns. At the same time, East Denpasar retains extensive paddy fields organized under the subak institution, making it a critical area where hydrological hazards directly intersect with agricultural production and farmers' livelihoods. The coexistence of low-lying agricultural land, drainage constraints, and urban development creates conditions for potential flood exposure of subak agricultural land and irrigation infrastructure. These characteristics make East Denpasar a representative and policy-relevant case for examining terrain-based flood susceptibility and estimating potential economic exposure associated with spatially exposed agricultural and irrigation assets. These characteristics make East Denpasar a representative and policy-relevant case for examining flood-related damage and economic losses within a traditional yet increasingly pressured agricultural landscape.
Subak agricultural land use constitutes a unique socio-ecological production system in Bali. Subak is not merely an irrigation mechanism but a community-based institution that governs water allocation, cropping schedules, and collective farming practices [8]. From an agribusiness perspective, subak landscapes represent productive assets that sustain livelihoods, stabilize local rice supply, and provide valuable ecosystem services [7]. Flood exposure within these systems may affect agricultural productivity and irrigation services and may consequently generate economic impacts. In this study, such impacts are represented by scenario-based estimates of potential production and irrigation infrastructure losses derived from spatially exposed areas and corresponding unit costs.
Given the spatial complexity of water accumulation processes and the heterogeneous distribution of agricultural assets, a spatial approach is required to identify areas with greater terrain-based susceptibility to water accumulation. Geographic Information Systems (GIS) provide an effective framework for integrating topographic, land-use, and infrastructure data to characterize spatial patterns of terrain-based flood susceptibility and potential economic exposure [9-11].
In this study, the Topographic Wetness Index (TWI) is used as a terrain-based indicator of relative wetness and potential water accumulation derived from slope and upslope contributing area [12]. Higher TWI values indicate terrain conditions that favor water accumulation and soil saturation. When combined with Subak land-use and irrigation network data, TWI can be used to characterize areas with different levels of terrain-based flood susceptibility and potential exposure of agricultural assets [13]. However, TWI does not directly measure flood depth, inundation duration, or observed physical damage.
Despite extensive research on flood susceptibility mapping and agricultural vulnerability, the integration of terrain-based susceptibility assessment with spatially explicit economic loss estimation remains comparatively limited, particularly within traditional agricultural systems. Many studies prioritize hydrological modeling, hazard mapping, or physical damage assessment [14-18] without explicitly quantifying the potential economic implications for agricultural land and irrigation infrastructure. Moreover, studies focusing on Bali frequently emphasize the cultural, social, or environmental dimensions of Subak [19-21], while comparatively less attention has been given to the potential economic exposure of Subak agricultural assets to hydrometeorological hazards. Within East Denpasar District, where urban development, tourism-supporting activities, and traditional Subak landscapes coexist, an integrated spatial-economic assessment can provide useful information for identifying potentially exposed agricultural assets and estimating their potential economic exposure.
This study addresses this gap by linking GIS-based, terrain-derived flood susceptibility analysis with spatially explicit economic estimation to assess potential economic exposure associated with exposed Subak agricultural land and irrigation infrastructure. The study interprets TWI as an indicator of terrain-controlled water accumulation and relative wetness rather than a direct measure of observed flooding or physical damage. Potential economic exposure is estimated as scenario-based values derived from spatially exposed agricultural areas and irrigation networks and their corresponding unit costs. The integration of terrain-based susceptibility mapping, spatial exposure assessment, and economic estimation provides a spatially explicit framework for identifying potentially exposed Subak assets and supporting preliminary flood risk reduction and agricultural resilience planning in peri-urban agricultural systems.
2.1 Research area
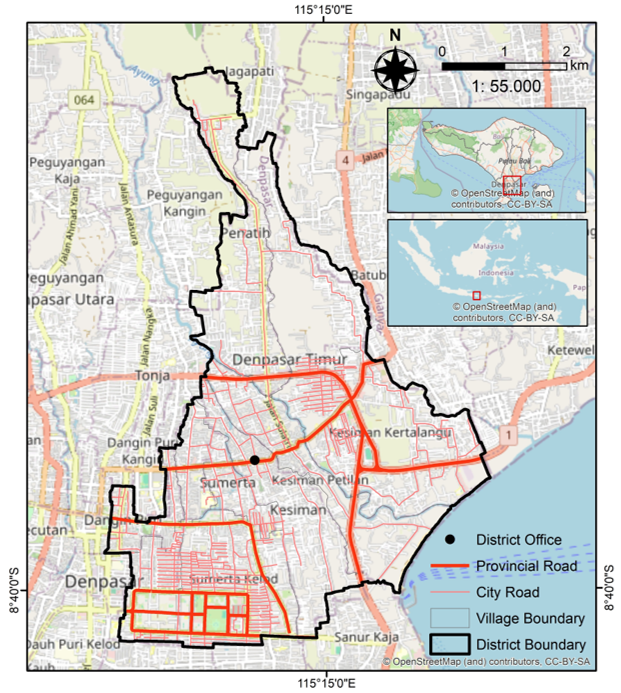
East Denpasar District is one of the four administrative districts of Denpasar City, Bali Province, Indonesia. The district is characterized by a rapidly developing peri-urban environment where urban land use coexists with traditional agricultural landscapes, particularly subak-based paddy fields. Topographically, East Denpasar is predominantly low-lying, with elevations ranging approximately between 0 and 75 meters above sea level, contributing to its susceptibility to pluvial and fluvial flooding. The district experiences a tropical monsoon climate with pronounced wet-season rainfall, which frequently triggers inundation events, especially in areas with limited drainage capacity [22]. Figure 1 shows the research location.
Despite ongoing urbanization, East Denpasar retains significant subak agricultural land use that supports local rice production and rural livelihoods. Several subak areas within the district have experienced recurrent flood disturbances associated with extreme rainfall, surface runoff accumulation, and drainage system constraints.
Figure 1. Research location
2.2 Methodology
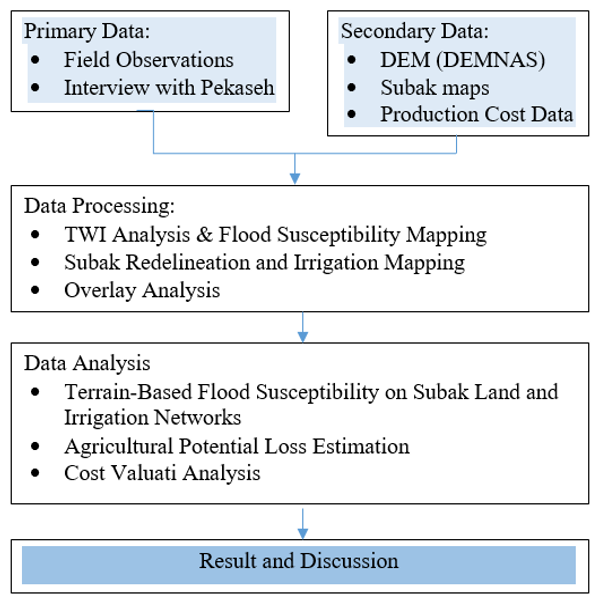
This study employed a spatial-economic assessment framework to evaluate terrain-based flood susceptibility, spatial exposure, and associated potential economic exposure in subak agricultural land use within East Denpasar District. The research was conducted through data collection, data processing, and analysis.
2.2.1 Data collection
Primary data were collected through field observations, photographic documentation, and informal interviews with relevant agricultural stakeholders. Field observations were conducted in selected subak areas to document existing agricultural conditions and evidence of flood occurrence and inundation. Informal interviews were conducted with officers from the Agricultural Extension Center (Balai Penyuluh Pertanian, BPP) and selected pekaseh (traditional subak leaders) to cross-check the occurrence, location, and characteristics of actual flood events affecting subak agricultural areas.
The information obtained was used to identify documented flood-affected locations and to support the spatial consistency check of the TWI terrain-based flood susceptibility assessment. The interviews also provided information on paddy production costs and irrigation infrastructure conditions required for the subsequent economic valuation. Field photographs and available location information were used to complement the interview-based observations and provide supporting evidence of actual flood conditions.
Secondary data were obtained from multiple institutional and geospatial sources, including:
These datasets supported spatial modeling, land-use verification, and economic valuation analysis.
2.2.2 Data processing and analysis
Subak boundaries and irrigation networks were updated through GIS-based digitization. Subak boundaries and irrigation channels were digitized on-screen in QGIS using Google Satellite imagery accessed through XYZ Tiles as the primary visual reference. Because the imagery was accessed as an XYZ tile service, a single acquisition date was not available for the imagery used in the digitization. Subak boundaries were delineated based on visible agricultural parcel configurations and available spatial information on subak areas, while irrigation channels were identified from visible linear water-conveyance features and their continuity across agricultural areas. Particular attention was given to areas where irrigation channels or agricultural boundaries were obscured by trees, vegetation, buildings, or other features. Such locations were subsequently verified through field checks to confirm the presence and approximate position of the corresponding boundaries or irrigation channels. The digitized layers were also checked for geometric consistency, including closed polygon boundaries, overlapping features, duplicate features, and discontinuities in irrigation lines.
Terrain-based flood susceptibility was assessed using the TWI derived from the DEMNAS, with a spatial resolution of 8.3 m. The upslope contributing area was derived from the DEMNAS data using the SAGA Catchment Area tool with the Multiple Flow Direction (MFD) approach. The MFD method was selected because it allows flow to be distributed among multiple downslope cells and is therefore appropriate for representing diffuse flow patterns in the relatively low-relief terrain of Denpasar. The resulting catchment-area raster was used as the specific catchment area input for the subsequent TWI calculation. No additional area conversion was applied because the input was already expressed as specific catchment area.
The TWI was calculated using the Standard method in the SAGA TWI tool. The resulting TWI was calculated for the entire Denpasar City area and subsequently clipped to the East Denpasar District boundary. This procedure minimized potential boundary effects associated with the calculation of upslope contributing area. TWI was computed using Eq. (1) [12].
$T W I={In}\left(\frac{A}{\tan (\beta)}\right)$ (1)
where,
A = upslope contributing area per unit contour length (m²/m)
β = local slope angle (degrees)
TWI values were classified using the quantile method into three flood susceptibility categories, namely, low susceptibility, moderate susceptibility, and high susceptibility. This classification produced the flood susceptibility map.
The resulting susceptibility classes were used as an exposure-screening indicator to identify agricultural land and irrigation infrastructure with relatively greater terrain-based potential for water accumulation. This approach does not represent a full flood damage model because flood depth, inundation duration, flow velocity, crop growth stage, drainage conditions, and the structural condition of irrigation infrastructure were not explicitly modeled.
A basic spatial consistency check was conducted by comparing documented flood-affected areas with the classified TWI raster. Flood-affected locations were identified through field observations, photographic documentation, and information obtained from pekaseh (subak leader). The geographic location of the documented flood area was spatially overlaid with the classified TWI raster in QGIS to determine its correspondence with the low/no, moderate, and high terrain-based flood susceptibility classes. The proportion of the observed flood-affected area falling within each TWI class was subsequently calculated. This assessment was used to examine the spatial consistency between documented flood occurrence and the relative terrain-based wetness pattern, rather than to statistically validate flood probability.
Potential economic exposure was estimated by linking the spatial exposure of subak agricultural land and irrigation infrastructure to their respective unit costs. Because the TWI classification represents relative terrain-based flood susceptibility rather than a quantitative damage level, only areas classified as high and moderate susceptibility were considered exposed for the flood-related economic loss estimation. Areas classified as low/no susceptibility were excluded from the loss calculation and were not assumed to experience zero agricultural or infrastructure value.
Potential agricultural production loss was estimated by multiplying the area of paddy fields within the high and moderate susceptibility classes by the estimated paddy production cost. The production cost represents expenditures incurred during the observed stage of rice cultivation, including seed, fertilizer, tractor, and planting costs. The calculation was expressed in Eq. (2) [23].
$L_a=A_e \times C_a$ (2)
where, La is the potential agricultural production exposure (USD), Ae is the exposed agricultural area within the high and moderate susceptibility classes (ha), and Ca is the paddy production cost per hectare (USD ha⁻¹).
Similarly, potential economic exposure associated with irrigation infrastructure was estimated by multiplying the length of irrigation channels within the high and moderate susceptibility classes by the estimated irrigation construction cost. Potential irrigation exposure was calculated using unit construction costs per meter of irrigation infrastructure as shown in Eq. (3) [24].
$L_i=L_e \times C_i$ (3)
where, Li is the potential irrigation-related economic exposure (USD), Le is the exposed irrigation channel length (m), and Ci is the estimated irrigation construction cost per meter (USD m⁻¹). This approach provides a spatially explicit estimate of the economic value potentially exposed to flood-related impacts without assuming a specific physical damage ratio for each susceptibility class.
The potential economic exposure represents the monetary value potentially exposed within agricultural and irrigation assets located in the high and moderate susceptibility categories under the selected unit-cost assumptions. The estimate does not represent actual physical damage or observed repair expenditure.
The economic valuation represents a one-time potential exposure estimate rather than an annual expected loss. For irrigation infrastructure, the adopted unit cost represents a full-rehabilitation cost and was therefore treated as an upper-bound reconstruction scenario. Because the analysis does not incorporate flood probability, return periods, recurrence frequency, crop-stage-specific damage, or the probability and severity of structural damage, the resulting values do not represent observed or annualized flood exposure. Instead, they indicate the maximum potential economic exposure of agricultural production and irrigation infrastructure under the selected susceptibility and cost assumptions. Figure 2 presents the research flowchart.
Figure 2. Research flowchart
3.1 Subak redelineation and terrain-based flood susceptibility analysis
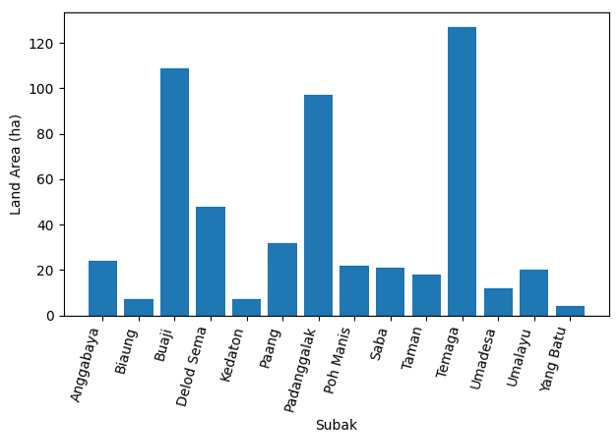
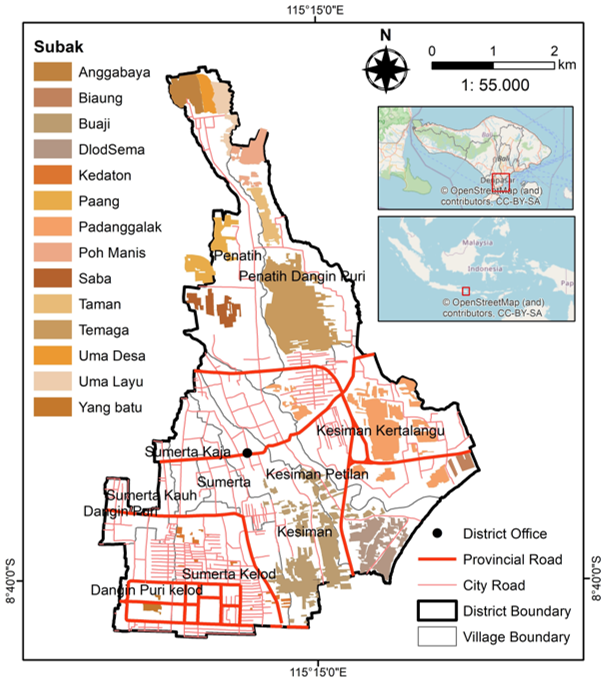
East Denpasar District comprises 14 subak units distributed across several villages/urban wards (kelurahan/desa). The largest subak areas are Temaga (127 ha), Buaji (109 ha), and Padanggalak (97 ha), indicating that these subak systems represent the dominant agricultural landscapes within the district. Medium-sized subak areas include Delod Sema (48 ha), Paang (32 ha), Anggabaya (24 ha), Poh Manis (22 ha), Saba (21 ha), Taman (18 ha), Umadesa (12 ha), and Umalayu (20 ha). Smaller subak units such as Biaung (7 ha), Kedaton (7 ha), and Yang Batu (4 ha) reflect more limited agricultural land distribution. This variation in subak land extent highlights the heterogeneous spatial structure of agricultural land use in East Denpasar, which is relevant for analyzing differential exposure to flood susceptibility and the resulting potential economic exposure. Figure 3 shows the subak area in East Denpasar District. Figure 4 shows the subak map of East Denpasar District.
Figure 3. Subak agricultural land in East Denpasar District
Figure 4. Map of subak agricultural land in East Denpasar District
The TWI values were classified into three relative susceptibility classes using the quantile method. The resulting thresholds were 7.6725 and 8.7186, corresponding to the 33.33rd and 66.67th percentiles of the TWI distribution, respectively. Based on the quantile classification of TWI values, three terrain-based flood susceptibility classes were defined: low/no susceptibility (5.1192 ≤ TWI ≤ 7.6725), moderate susceptibility (7.6725 < TWI ≤ 8.7186), and high susceptibility (8.7186 < TWI ≤ 22.0960). Because the quantile method is based on the relative distribution of TWI values, these categories indicate differences in terrain-based potential for water accumulation rather than absolute flood probability. Thus, a location classified as high represents an area with relatively higher TWI values within the study dataset, but does not imply a specific probability or frequency of flooding.
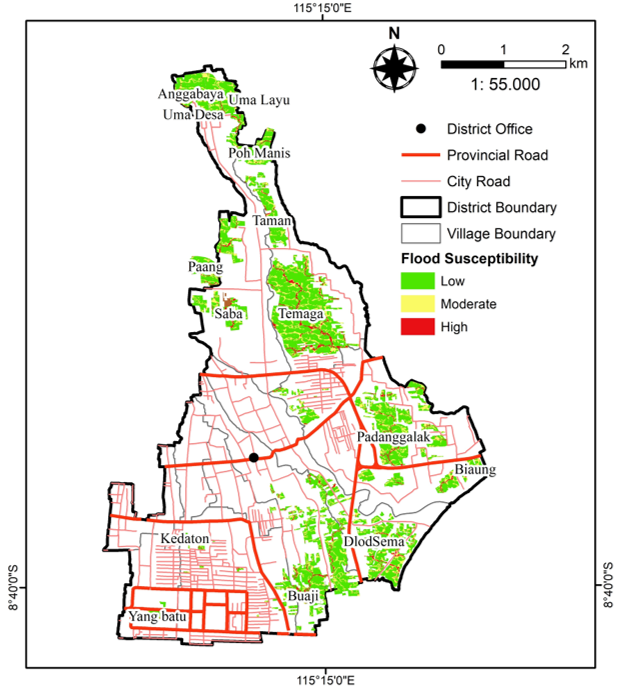
The terrain-based spatial analysis indicates that subak agricultural land use in East Denpasar District exhibits varying levels of potential flood-related susceptibility. Of the total 543.217 hectares analyzed, approximately 68.821 hectares (12.67%) fall within the high TWI category, representing areas with a strong tendency for water accumulation and soil saturation. An additional 71.442 hectares (13.15%) are classified as moderate susceptibility, suggesting a considerable susceptibility to temporary inundation. The remaining 402.954 hectares (74.18%) are categorized as low or non-susceptible, indicating relatively stable hydrological conditions. Table 1 shows the flood susceptibility potential of subak agricultural land in East Denpasar District. Figure 5 shows the spatial distribution of flood susceptibility potential in Subak rice fields of East Denpasar District.
Table 1. Terrain-based susceptibility potential of subak agricultural land in East Denpasar District
|
Subak Name |
High (Ha) |
Moderate (Ha) |
Low/None (Ha) |
|
Anggabaya |
2.077 |
3.096 |
18.826 |
|
Biaung |
0.616 |
1.236 |
5.315 |
|
Buaji |
15.183 |
13.675 |
80.061 |
|
Delod Sema |
6.838 |
7.144 |
33.759 |
|
Kedaton |
0.853 |
0.750 |
4.964 |
|
Paang |
3.533 |
3.932 |
23.448 |
|
Padanggalak |
13.134 |
13.247 |
69.803 |
|
Poh Manis |
2.592 |
2.829 |
16.149 |
|
Saba |
2.955 |
2.696 |
15.235 |
|
Taman |
1.227 |
2.074 |
14.432 |
|
Temaga |
15.955 |
15.874 |
93.998 |
|
Umadesa |
1.148 |
1.938 |
8.808 |
|
Umalayu |
2.562 |
2.469 |
14.817 |
|
Yang Batu |
0.148 |
0.482 |
3.339 |
|
Total |
68.821 |
71.442 |
402.954 |
Subak Temaga, Buaji, and Padanggalak display the largest extents of land within the high susceptibility category, measuring 15.955 ha, 15.183 ha, and 13.134 ha, respectively. These subak systems therefore represent the most exposed agricultural areas. Similarly, Subak Temaga also records the highest moderate susceptibility extent (15.874 ha), indicating relatively greater terrain-based susceptibility to flooding. In contrast, smaller subak units such as Yang Batu, Biaung, and Kedaton show minimal areas under high susceptibility conditions, suggesting comparatively lower flood susceptibility potential.
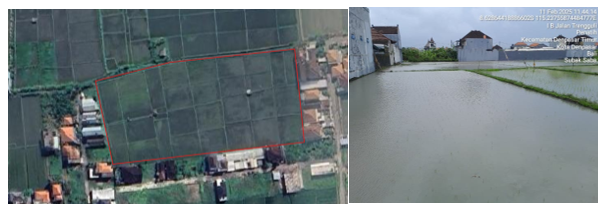
The proportion of land classified as high and moderate TWI reflects zones where persistent soil moisture, runoff convergence, and surface water retention are more likely to occur. In subak agricultural systems, such conditions increase the risk of crop lodging, delayed planting schedules, reduced productivity, and potential harvest failure. Consequently, subak units with larger areas within the high susceptibility category have greater spatial exposure to terrain-based flooding and may therefore have greater potential economic exposure, depending on the extent and value of the assets located within these areas. A recent flood event documented in Subak Saba provides field-based evidence for examining the spatial consistency of the TWI-based susceptibility assessment. Figure 6 shows the recent flood location.
Figure 5. Spatial distribution of flood susceptibility potential in subak land of East Denpasar District
Figure 6. Recent flood location
According to the interview with the pekaseh of Subak Saba, flooding affected the paddy fields in the area, and field photographic documentation shows substantial water accumulation across the cultivated rice fields. The observed inundation indicates that localized flooding has occurred within the subak agricultural landscape under actual field conditions. Spatial overlay of the documented flood-affected area with the TWI susceptibility map shows that portions of the observed inundation area coincide with areas classified within the higher TWI susceptibility category. This spatial correspondence provides a basic consistency check between the terrain-based wetness pattern and documented flood occurrence.
3.2 Irrigation channel exposure to flood susceptibility
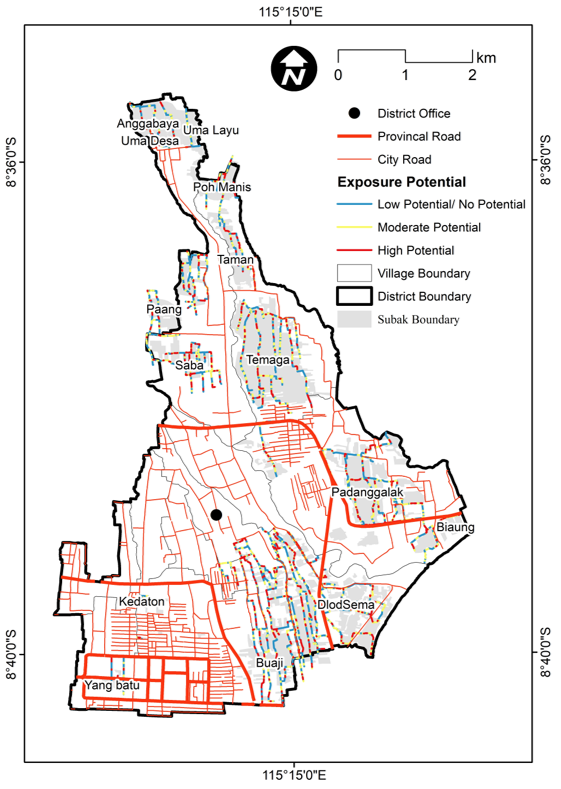
The irrigation infrastructure within the fourteen subak systems analyzed in East Denpasar District comprises a total channel length of 78,151.64 meters. Among the fourteen subak units assessed, Subak Buaji has the longest irrigation network within the study area, with 3,518.12 m classified as high susceptibility, 4,927.71 m as moderate, and 17,897.51 m as low/none. This is followed by Subak Padanggalak, with 2,214.76 m, 3,475.14 m, and 8,332.40 m in the high, moderate, and low/none classes, respectively, and Subak Temaga, with 1,252.94 m, 2,328.97 m, and 6,595.73 m, respectively. These extensive irrigation networks indicate relatively larger irrigation service areas and greater exposure of physical infrastructure to potential flood-related impacts. Table 2 presents the distribution of subak irrigation channel lengths (m) across the terrain-based flood susceptibility categories in East Denpasar District, while Figure 7 illustrates the spatial distribution of potential flood exposure across the subak irrigation networks.
Table 2. The distribution of subak irrigation channel lengths across the terrain-based flood susceptibility categories in East Denpasar District
|
Subak Name |
High (m) |
Moderate (m) |
Low/ None (m) |
|
Anggabaya |
143.07 |
370.09 |
1,558.65 |
|
Biaung |
67.56 |
200.14 |
130.56 |
|
Buaji |
3,518.12 |
4,927.71 |
17,897.5 |
|
Delod Sema |
836.70 |
1,691.7 |
3,100.91 |
|
Kedaton |
61.51 |
72.48 |
239.52 |
|
Paang |
544.01 |
911.33 |
3,809.0 |
|
Padanggalak |
2,214.76 |
3,475.1 |
8,332.4 |
|
Poh Manis |
362.30 |
567.29 |
1,635.4 |
|
Saba |
987.22 |
1,209.2 |
3,582.8 |
|
Taman |
395.82 |
419.95 |
1,368.8 |
|
Temaga |
1,252.94 |
2,328.9 |
6,595.7 |
|
Umadesa |
116.42 |
186.13 |
840.70 |
|
Umalayu |
22.79 |
121.16 |
651.25 |
|
Yang Batu |
117.94 |
173.87 |
1,112.00 |
|
Total |
10,641.14 |
16,655.28 |
50,855.19 |
Figure 7. Spatial distribution of terrain-based flood susceptibility in subak irrigation networks
In contrast, Subak Umalayu has the shortest irrigation length within the high susceptibility class, at 22.79 m, followed by Kedaton (61.51 m) and Biaung (67.56 m). The remaining subak systems, including Paang, Poh Manis, Saba, Taman, Umadesa, and Yang Batu, exhibit intermediate irrigation network lengths distributed across the three susceptibility classes. Overall, the results indicate that although most irrigation infrastructure is located within the low/none susceptibility category, several subak systems contain substantial irrigation networks within high and moderate susceptibility zones, particularly Buaji, Padanggalak, and Temaga. These areas therefore warrant greater attention in irrigation maintenance and flood mitigation planning.
From an agribusiness perspective, damage to irrigation infrastructure can disrupt water allocation, delay planting schedules, reduce cropping intensity, and increase production costs. Therefore, subak systems with extensive irrigation networks located within high and moderate flood susceptibility areas may face greater exposure and should receive priority attention in flood mitigation, irrigation maintenance, and agricultural risk management strategies.
3.3 Agricultural production exposure assessment
Information on paddy production costs was obtained from the Agricultural Extension Center (BPP) and interviews with several pekaseh (subak leaders). The production cost components represent the expenditures incurred during a single paddy production cycle and were used as the basis for estimating potential agricultural production exposure associated with flood exposure.
The average seed requirement was approximately 50 kg ha⁻¹, with Ciherang and Pandanwangi being the predominant varieties and having comparable prices. Fertilizer requirements consisted of approximately 275 kg ha⁻¹ of subsidized urea and 250 kg ha⁻¹ of subsidized NPK fertilizer. Farmers also incurred costs for tractor services and planting activities. Based on these components, the total paddy production cost was estimated at IDR 6,943,750 ha⁻¹, equivalent to approximately USD 426.0 ha⁻¹, using an exchange rate of USD 1 = IDR 16,300. This unit production cost was subsequently applied to the agricultural land area within each terrain-based flood susceptibility category to estimate potential flood-related production exposure. Pesticide costs were not included because the affected fields were generally at the land preparation, planting, and early fertilization stages, before pest and disease control activities had been undertaken. These verified production costs were subsequently used as the unit cost for estimating potential agricultural production exposure within the high and moderate terrain-based flood susceptibility areas. Table 3 presents the production cost components used to estimate potential paddy production exposure in East Denpasar District.
This study focuses exclusively on paddy cultivation because rice is the dominant crop cultivated within the subak systems of East Denpasar District. Although some farmers occasionally cultivate secondary crops, these crops are generally produced for household consumption rather than commercial purposes and were therefore excluded from the economic valuation. The production cost components included seeds, subsidized urea fertilizer, subsidized NPK fertilizer, tractor services, and planting services. Based on field information, these components represent the production expenditures that had generally been incurred when flooding occurred, particularly during the early to intermediate stages of paddy cultivation.
Table 3. Production cost components used to estimate potential paddy production exposure in East Denpasar District
|
Production Cost Component |
Unit Price (IDR) |
Requirement per ha |
Cost per ha (IDR) |
Cost per ha (USD) |
|
Seed |
95,000 per 5-kg bag |
50 kg |
950,000 |
58.28 |
|
Subsidized urea fertilizer |
2,250 kg⁻¹ |
275 kg |
618,750 |
37.96 |
|
Subsidized NPK fertilizer |
2,300 kg⁻¹ |
250 kg |
575,000 |
35.28 |
|
Tractor service |
IDR 26,000 are⁻¹ |
100 are |
2,600,000 |
159.51 |
|
Planting service |
IDR 22,000 are⁻¹ |
100 are |
2,200,000 |
134.97 |
|
Total |
6,943,750 |
426.00 |
||
The production cost data reflect field conditions during recent flood events. According to interviews with farmers and pekaseh, most paddy fields affected by flooding were still in the early to intermediate stages of cultivation, particularly during land preparation, planting, and fertilization. Consequently, the economic valuation in this study considers only production expenditures that had been incurred before the occurrence of flooding.
The estimated potential agricultural production exposure within the exposed areas of East Denpasar District amounts to approximately USD 59,751.60. This value represents the production costs potentially at risk in agricultural areas classified as high and moderate terrain-based flood susceptibility. Of this total, USD 29,317.53 (49.07%) is associated with the high susceptibility category, while USD 30,434.07 (50.93%) is associated with the moderate category. The relatively similar contributions of the two classes indicate that both high and moderate susceptibility areas represent important components of agricultural economic exposure. Table 4 presents the estimated potential agricultural production exposure of the subak systems in East Denpasar District.
Among the fourteen subak systems, Subak Temaga records the highest potential agricultural production exposure, reaching USD 13,559.06, followed by Subak Buaji (USD 12,293.42) and Subak Padanggalak (USD 11,238.22). Together, these three subak systems account for approximately 62.0% of the total estimated agricultural production exposure. Their relatively high exposure is associated with the considerable extent of agricultural land classified within the high and moderate susceptibility categories. In contrast, Subak Yang Batu (USD 268.38), Kedaton (USD 682.88), and Biaung (USD 788.94) record the lowest potential exposure, reflecting their smaller exposed agricultural areas.
Table 4. The estimated potential agricultural production exposure of the subak systems in East Denpasar District
|
Subak |
High Susceptibility (USD) |
Moderate Susceptibility (USD) |
Potential Agricultural Exposure (USD) |
|
Anggabaya |
884.80 |
1,318.89 |
2,203.69 |
|
Biaung |
262.41 |
526.53 |
788.94 |
|
Buaji |
6,467.91 |
5,825.51 |
12,293.42 |
|
Delod Sema |
2,912.97 |
3,043.32 |
5,956.29 |
|
Kedaton |
363.38 |
319.50 |
682.88 |
|
Paang |
1,505.05 |
1,675.02 |
3,180.07 |
|
Padanggalak |
5,595.04 |
5,643.18 |
11,238.22 |
|
Poh Manis |
1,104.18 |
1,205.15 |
2,309.33 |
|
Saba |
1,258.82 |
1,148.49 |
2,407.31 |
|
Taman |
522.70 |
883.52 |
1,406.22 |
|
Temaga |
6,796.78 |
6,762.28 |
13,559.06 |
|
Umadesa |
489.04 |
825.58 |
1,314.62 |
|
Umalayu |
1,091.40 |
1,051.79 |
2,143.19 |
|
Yang Batu |
63.05 |
205.33 |
268.38 |
|
Total |
29,317.53 |
30,434.07 |
59,751.60 |
From an agribusiness perspective, these potential production exposures represent the direct financial inputs invested in paddy cultivation, including seeds, fertilizers, land preparation, and planting services, while also reflecting the potential economic implications for farmers' livelihoods and local rice production. Flood-related crop damage can reduce the return on production inputs, disrupt production cycles, and increase uncertainty in farm-level production planning. Therefore, subak systems with relatively high estimated economic exposure, particularly Temaga, Buaji, and Padanggalak, should receive priority attention in flood mitigation planning, irrigation management, and agricultural risk reduction strategies. Targeted interventions in these subak systems could help reduce potential production exposure and strengthen the economic resilience of subak-based farming systems in East Denpasar District.
3.4 Irrigation infrastructure exposure assessment
The estimated irrigation construction cost of USD 151.01 m⁻¹ was derived from the 2024 Subak Sembung irrigation rehabilitation project in Denpasar City. Because this unit cost was obtained from a single rehabilitation project, it was not interpreted as an actual flood repair cost. Instead, it was used as a standardized full-rehabilitation unit cost and treated as an upper-bound estimate of the economic value potentially exposed within the assessed irrigation network.
The cost includes construction-related components specified in the project estimate, including preparatory works, earthworks, masonry and plastering, concrete works, pipe installation, and associated taxes and customary ceremonial activities. Therefore, the resulting irrigation valuation represents a potential upper-bound economic exposure under a full-rehabilitation assumption rather than the expected cost of partial flood repairs.
The project cost estimate comprised several work components, including preparatory works, earthworks, masonry and plastering, concrete works, pipe installation, and customary ceremonial activities associated with irrigation infrastructure development in Bali. The preparatory works consisted of surveying and staking, project signboards, traffic signs, site clearing, and occupational health and safety (OHS) measures. Earthworks included excavation of hard soil, material transportation, and backfilling activities. Structural works involved plastering, timber formwork, cyclopean concrete construction, and pipe installation. In addition, the project budget included costs associated with traditional ceremonies (ngeruak, melaspas, sewinih, and aci-aci), reflecting the socio-cultural characteristics of infrastructure development within Balinese subak systems.
The total project cost was used to derive a standardized irrigation construction cost per meter by dividing the total project cost by the total length of the constructed irrigation channel. This unit cost was subsequently applied to the length of irrigation infrastructure within each terrain-based flood susceptibility category to estimate the potential economic loss associated with irrigation damage. Table 5 presents the estimated irrigation construction cost per meter used in the economic valuation.
Table 5. Estimated irrigation construction cost per meter
|
Description |
Value |
|
Total Project Cost (excluding VAT) |
USD 44,216.04 |
|
VAT (11%) |
USD 4,863.76 |
|
Total Project Cost (including VAT) |
USD 49,079.80 |
|
Total Length of Irrigation Construction |
325 m |
|
Estimated Construction Cost per Meter |
USD 151.01 m⁻¹ |
The total construction cost amounted to IDR 720,721,400.60, excluding value-added tax (VAT). After adding an 11% VAT of IDR 79,279,354.07, the total project cost reached IDR 800,000,754.67. Given that the total length of the irrigation construction project was 325 m, the estimated irrigation construction cost was approximately IDR 2,461,538 m⁻¹, equivalent to USD 151.01 m⁻¹ (assuming an exchange rate of USD 1 = IDR 16,300).
The estimated irrigation construction cost per meter was used to calculate the potential economic loss associated with irrigation infrastructure located within the high and moderate terrain-based flood susceptibility categories in East Denpasar District. By applying a standardized unit cost to the exposed irrigation channel length, the analysis provides a consistent and spatially explicit estimate of the economic value potentially at risk and allows comparison among subak systems with different irrigation network lengths and levels of terrain-based flood susceptibility.
The total potential economic exposure associated with exposed irrigation infrastructure was estimated at approximately USD 4.27 million. Of this amount, USD 1.76 million (41.1%) is associated with irrigation channels within the high susceptibility category, while USD 2.52 million (58.9%) is associated with the moderate category. The larger contribution from the moderate category is primarily related to the greater total length of irrigation channels located within this class. These estimates indicate that irrigation infrastructure represents an important economic asset potentially exposed to flood-related impacts, in addition to the exposure associated with agricultural production. Table 6 presents the estimated potential economic exposure associated with irrigation infrastructure across terrain-based flood susceptibility categories in the subak systems of East Denpasar District.
Table 6. Estimated potential economic exposure associated with irrigation infrastructure across terrain-based flood susceptibility categories in the subak systems of East Denpasar District
|
Subak |
High Susceptibility (USD) |
Moderate Susceptibility (USD) |
Potential Irrigation Exposure (USD) |
|
Anggabaya |
21,605.0 |
55,888.8 |
77,493.8 |
|
Biaung |
10,202.6 |
30,224.4 |
40,427.0 |
|
Buaji |
531,287.3 |
744,155.4 |
1,275,442.7 |
|
Delod Sema |
126,353.5 |
255,477.3 |
381,830.8 |
|
Kedaton |
9,288.3 |
10,945.4 |
20,233.7 |
|
Paang |
82,153.8 |
137,623.4 |
219,777.2 |
|
Padanggalak |
334,460.5 |
524,797.5 |
859,258.0 |
|
Poh Manis |
54,712.3 |
85,670.0 |
140,382.3 |
|
Saba |
149,085.2 |
182,620.6 |
331,705.8 |
|
Taman |
59,773.8 |
63,418.6 |
123,192.4 |
|
Temaga |
189,212.8 |
351,708.0 |
540,920.8 |
|
Umadesa |
17,580.5 |
28,107.6 |
45,688.1 |
|
Umalayu |
3,441.0 |
18,296.9 |
21,737.9 |
|
Yang Batu |
17,810.1 |
26,257.2 |
44,067.3 |
|
Total |
1,757,084.8 |
2,515,191.1 |
4,272,275.9 |
Among the fourteen subak systems, Subak Buaji exhibits the highest potential irrigation-related economic exposure, amounting to approximately USD 1.28 million, followed by Subak Padanggalak (USD 859,258.0) and Subak Temaga (USD 540,920.8). Together, these three subak systems account for approximately 62.6% of the total estimated irrigation-related economic exposure in East Denpasar District. Their relatively high economic exposure is associated with the substantial lengths of irrigation channels located within the high and moderate susceptibility categories. These subak systems therefore represent important priority areas for irrigation infrastructure management and flood risk reduction.
In contrast, Subak Kedaton (USD 20,233.7), Umalayu (USD 21,737.9), and Biaung (USD 40,427.0) exhibit the lowest estimated potential exposure. Their lower values are associated primarily with the relatively limited lengths of irrigation infrastructure located within the high and moderate susceptibility categories. This variation demonstrates that the potential economic burden is influenced by both the spatial distribution of terrain-based flood susceptibility and the extent of irrigation infrastructure exposed within each subak system. Consequently, areas with high susceptibility and extensive irrigation networks require greater attention because they combine relatively greater terrain-based exposure with higher economic asset values.
From an agribusiness perspective, the potential economic implications of irrigation exposure extend beyond the physical value of the infrastructure itself. Flood-related disruption to irrigation channels may interfere with water distribution, delay planting activities, reduce cropping continuity, and increase the costs required to maintain agricultural production. These effects can subsequently influence farm income and the reliability of agricultural production within subak systems. Therefore, flood mitigation and irrigation management should prioritize subak systems with substantial exposed infrastructure, particularly Buaji, Padanggalak, and Temaga, through targeted infrastructure maintenance, rehabilitation planning, improved drainage management, and measures that maintain the continuity of irrigation services.
The estimated irrigation-related economic exposure should be interpreted as an upper-bound exposure estimate rather than an actual repair cost. The unit cost of USD 151.01 m⁻¹ was derived from a single irrigation rehabilitation project and represents full rehabilitation under the specified project conditions. Actual flood-related repair costs may be substantially lower depending on the type, extent, and severity of infrastructure damage. Differences in canal materials, construction standards, structural conditions, and repair requirements among subak systems may also result in substantial variation in actual rehabilitation costs. Therefore, the estimated value is primarily intended to indicate the potential economic magnitude of irrigation infrastructure exposed to flood susceptibility and to support spatial prioritization of mitigation investments.
The economic estimates should be interpreted as scenario-based potential exposure rather than annual expected flood exposure. The analysis does not incorporate flood occurrence probabilities, return periods, recurrence rates, or probabilities of partial or complete infrastructure failure. Similarly, agricultural exposure is not adjusted for crop growth stage or flood duration. The irrigation valuation additionally assumes the full rehabilitation of exposed channel segments using a standardized unit cost derived from a reference rehabilitation project. Consequently, the estimated values represent a maximum potential economic exposure under the selected scenario and may exceed actual expenditures following individual flood events. Future studies incorporating hydrodynamic flood modeling, flood-frequency analysis, observed damage ratios, and repeated-event data would enable estimation of annual expected exposure and more realistic event-specific economic impacts.
A sensitivity analysis was conducted to examine the stability of the estimated potential economic exposure under plausible variations in the unit costs of paddy production and irrigation rehabilitation. The baseline unit costs were independently varied by ±10%, while the spatial extent of agricultural land and irrigation infrastructure within the high and moderate susceptibility categories was kept constant. Under the lower-cost scenario (-10%), the estimated potential agricultural production exposure decreased to USD 53,776.44, while potential irrigation infrastructure exposure decreased to USD 3,845,048.31, resulting in a combined potential economic exposure of USD 3,898,824.75. Under the higher-cost scenario (+10%), the corresponding values increased to USD 65,726.76 for agricultural production and USD 4,699,503.49 for irrigation infrastructure, resulting in a combined potential economic exposure of USD 4,765,230.25. The baseline estimate was USD 59,751.60 for agricultural production and USD 4,272,275.90 for irrigation infrastructure, with a combined potential economic exposure of USD 4,332,027.50.
The sensitivity results indicate that a 10% variation in unit costs produces a proportional change in the estimated economic exposure, while the relative contribution of irrigation infrastructure remains dominant under all scenarios. Irrigation infrastructure accounts for approximately 98.6% of the combined exposure in each scenario, whereas agricultural production accounts for approximately 1.4%. Thus, although uncertainty in unit costs affects the absolute monetary estimates, it does not substantially alter the main interpretation of the assessment: irrigation infrastructure represents the dominant economic asset potentially exposed within the high and moderate terrain-based flood susceptibility categories. The results therefore indicate that the overall economic interpretation is relatively stable under reasonable variation in the selected unit-cost assumptions. Table 7 presents the sensitivity analysis of estimated economic exposure under alternative unit-cost scenarios.
Table 7. Sensitivity analysis of estimated economic exposure under alternative unit-cost scenarios
|
Cost Scenario |
Agricultural Production Exposure (USD) |
Irrigation Infrastructure Exposure (USD) |
Combined Potential Economic Exposure (USD) |
Irrigation Share (%) |
|
-10% |
53,776.44 |
3,845,048.31 |
3,898,824.75 |
98.62 |
|
Baseline |
59,751.60 |
4,272,275.90 |
4,332,027.50 |
98.62 |
|
10% |
65,726.76 |
4,699,503.49 |
4,765,230.25 |
98.62 |
3.5 Spatial distribution of terrain-based flood susceptibility and economic exposure
The spatial analysis reveals considerable variation in terrain-based flood susceptibility among the subak systems in East Denpasar District. The distribution of areas classified within the high and moderate susceptibility categories is heterogeneous and reflects differences in local terrain conditions and the spatial configuration of agricultural land. Subak Buaji, Padanggalak, and Temaga contain relatively extensive agricultural areas within the high and moderate susceptibility categories, indicating a greater concentration of agricultural assets potentially exposed to terrain-controlled water accumulation. These spatial patterns suggest that susceptibility is not uniformly distributed across the subak landscape, and that particular subak systems may require greater attention when susceptibility is considered together with the extent of agricultural and irrigation assets.
However, absolute economic exposure alone is not sufficient to establish the relative priority of individual subak systems. A subak with a large agricultural area or extensive irrigation network may have a high total potential exposure simply because it contains more physical assets, even when the proportion of those assets located within susceptible areas is relatively moderate. Therefore, additional exposure intensity indicators were used to provide a more comparable assessment among subak systems. These indicators include the proportion of agricultural land located within the high and moderate susceptibility categories, the proportion of irrigation channels located within these categories, agricultural economic exposure relative to the total agricultural area of each subak, and irrigation infrastructure exposure relative to the total length of its irrigation network. These indicators complement the absolute exposure estimates by describing the relative concentration of potentially exposed agricultural and irrigation assets. Table 8 presents exposure intensity indicators for subak systems in East Denpasar District.
The exposure intensity indicators demonstrate that absolute economic exposure and relative exposure intensity do not necessarily produce the same pattern among subak systems. Subak Buaji records the highest absolute economic exposure, consistent with its relatively extensive agricultural land and irrigation network. However, the proportion of exposed assets provides additional information for comparing subak systems of different sizes. Several smaller subak systems may have lower absolute economic exposure but a relatively high proportion of their agricultural land or irrigation infrastructure located within high and moderate susceptibility areas. For example, Biaung has a comparatively small irrigation network, but a substantial proportion of its channels are located within the high and moderate susceptibility categories. Similarly, Padanggalak exhibits a relatively high proportion of exposed irrigation infrastructure. These results demonstrate the importance of distinguishing between the magnitude of economic exposure and the intensity or concentration of exposure when interpreting spatial risk patterns.
Considering both absolute exposure and exposure intensity, Subak Buaji, Padanggalak, and Temaga can be identified as important candidate priority areas for flood risk reduction. Their prioritization is not based solely on their total potential economic exposure, but also on the substantial extent of agricultural land and irrigation infrastructure located within the high and moderate susceptibility categories. Buaji has the largest absolute economic exposure, while Padanggalak combines substantial economic exposure with a relatively high proportion of exposed irrigation infrastructure. Temaga also represents an important priority because of its considerable agricultural and irrigation assets within susceptible areas. Nevertheless, the exposure intensity indicators indicate that smaller subak systems should not be excluded from risk reduction planning solely because their total economic exposure is lower. Where a large proportion of their productive assets is spatially concentrated within susceptible areas, targeted local interventions may still be warranted.
The spatial distribution of terrain-based flood susceptibility should also be interpreted within the broader land-use dynamics of East Denpasar District. As an urban district containing residential, commercial, educational, tourism-related, and agricultural activities, East Denpasar represents a landscape in which subak agricultural areas increasingly coexist with developed land. Remaining paddy fields function not only as productive agricultural areas but also as open and relatively permeable spaces within the urban environment. Changes in surrounding land use can modify surface runoff pathways and reduce opportunities for infiltration and temporary water retention. Consequently, low-lying agricultural areas may receive runoff from surrounding developed areas during periods of intense rainfall, increasing the potential for water accumulation where drainage and infiltration capacity are insufficient. The spatial concentration of higher TWI values therefore needs to be considered together with the changing configuration of agricultural and built-up land.
From an agricultural and agribusiness perspective, these interactions have implications for the continuity and efficiency of subak-based production. Maintaining agricultural open spaces, improving drainage connectivity, rehabilitating vulnerable irrigation infrastructure, and preserving areas capable of temporarily retaining excess runoff may help reduce the potential consequences of flood-related water accumulation. Flood susceptibility information can also be integrated into spatial planning and agricultural management to identify locations where irrigation rehabilitation and drainage improvements should receive greater attention. In particular, subak systems combining substantial economic exposure with high exposure intensity should be considered in the prioritization of mitigation and adaptation measures. Such an approach allows flood management to account not only for terrain-based susceptibility but also for the spatial distribution and economic significance of agricultural and irrigation assets within the rapidly urbanizing landscape of East Denpasar District.
Table 8. Exposure intensity indicators for subak systems in East Denpasar District
|
Subak |
Total Potential Exposure (High + Moderate) (USD) |
Agricultural Exposure (USD ha⁻¹) |
Irrigation Exposure (USD m⁻¹) |
Exposed Agricultural Area (%) |
Exposed Canal (%) |
|
Anggabaya |
79,695.98 |
91.82 |
37.40 |
21.56 |
24.77 |
|
Biaung |
41,214.32 |
110.08 |
101.50 |
25.84 |
67.22 |
|
Buaji |
1,287,698.21 |
112.87 |
48.41 |
26.49 |
32.06 |
|
Delod Sema |
387,769.97 |
124.76 |
67.83 |
29.29 |
44.91 |
|
Kedaton |
20,916.71 |
103.99 |
54.17 |
24.41 |
35.87 |
|
Paang |
222,950.96 |
102.87 |
41.75 |
24.15 |
27.65 |
|
Padanggalak |
870,463.98 |
116.84 |
61.28 |
27.43 |
40.58 |
|
Poh Manis |
142,686.72 |
107.06 |
54.73 |
25.13 |
36.24 |
|
Saba |
334,088.69 |
115.26 |
57.39 |
27.06 |
38.01 |
|
Taman |
124,595.65 |
79.30 |
56.39 |
18.62 |
37.34 |
|
Temaga |
554,452.72 |
107.76 |
53.15 |
25.30 |
35.19 |
|
Umadesa |
47,002.70 |
110.53 |
39.96 |
25.95 |
26.46 |
|
Umalayu |
23,881.08 |
107.98 |
27.34 |
25.35 |
18.10 |
|
Yang Batu |
44,334.61 |
67.62 |
31.39 |
15.87 |
20.79 |
This study demonstrates that terrain-based flood susceptibility represents a considerable potential threat to subak agricultural systems in East Denpasar District, affecting both agricultural land and irrigation infrastructure. The TWI-based assessment identified 68.82 ha (12.56%) of the total subak agricultural area within the high susceptibility category and 71.44 ha (13.04%) within the moderate category. Similarly, approximately 10,641.14 m (13.62%) and 16,655.28 m (21.31%) of the irrigation network were located within the high and moderate susceptibility categories, respectively. These results indicate that terrain-based flood susceptibility is spatially heterogeneous across the subak systems, with some areas containing substantial agricultural and irrigation assets potentially exposed to greater water accumulation.
The economic assessment estimated potential agricultural production exposure of USD 59,751.60 within the high and moderate susceptibility categories. For irrigation infrastructure, the estimated potential economic exposure was approximately USD 4.27 million, based on the adopted full-rehabilitation unit cost of USD 151.01 m⁻¹. Accordingly, the combined potential economic exposure of agricultural production and irrigation infrastructure was approximately USD 4.33 million under the selected susceptibility and cost assumptions. The dominant contribution of irrigation infrastructure highlights the substantial economic value of physical irrigation assets supporting subak-based agricultural production.
The economic estimates represent a one-time potential exposure under the selected scenario rather than an observed or annual expected flood loss. The irrigation valuation should specifically be interpreted as an upper-bound reconstruction exposure, assuming that exposed irrigation segments would require full rehabilitation at the adopted reference unit cost. Similarly, the agricultural estimate represents the production cost associated with agricultural areas within the high and moderate susceptibility categories and does not imply complete crop failure or a specific damage probability. These distinctions are important because the study does not incorporate flood probability, return periods, inundation duration, flood depth, or the probability and severity of actual infrastructure damage.
From an agribusiness perspective, the findings demonstrate that terrain-based flood susceptibility has implications beyond agricultural production alone, as potential exposure also encompasses irrigation infrastructure that supports water distribution and the continuity of farming activities. The integration of GIS-based susceptibility assessment and economic valuation provides a spatially explicit framework for identifying areas where agricultural and irrigation assets coincide with higher terrain-based susceptibility. Subak Buaji, Padanggalak, and Temaga emerge as important areas for flood management consideration because of their substantial exposed agricultural and irrigation assets, although their absolute exposure is also influenced by the overall extent of their land and irrigation networks. Priority interventions should therefore consider both the magnitude of potential exposure and the proportion of agricultural and irrigation assets located within high and moderate susceptibility categories.
This study has several limitations. The assessment is primarily based on the TWI and therefore does not incorporate flood depth, inundation duration, flow velocity, or hydrodynamic processes. Although a basic spatial consistency check using documented flood occurrence was undertaken, the TWI classification represents relative terrain-based susceptibility rather than a probabilistic flood model. In addition, the economic assessment does not incorporate flood recurrence, return periods, crop-stage-specific damage, structural damage probabilities, or indirect socioeconomic impacts. The irrigation valuation is based on a standardized rehabilitation cost derived from a reference project and therefore may differ from actual partial repair costs following individual flood events. Future research should integrate hydrodynamic modeling, observed flood-depth and duration data, damage ratios, flood-frequency analysis, climate change scenarios, and broader socioeconomic impacts to develop more refined estimates of flood-related economic risk to subak agricultural systems.
This research was financially supported by DIPA PNBP Universitas Udayana Fiscal Year 2025 through the Research Implementation Assignment Agreement No. B/229.330/UN14.4.A/PT.01.03/2025. The authors would also like to thank all institutions and respondents who contributed to this study.
[1] Handayani, W., Chigbu, U.E., Rudiarto, I., Putri, I.H.S. (2020). Urbanization and increasing flood risk in the northern coast of Central Java—Indonesia: An assessment towards better land use policy and flood management. Land, 9(10): 343. https://doi.org/10.3390/land9100343
[2] Yan, S.F., Xu, H.B., Fang, Y.K., et al. (2024). The characteristics and traceability analysis of the overflow pollution during the flood season in an urban area. Water, 16(22): 3159. https://doi.org/10.3390/w16223159
[3] Yousuf, A., Romshoo, S.A. (2022). Impact of land system changes and extreme precipitation on peak flood discharge and sediment yield in the upper Jhelum Basin, Kashmir Himalaya. Sustainability, 14(20): 13602. https://doi.org/10.3390/su142013602
[4] Kegel, J.F., MacAfee, E., de Jong, E. (2025). Desensitised flood risk perception to extensive disasters in a marginalised urban kampong in Indonesia. Environmental Hazards, 24(1): 91-112. https://doi.org/10.1080/17477891.2024.2343404
[5] Aeni, P., Anwar, M.K. (2024). Hydrometeorological disaster: Challenges and mitigation in Indonesia. Jurnal Indonesia Sosial Teknologi, 5(1): 318-330. https://doi.org/10.59141/jist.v5i01.888
[6] Mthembu, B.E., Cele, T., Mkhize, X. (2025). Climate change impacts on agricultural infrastructure and resources: Insights from communal land farming systems. Land, 14(6): 1150. https://doi.org/10.3390/land14061150
[7] Zen, I.S., Surata, S.P.K., Titisari, P.W., Ab Rahman, S.A., Zen, S. (2024). Sustaining subak, the Balinese traditional ecological knowledge in the contemporary context of Bali. IOP Conference Series: Earth and Environmental Science, 1306(1): 012034. https://doi.org/10.1088/1755-1315/1306/1/012034
[8] Ardana, P.D.H., Suparwata, D.O., Sudrajat, A., Chatun, S., Harsono, I. (2024). The role of Bali's traditional subak farming system in the preservation of natural and cultural resources. West Science Nature and Technology, 2(1): 31-38. https://doi.org/10.58812/wsnt.v2i04.754
[9] Shrestha, S., Dahal, D., Poudel, B., Banjara, M., Kalra, A. (2025). Flood susceptibility analysis with integrated geographic information system and analytical hierarchy process: A multi-criteria framework for risk assessment and mitigation. Water, 17(7): 937. https://doi.org/10.3390/w17070937
[10] Dong, J., Liang, X.W., Du, B.L., Ju, Y.F., Wang, Y.N., Guo, H.B. (2025). Applications of geographic information systems in ecological impact assessment: A methods landscape, practical bottlenecks, and future pathways. Sustainability, 17(22): 10358. https://doi.org/10.3390/su172210358
[11] Daud, M., Ugliotti, F.M., Osello, A. (2024). Comprehensive analysis of the use of Web-GIS for natural hazard management: A systematic review. Sustainability, 16(10): 4238. https://doi.org/10.3390/su16104238
[12] Winzeler, H.E., Owens, P.R., Read, Q.D., Libohova, Z., Ashworth, A., Sauer, T. (2022). Topographic wetness index as a proxy for soil moisture in a hillslope catena: Flow algorithms and map generalization. Land, 11(11): 2018. https://doi.org/10.3390/land11112018
[13] Meles, M.B., Younger, S.E., Jackson, C.R., Du, E., Drover, D. (2020). Wetness index based on landscape position and topography (WILT): Modifying TWI to reflect landscape position. Journal of Environmental Management, 255: 109863. https://doi.org/10.1016/j.jenvman.2019.109863
[14] Kusmiyarti, T.B., Wiguna, P.P.K., Dewi, N.K.R.R. (2018). Flood risk analysis in Denpasar City, Bali, Indonesia. IOP Conference Series: Earth and Environmental Science, 123(1): 012012. https://doi.org/10.1088/1755-1315/123/1/012012
[15] Namugenyi, B., Abdelmoneim, H., Abdelbaki, C., et al. (2026). Flood hazard and risk assessment in the Mpanga River catchment using integrated hydrological modeling and decision support tools. GeoHazards, 7(2): 54. https://doi.org/10.3390/geohazards7020054
[16] Aribisala, O.D., Yum, S.G., Adhikari, M.D., Song, M.S. (2022). Flood damage assessment: A review of microscale methodologies for residential buildings. Sustainability, 14(21): 13817. https://doi.org/10.3390/su142113817
[17] Das, M., Chattopadhayay, A., Basu, R. (2017). Flood hazard and damage assessment in former Jalpaiguri district of West Bengal, India. International Journal of Experimental Research and Review, 11: 43-51. https://qtanalytics.in/journals/index.php/IJERR/article/view/1286.
[18] Roy, S., Bose, A., Chowdhury, I.R. (2021). Flood risk assessment using geospatial data and multi-criteria decision approach: A study from historically active flood-prone region of Himalayan foothill, India. Arabian Journal of Geosciences, 14: 999. https://doi.org/10.1007/s12517-021-07324-8
[19] Darmawan, D.P., Arisena, G.M.K., Djelantik, A.A.A.W.S., Krisnandika, A.A.K., Utari, N.K.S. Korri, N.T.L. (2023). Farmers’ independence level in the urban area of Subak Sembung Denpasar City, Bali Province, Indonesia. Journal of Agricultural Sciences – Sri Lanka, 18(1): 40-54. https://doi.org/10.4038/jas.v18i1.10097
[20] Trigunasih, N.M., Wiguna, P.P.K. (2022). Identification of soil fertility status of Subak rice fields based on soil chemical properties in Denpasar city, Bali, Indonesia. African Journal of Food, Agriculture, Nutrition and Development, 22(10): 21807-21824. http://doi.org/10.18697/ajfand.115.20880
[21] Suamba, I.K., Tika, I.W., Sumiyati, et al. (2024). Evaluation of erosion rates as indicators of ecosystem services in Bali's Subak rice fields: Insights from Tabanan Regency, Indonesia. International Journal of Design & Nature and Ecodynamics, 19(3): 831-839. https://doi.org/10.18280/ijdne.190313
[22] Central Bureau of Statistics of Denpasar City. (2025). Denpasar City in Figures 2025. Denpasar: Denpasar City Central Bureau of Statistics. https://denpasarkota.bps.go.id/id/publication/2025/02/28/a743ae15cbf31f6b287a264a/kota-denpasar-dalam-angka-2025.html.
[23] Oktapia, H.M., Romdhon, M.M., Windirah, N., Suryana, A.T. (2025). Analysis of the contribution of time, income, and family labor costs in oil palm and rice farming in Pino Raya Subdistrict. Tarjih: Agribusiness Development Journal, 5(1): 1-11. https://doi.org/10.47030/tadj.v5i01.909
[24] Canaj, K., Parente, A., D'Imperio, M., et al. (2022). Can precise irrigation support the sustainability of protected cultivation? A life-cycle assessment and life-cycle cost analysis. Water, 14(1): 6. https://doi.org/10.3390/w14010006