Alamsyah M. Juwono* | Adi Susilo | Faridha Aprilia | Arosi Suhartono | Mohammad Habibiy Idmi | Abdul Khodir Jaelani | Rahmat Faizal | Didik Yudianto | Muhammad Fathur Rouf Hasan
© 2026 The authors. This article is published by IIETA and is licensed under the CC BY 4.0 license (http://creativecommons.org/licenses/by/4.0/).
OPEN ACCESS
The study area is a karst zone with hilly terrain, where water availability is often limited, especially during the dry season. This condition presents a particular challenge because the research site is a relatively thick karst area. This study aims to map subsurface groundwater pathways by integrating the Audio-Frequency Domain Magnetotelluric (ADMT) method with Global Gravity Model Plus (GGMPlus) data to mitigate drought in karst areas. A total of 47 ADMT measurement points and 40 GGMPlus measurement points were distributed throughout the study area. The results include a 2D groundwater flow map that was enhanced into a 3D model to provide a more detailed understanding of aquifer distribution patterns. The ADMT method identified a deep aquifer at a depth of 70-100 meters. This indication was supported by the GGMPlus analysis, which showed spatially concentrated flow patterns within the conduit system. Low-density values of -0.2 to -0.4 g/cm3 are interpreted as dissolution cavities and active conduits that function as a subsurface aquifer system. The main finding was obtained by comparing the conceptual cavity model derived from GGMPlus data with the resistivity distribution from 3D ADMT modeling, which intersect. However, it should be noted that the results of this research are a geophysical interpretation; to prove the existence of groundwater, drilling is necessary. Further research is required to identify the chemical compounds and minerals to verify that the water quality meets applicable health standards.
Audio-Frequency Domain Magnetotelluric, Global Gravity Model Plus, groundwater, karst area, Southern Malang
Clean water availability remains a persistent problem in communities, especially during the dry season. Water is a basic requirement for all living organisms in daily life [1, 2], including domestic, industrial, and irrigation needs [3]. In addition, the demand for a clean water supply increases as the population grows. Sumberbening Village, located in Southern Malang Regency, has a population of approximately 6317 people occupying an area of around 2,638 ha [4]. The village is located in a karst zone with hilly terrain, where water availability is often limited, especially during the dry season. This condition presents a specific challenge because the research site is a relatively thick karst area with hilly topography. One solution to address water shortages is the construction of bore wells. However, bore well construction requires high costs, so the drilling point must be accurately targeted. This condition is risky because the study area is hilly karst terrain with a relatively thick limestone layer. Therefore, preliminary identification is needed to determine the position of subsurface groundwater pathways to address this problem [5].
Various methods have been widely used to identify groundwater sources in karst areas, as reported in previous studies [6-12]. Generally, groundwater investigations focus on determining points that can be explored as groundwater extraction sites. This step requires each area that needs groundwater to conduct a preliminary investigation to determine exploration targets. This can make exploration costly and time-consuming. This less practical exploration approach can be addressed by mapping groundwater pathways in the area and then marking the locations of strategically important points. As a result, drilling locations can be determined more easily and quickly [13].
The Audio-Frequency Domain Magnetotelluric (ADMT) method can rapidly and accurately identify groundwater accumulation zones and flow paths. The non-invasive operating principle of ADMT makes this instrument suitable for surveys in difficult-to-access areas, where borehole surveys are not feasible [14]. As a complementary dataset, this study used Global Gravity Model Plus (GGMPlus) data. The gravity method can measure gravity anomalies caused by differences in subsurface rock density [15, 16]. Therefore, anomalies such as cavities that act as groundwater flow pathways can be detected more easily. The integration of two or more methods in a single study can provide more accurate data for mapping aquifer potential [17]. This combination of methods has never been applied at the research site, and its use by other researchers remains very limited.
This study aims to map subsurface groundwater pathways by integrating the ADMT method with GGMPlus data to mitigate drought in the karst area of Southern Malang. This study offers a cheaper, faster alternative to groundwater exploration by developing a groundwater flow map around Sumberbening Village. Groundwater flow will be mapped to identify the points it passes through. Points along the groundwater flow paths that are considered strategically located for exploration will be marked, including their locations and depths. The results of this study are expected to contribute as a reference for borewell construction [18], a recommendation that the local government highly needs. Bore wells can be constructed using this pathway map, enabling more practical, quicker, and cost-effective construction without the need for an additional preliminary survey. In addition, the results of groundwater research mapping will be a preliminary geophysical guide for drilling verification in the next process [19].
2.1 Geological conditions
Southern Malang Regency is part of the Southern Mountain range of Java Island, Indonesia, which is dominated by karst rocks. Geologically, karst areas are dynamic and highly complex. Such zones are dominated by limestone, dolomite, and gypsum, which are relatively soluble in water and therefore can undergo weathering relatively easily [20]. This leads to the formation of geological features such as faults, sinkholes, cavities, and subsurface rivers. Eventually, these cavities and fractures serve as water storage media [21], forming subsurface flow systems. As a result, the surface of karst areas may appear dry, although they may store groundwater reserves at certain depths.
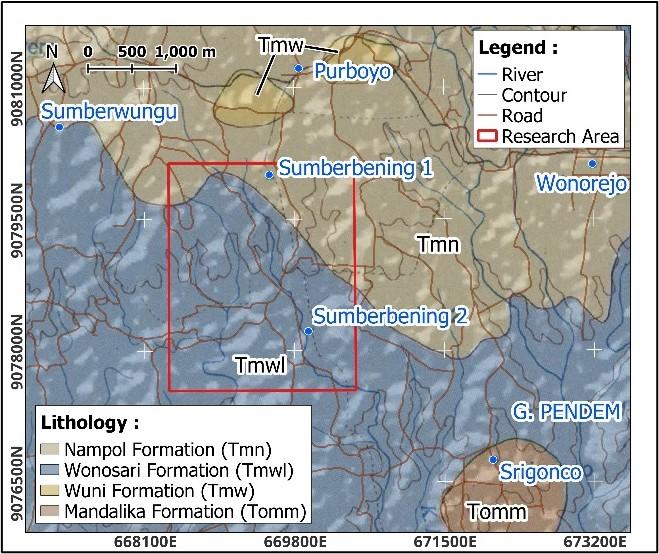
Figure 1. Geological map of the study area [22]
The research site is located in Sumberbening Village, Bantur District, Malang Regency, East Java Province, covering an area of approximately 2 km × 2.7 km. Based on the Turen geological map sheet (Figure 1), the study area belongs to the Wonosari Formation (Tmwl) and Nampol Formation (Tmn) [22]. The Wonosari Formation belongs to sedimentary rock unit composed of limestone, sandy marl, and claystone intercalations. While the Nampol Formation consists of tuffaceous or calcareous sandstone, black claystone, and sandy marl [23]. This combination of carbonate lithology and fine clastic material significantly influences the hydrogeological characteristics of the area, particularly by controlling porosity, permeability, groundwater storage mechanisms, and subsurface groundwater movement patterns within the karst aquifer system and valley deposits. Geomorphologically, the study area is dominated by hills and valleys, with relatively complex topography. Hilly zones generally develop on carbonate rocks that have undergone karstification, characterized by intensive limestone dissolution that produces fractures, cavities, and underground channels that serve as groundwater conduits. Meanwhile, the valley areas tend to be filled with deposits derived from weathering and the transport of sediment from higher areas.
2.2 Audio-Frequency Domain Magnetotelluric method
ADMT can provide high-resolution imaging of conductivity variations at different depths, enabling detailed analysis of complex subsurface structures [24]. ADMT can demonstrate strong performance for imaging electrical resistivity in near-surface aquifer systems by exploiting natural electromagnetic noise over a bandwidth of 1 Hz to 10 kHz. Because sand or soil saturated with groundwater can conduct electricity much better than dry sand or soil, ADMT surveys can produce continuous resistivity-depth profiles that correlate directly with water content.
Table 1. The parameters of Audio-Frequency Domain Magnetotelluric (ADMT)-3HT3 [25]
|
Parameter |
Specification ADMT 3HT3 |
|
Max Depth |
300 m |
|
Scan Interval |
5/10/20 m |
|
Battery |
7.4 V, 2600 mAh lithium (~140 mA) |
|
MN Electrode |
4 × L-shaped alloy (100 × 95 × 30 mm) |
|
TT Coil |
450 mm/8 mm (length/diameter) |
|
TT Iron Core |
100 (KmH/m) |
|
Freq. Range |
1-8 kHz |
|
Sensing Mode |
MN/TT |
|
Discrim |
0.01 mV±1% |
|
Acq. Time |
14-420 s |
Data acquisition utilized the ADMT-3HT3 instrument, operating within a frequency range of 1-8000 Hz. The measurement duration was maintained at 420s per point to ensure stable signal-to-noise ratios. Before inversion modeling, rigorous data-quality control was executed to remove statistical outliers caused by cultural noise. The data processing was conducted using the instrument's proprietary software, which utilizes a fast 1D pseudo-inversion (Bostick transformation) to convert frequency data directly into apparent resistivity-depth profiles. Because this algorithm relies on direct depth-transformation rather than iterative 2D forward modeling, a traditional iterative root mean square (RMS) error value is not generated. However, data-quality control was rigorously maintained during acquisition by monitoring signal stability and removing isolated outlier measurements before the contouring process. Table 1 summarizes the acquisition and processing parameters for the ADMT method.
Figure 2. Audio-Frequency Domain Magnetotelluric (ADMT) measurement survey design
A total of 48 measurement points were distributed throughout the study area (Figure 2). The measurement points were designed to account for geomorphological variations, geological conditions, and field accessibility, enabling them to capture changes in subsurface characteristics across the different landform units in the study area. These randomly distributed points were projected onto three main 2D sections (Line L1, Line L2, and Line L3) using a nearest-neighbor interpolation method with a maximum projection distance of 150 meters. In addition to the geophysical measurements, field data from an existing local production well (90 meters deep) within the study area were incorporated to provide control and ground-truth validation for the survey design. Coordinate details for ADMT data points are provided in Table 2.
Table 2. Audio-Frequency Domain Magnetotelluric (ADMT) point coordinates
|
ID |
Latitude, Longitude |
ID |
Latitude, Longitude |
|
L1.1 |
-8.331461, 112.540589 |
L2.1 |
-8.331461, 112.540589 |
|
L1.2 |
-8.331124, 112.540127 |
L2.2 |
-8.331124, 112.540127 |
|
L1.3 |
-8.330857, 112.539648 |
L2.3 |
-8.330857, 112.539648 |
|
L1.4 |
-8.330520, 112.539417 |
L2.4 |
-8.330520, 112.539417 |
|
L1.5 |
-8.330201, 112.539062 |
L2.5 |
-8.330201, 112.539062 |
|
L1.6 |
-8.329881, 112.538779 |
L2.6 |
-8.329881, 112.538779 |
|
L1.7 |
-8.329597, 112.538459 |
L2.7 |
-8.329597, 112.538459 |
|
L1.8 |
-8.329189, 112.538246 |
L2.8 |
-8.329189, 112.538246 |
|
L1.9 |
-8.328639, 112.538015 |
L2.9 |
-8.328639, 112.538015 |
|
L1.10 |
-8.328248, 112.537873 |
L2.10 |
-8.328248, 112.537873 |
|
L1.11 |
-8.327787, 112.537731 |
Ad.1 |
-8.332202, 112.535821 |
|
L1.12 |
-8.327343, 112.537536 |
Ad.2 |
-8.333186, 112.535806 |
|
L1.13 |
-8.327112, 112.537270 |
Ad.3 |
-8.333746, 112.539029 |
|
L1.14 |
-8.326651, 112.537163 |
Ad.4 |
-8.334563, 112.538711 |
|
L1.15 |
-8.325994, 112.537341 |
Ad.5 |
-8.335183, 112.537516 |
|
L3.1 |
-8.333395, 112.536894 |
Ad.6 |
-8.335062, 112.539468 |
|
L3.2 |
-8.333012, 112.538466 |
Ad.7 |
-8.334956, 112.540739 |
|
L3.3 |
-8.332840, 112.539549 |
Ad.8 |
-8.335985, 112.539922 |
|
L3.4 |
-8.331982, 112.540381 |
Ad.9 |
-8.336561, 112.540588 |
|
L3.5 |
-8.330463, 112.540698 |
Ad.10 |
-8.336545, 112.541602 |
|
L3.6 |
-8.329274, 112.541094 |
Ad.11 |
-8.335819, 112.544129 |
|
L3.7 |
-8.328138, 112.541940 |
Ad.12 |
-8.328343, 112.542480 |
|
L3.8 |
-8.326996, 112.542449 |
Ad.13 |
-8.329357, 112.542525 |
|
L3.9 |
-8.325725, 112.542192 |
Ad.14 |
-8.330446, 112.542691 |
The 2D sections allow the identification of vertical and lateral changes in resistivity values; a good 2D model can be used to identify deep or shallow objects [26]. That model can also be used to interpret the presence of water-bearing layers, fracture zones, and boundaries between lithological units. The obtained ADMT data were then processed and modeled in 3D to provide a more comprehensive representation of aquifer distribution and groundwater flow patterns. The 3D model was generated by integrating all ADMT measurement points, enabling the spatial distribution of groundwater to be displayed within a broader subsurface volume. This approach provides advantages in understanding the relationships among geological conditions, subsurface structures, and aquifer distribution.
2.3 Global Gravity Model Plus
Global Gravity Model Plus (GGMplus) is a recent composite gravity data model with an ultra-high spatial resolution of 7.5 arc-seconds, or approximately 200 meters [27]. This sub-local spatial resolution can theoretically be developed through the integration of low-frequency satellite gravity data (such as GRACE and GOCE), the EGM2008 Earth gravity model, and modeling of the short-wavelength topographic gravity effects from Shuttle Radar Topography Mission (SRTM) data [27]. For this study, the data were acquired by downloading an anomaly-value grid through open access from the official Curtin University gravimetric data repository [28].
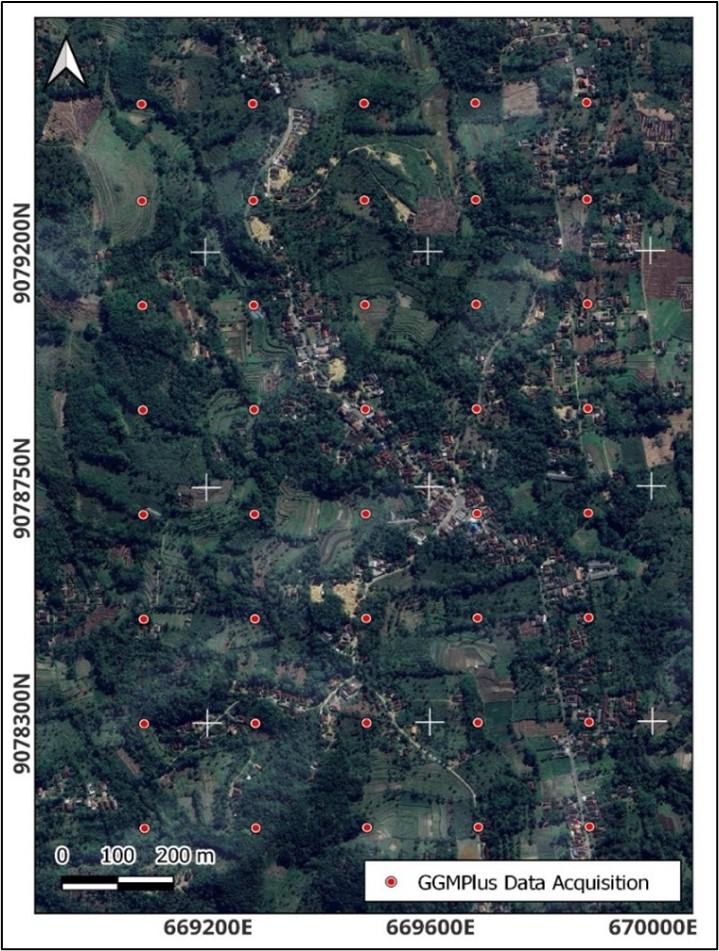
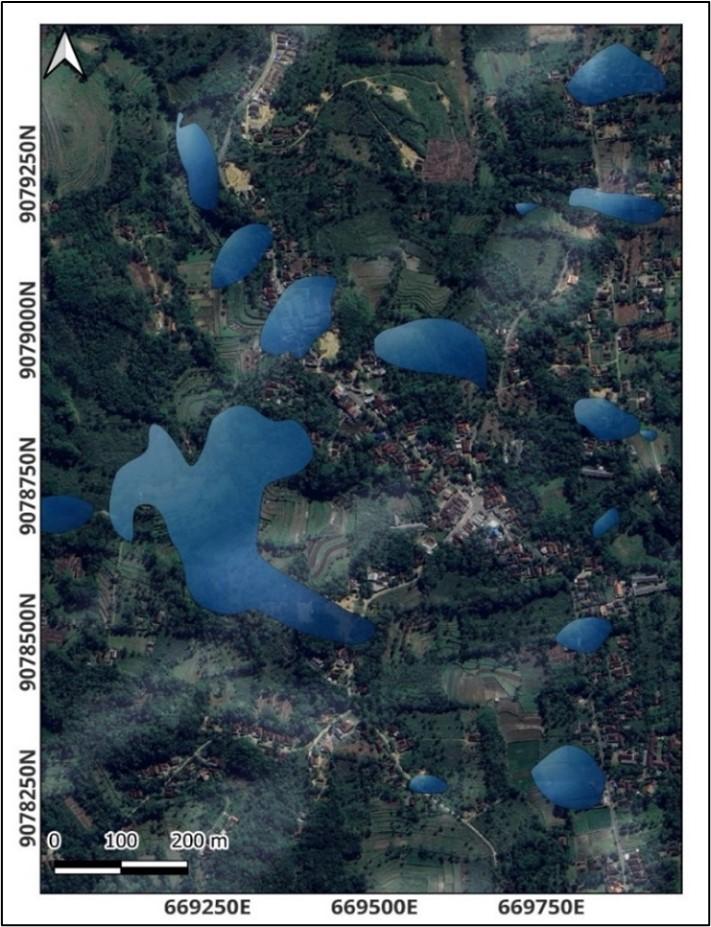
This composite method makes GGMplus data highly sensitive to the detection of regional anomalies [28]. In this integrated research framework, the GGMPlus satellite data functions strictly as a preliminary survey or reconnaissance tool. Due to its 200 m spatial resolution, it is utilized to delineate broad, macroscopic low-density zones that indicate regional intensive secondary porosity or local faults that act as main controls on underground river systems. The result of this regional gravity assessment is then used to guide the higher-resolution ADMT measurements for detailed, localized aquifer targeting. In addition, this satellite-based method does not require large-scale topographic land surveys in karst areas that are notoriously difficult to access [29]. The GGMPlus data used in this study consisted of 40 points spaced 200 meters apart, as shown in Figure 3.
Figure 3. Global Gravity Model Plus (GGMplus) survey design
In the data processing stage, the output obtained from the GGMPlus repository was still in the form of Free Air Anomaly (FAA) values [27]. To accurately interpret the karst aquifer system, these anomaly values were transformed into observed surface gravity values (Gobs) by extracting topographic elevation from a high-resolution 8 m Digital Elevation Model Nasional (DEMNAS). The theoretical gravity (Gtheo) was then applied based on latitude and station elevation correction [28]. The next step was to calculate the Complete Bouguer Anomaly (CBA) by applying Bouguer correction and terrain correction (using a terrain-correction radius of 5 km and a standard reduction density of 2.50 g/cm³, which is essential because karst morphology generally has rough and undulating topography [28].
The processed CBA data were then deconvolved with a Butterworth filter to focus on the target aquifer system and to remove basement-rock effects. A Butterworth pass-band filter (order 8, cutoff wavelength of 560 m) was selected because it gradually blocks signals outside the frequency range without causing a ringing effect in the visualization results [30]. The CBA values were then inverted into a map using Oasis Montaj software. Further processing focused on separating the CBA anomaly into a residual anomaly to isolate target anomalies indicating potential groundwater storage zones. To present the data more effectively, 2D cross-section modeling was then performed using ZondGM2D software. Through this complete sequence of topographic correction processing, lateral density-contrast variations in the subsurface can be accurately identified, allowing massive and solid limestone matrices to be distinguished from permeable cavity zones (filled with either water or air) above them as the main object of analysis [29].
3.1 Audio-Frequency Domain Magnetotelluric processing results
The inversion of 2D sections from ADMT data along the three main acquisition lines (Lines L1, L2, and L3) fully identified conductive anomalies closely associated with water-saturated zones. In the 2D resistivity sections (Figures 4(a)-(c)), the purple color spectrum indicates very low resistivity zones, which are interpreted as water-bearing zones. Purple zones contrast with the surrounding rocks, which have high resistivity values (green-to-red color spectrum). In contrast, blue zones indicate low resistivity but are interpreted as high-moisture-content rocks due to seepage from the main aquifer. Vertical analysis of the 2D resistivity sections consistently shows two main groundwater zones (purple) at different depth intervals.
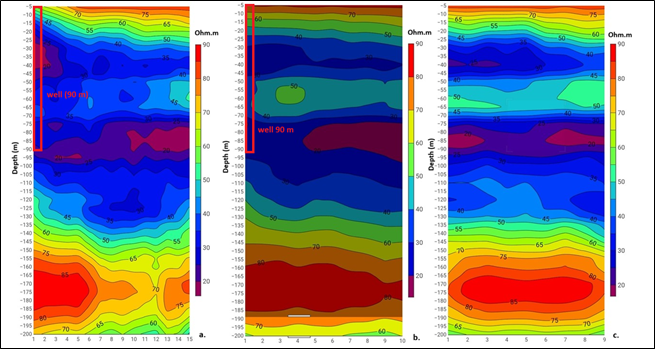
Figure 4. Audio-Frequency Domain Magnetotelluric (ADMT) sections on (a) Line 1, (b) Line 2, (c) Line 3
The first zone occurs at a depth of approximately 25-40 m and is interpreted as a shallow aquifer that is more easily recharged by rainfall and directly interacts with surface water flow systems [31]. Given the geological context of the Wonosari Formation, which comprises limestone intercalated with sandy marl and claystone, interpreting low resistivity profiles solely as groundwater requires rigorous lithological control. Claystone and highly weathered marl zones are inherently conductive and can also exhibit low resistivity signatures similar to aquifers. However, based on regional geological cross-sections, the claystone intercalations in this formation typically present as relatively horizontal, continuous aquitard layers rather than the vertically extensive and structurally localized low-resistivity bodies observed at the 70-100 m depth interval.
To validate the reliability of this geophysical interpretation, an existing local production well with a depth of 90 meters was integrated into the cross-sections as a ground-truth control. As clearly observed in the 2D resistivity profiles of Line 1 and Line 2 (Figures 4(a) and (b)), the physical location and depth of this well precisely intersect the identified deep conductive anomaly. The prominent low-resistivity signature (purple spectrum) within the 70-100 m interval perfectly encapsulates the productive depth of the 90-meter well. This direct physical correlation provides robust evidence that the deep conductive zones detected by the ADMT method are indeed active, water-saturated karst conduits, significantly increasing the confidence level of the overall spatial aquifer mapping.
Furthermore, the primary lithological control used to distinguish these potential water-bearing karst conduits from conductive clay layers is the integration with the regional gravity data. While argillaceous (clay-rich) intercalations cause low electrical resistivity, they do not produce the pronounced mass deficiencies (negative density contrasts of -0.2 to -0.4 g/cm³) that characterize macroscopic karst voids. Therefore, the spatial coincidence of both anomalously low resistivity and distinct mass deficiency strongly restricts the interpretation to water-filled dissolution cavities rather than purely lithological clay responses.
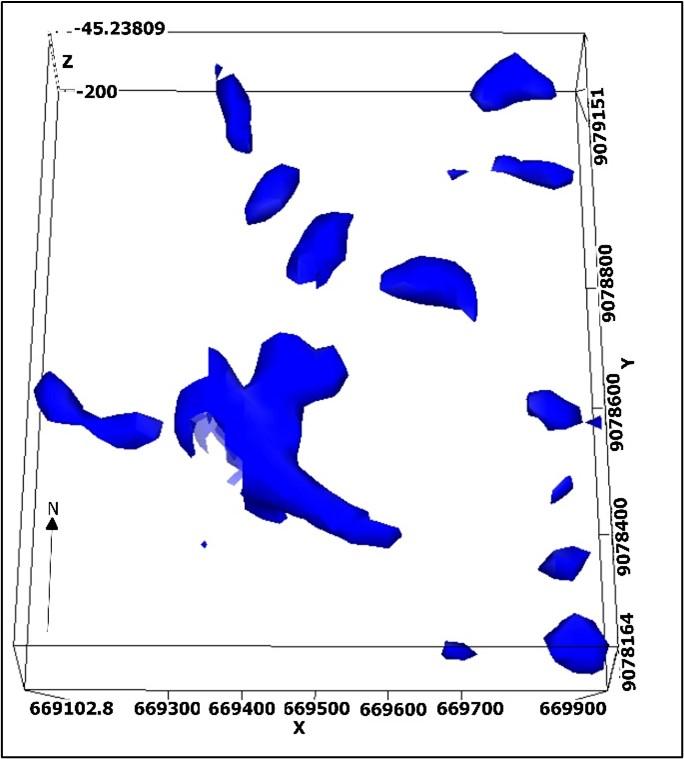
Figure 5. 3D aquifer model
In principle, the 2D sections are sufficient to describe the vertical rock conditions along a measurement line. However, these sections are limited to the measurement cross-section plane. To better understand aquifer distribution patterns, including relationships among water-bearing zones and the directions of their distribution across the study area, 3D interpolation modeling was conducted. The spatial visualization of the 3D model is shown in Figure 5. This conceptual visualization applies a specific threshold of <30 Ω⋅m to extract the volumetric extent of potential aquifer anomaly zones. The model was computed using minimum curvature with a grid size of 51 and a vertical resolution of 5 m, maintaining a documented uncertainty of 2.8%. The use of this 3D model (hydrogeophysics) can help visualize subsurface conditions volumetrically, allowing groundwater distribution to be interpreted more completely and more representatively under heterogeneous hydrogeological conditions [32].
Figure 5 shows that groundwater distribution in the study area is not homogeneous or evenly distributed throughout the subsurface. In limestone, long-term karstification has produced extensive networks of conduits, cavities, and subsurface pathways. As a result, water entering through infiltration tends to become concentrated and flow through these conduit networks, forming concentrated flow patterns. This demonstrates that the hydrogeological system in the study area is dominantly controlled by a conduit-type aquifer, characterized by rapid flow, high heterogeneity, and spatially uneven capacity distribution [33]. Therefore, 3D modeling is highly important for identifying connectivity among pathways in the subsurface groundwater flow system and for determining potential zones with groundwater storage capacity.
3.2 Global Gravity Model Plus gravity processing results
The initial stage of GGMplus satellite data interpretation was conducted on the CBA map. The CBA represents lateral variations in subsurface density contrast, obtained after correcting the FAA for topographic elevation effects (DEM), theoretical gravity, Bouguer correction, and terrain correction [28]. The anomaly values distributed globally in Figure 6 vary from 180.0 mGal to 196.3 mGal. High anomaly spectra represented by red to magenta colors (192.0 – 196.3 mGal) dominate the northern and northwestern parts of the area, whereas low anomalies represented by blue colors (180.0 – 186.0 mGal) are concentrated in the southern part of the area. The CBA distribution is the cumulative response of all subsurface rock masses, from deep structures to shallow formations.
Figure 6. Complete Bouguer Anomaly (CBA) map
Figure 7. Residual anomaly map
The processed CBA data were then deconvolved with a Butterworth filter to focus on the target aquifer system and to remove basement-rock effects. The deconvolution result is shown in Figure 7. The residual anomaly map shows shallow structural effects with a narrower value range of -1.6 to 1.5 mGal. On the residual map, blue areas (negative anomalies), ranging from -1.6 to -0.5 mGal, indicate mass deficiency or low density. While these zones may represent structural voids or dissolution fractures filled with fluid, it must be acknowledged that such negative anomalies can also result from localized low-density valley sediments, highly weathered limestone zones, or constraints inherent to the applied regional-residual separation process. Therefore, to avoid over-interpretation without direct drilling evidence, these mass-deficiency zones are more accurately categorized as possible low-density karst features rather than specific active conduits. Conversely, areas with red to magenta spectra (positive anomalies) in the range of 0.5 to 1.5 mGal in Figure 6 represent massive, compact limestone that has not undergone karstification [29].
4.1 Characterization of the karst conduit system through density contrast
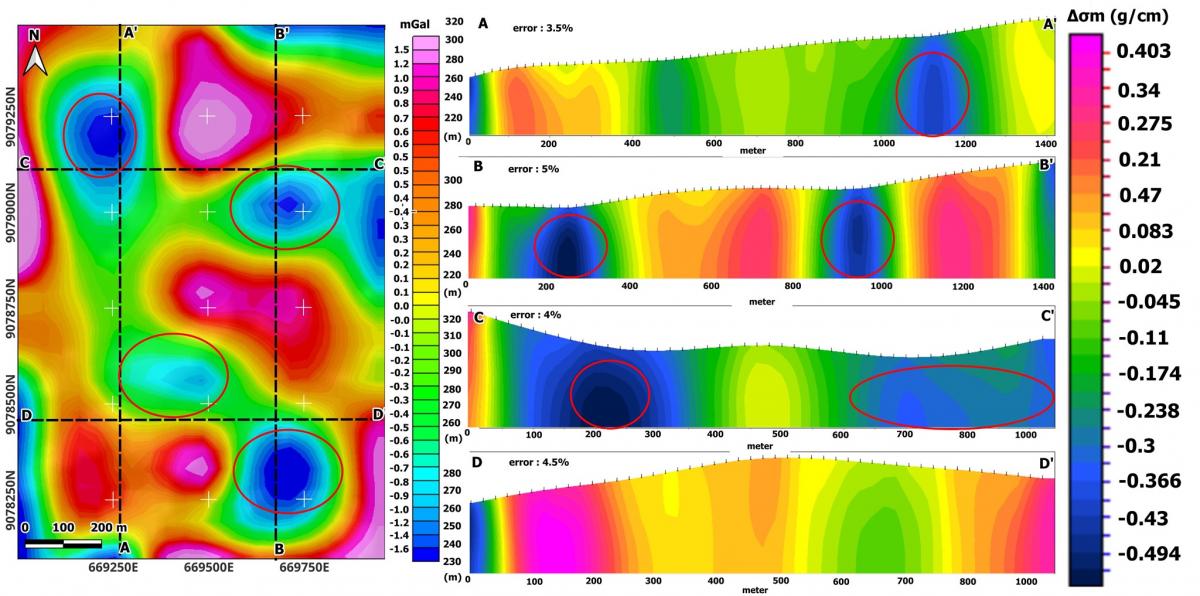
Validation of the spatial dimensions and depth of dissolution zones was carried out using the 2-D inversion method on cross-section lines with ZondGM2D software. The cross-section model of the residual anomaly is generally shown in Figure 8. The model is presented as a 2-D vertical density-contrast section along four explicitly marked cross-section lines: A-A' and B-B' (South-North orientation), as well as C-C' and D-D' (West-East orientation), with a maximum observable depth of 80-85 meters below the ground surface (indicated by the depth scale in meters on the y-axis of each section). The inversion incorporated structural constraints based on smoothness criteria and depth weighting, achieving specific fitting errors ranging from 3.5% to 5% for the profiles. ZondGM2D software iteratively simulates the density distribution so that the surface observation data (residual anomaly) approaches the theoretically calculated anomaly curve. In the inversion process, the color range in the vertical section represents the density contrast of the rocks. The darker the blue color, the greater the negative density contrast, with values between -0.2 and -0.4 g/cm³.
Figure 8. Residual anomaly cross-section
It is important to acknowledge that its 200 m spatial resolution limits the ability to map small-scale individual karst conduits or localized dissolution voids directly. Therefore, this mass-deficiency zone is not interpreted as specific, isolated active conduits, but rather as macroscopic low-density karst features or bulk dissolution zones that function as a subsurface aquifer system [34]. The zones interpreted as potential macroscopic aquifers are marked by the red circles in Figure 8. In this study, these zones are defined as broader areas of low density, indicative of heavily dissolved limestone rather than distinct physical cavities. The pink-to-yellow colors indicate positive density anomalies, with values of 0.1 to 0.4 g/cm³, which are interpreted as massive, solid limestone matrices that have not undergone extensive dissolution. This integrative modeling result (Figure 8) shows that GGMPlus satellite data are sufficiently representative for mapping limestone dissolution zones and subsurface aquifer potential in a karst system [29].
4.2 Aquifer system heterogeneity
The most important finding was obtained by comparing the conceptual cavity model derived from GGMPlus data with the resistivity distribution from 3D ADMT modeling. The overlay of the 3D aquifer distribution model and Google Earth satellite imagery is shown in Figure 9. This overlay map clearly displays the spatial extent of the target aquifer system relative to the surface conditions in Sumberbening Village. This correlation provides a basic understanding of the hydrogeological conditions in Sumberbening Village. Groundwater conditions in this area cannot be assumed to be uniformly distributed, as in typical porous rock aquifers. Instead, karstification of the limestone formation over thousands of years has produced scattered and disconnected macroscopic dissolution pathways. Water entering the subsurface infiltrates and flows into these heterogeneous passages. This is highly consistent with a conduit-type aquifer system, which is characterized by very rapid, dynamic, and spatially nonuniform fluid flow [33]. Therefore, the overlay map in Figure 9 helps provide an understanding of subsurface connectivity associated with linear features and supports the determination of potential groundwater storage locations in this area.
Figure 9. Aquifer model and google earth overlay
The highly heterogeneous spatial macroscopic dissolution characteristics, as comprehensively visualized in the overlay map of the 3D model and satellite imagery (Figure 9), emphasize the advantage of the integrated approach proposed in this study. In hydrogeophysical studies in areas with karst morphology, Abir et al. [35] and Jacob et al. [36] concluded that conventional exploration using Electrical Resistivity Tomography (ERT) and land microgravity surveys is highly limited due to narrow area coverage, high cost, and access constraints in hilly and extreme terrain. In contrast, the use of GGMPlus data in this study required only a day for data acquisition and processing. Furthermore, the data were obtained at no cost, as GGMPlus provides open-access data. Although the accuracy of satellite data is not equivalent to direct field measurements, we use the ADMT method to validate the GGMPlus results.
As an efficient alternative, this study demonstrates that GGMPlus satellite data can be used for preliminary screening, and ADMT for field-scale follow-up. The very low residual anomaly values from GGMPlus (-0.2 to -0.4 g/cm3) show connectivity with the aquifer model generated from ADMT. The combination of these two methods can more efficiently visualize heterogeneous groundwater spatial domains.
4.3 Strategic drilling recommendations
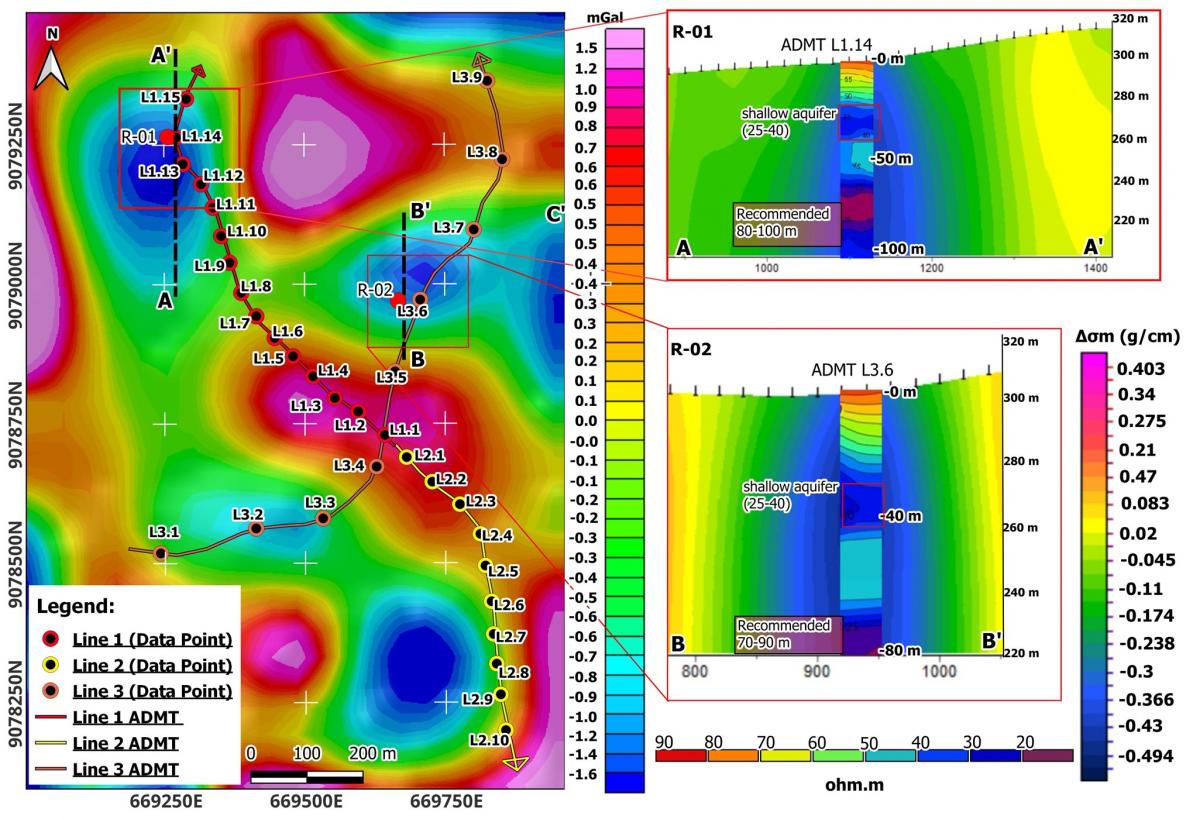
Fulfilling the primary objective of this hydrogeophysical investigation, the integration of ADMT and GGMPlus data facilitates the delineation of strategic bore-well targets. While the ADMT pseudo-sections indicate broad potential aquifer zones at depths of 25–40 m for shallow aquifer and 70–100 m for recommended aquifer with details as in Figure 10, identifying optimal drilling points requires spatial convergence with the macroscopic dissolution zones derived from the residual gravity anomalies.
To explicitly demonstrate this spatial convergence, the 2D ADMT measurement lines were directly overlaid onto the GGMPlus residual anomaly map, as illustrated in Figure 10. This integrated visualization reveals that the very low residual anomaly values from GGMPlus (-0.2 to -0.4 g/cm³) spatially intersect with the deep low-resistivity zones identified by ADMT. This combination precisely pinpoints the optimal locations where massive secondary porosity coincides with high fluid saturation.
Figure 10. Audio-Frequency Domain Magnetotelluric (ADMT) and gravity Global Gravity Model Plus (GGMPlus) overlay
Table 3. Outlines recommended drilling locations
|
Point |
Coordinates |
Depth (m) |
ADMT Evidence |
GGM Plus Evidence |
|
R-01 |
669263.33 E 9079266.13 S |
80-100 |
Distinct low resistivity anomaly (<20 Ω⋅m) |
Located near the center of a (-0.3 g/cm) – (-0.4 g/cm) mass-deficiency zone |
|
R-02 |
669681.3 E 9078967.6 S |
70-90 |
Distinct low resistivity anomaly (<30 Ω⋅m) |
Located near the center of a (-0.3 g/cm) – (-0.4 g/cm) mass-deficiency zone |
Table 3 outlines the recommended drilling locations aimed at mitigating the clean water shortage in Sumberbening Village. These strategic points were selected based on the strongest spatial overlap between low resistivity values (indicating fluid saturation) and significant mass deficiencies (indicating high secondary porosity). Due to the inherent non-uniqueness of geophysical data and the absence of prior local well-logging for calibration, an uncertainty assessment is provided for each point. These targets represent geophysical predictions that require careful validation during the initial drilling phase.
The integration of ADMT and GGMPlus satellite gravity data has proven to be a highly effective approach for delineating groundwater potential within the complex karst terrain of Southern Malang. The 2D and 3D ADMT models successfully identified potential fluid-saturated zones, particularly highlighting a deep, active aquifer system at depths of 70–100 meters. Complementing this, the GGMPlus residual anomaly map—processed utilizing a 2.50 g/cm³ reduction density and an 8th-order Butterworth filter—effectively mapped regional mass deficiencies. Given the spatial resolution of the satellite data, these low-anomaly zones (-0.2 to -0.4 g/cm³) are robustly interpreted as macroscopic dissolution pathways rather than isolated conduits. This interpretation is corroborated by external ground-truth validation from an existing 90-meter local bore well, which confirms the presence of the deep aquifer system.
The spatial convergence of low resistivity (indicating fluid saturation) and low residual gravity anomalies (indicating massive secondary porosity) provided a precise framework for identifying strategic drilling targets. Consequently, specific locations (R-01 and R-02) have been recommended to directly address the clean water scarcity in Sumberbening Village. While this integrated hydrogeophysical approach significantly mitigates exploration risks, the inherent non-uniqueness of geophysical models necessitates that these predictions be carefully validated during the initial drilling phase. Ultimately, this study demonstrates that combining ground-based electromagnetic measurements with high-resolution satellite gravity data offers a reliable, accessible, and scientifically rigorous methodology for sustainable groundwater exploration in challenging karst environments. Based on the results, it can be concluded that integrating the ADMT method with GGMPlus data is a promising initial screening approach for mapping groundwater potential in the karst area of Sumberbening Village, Malang Regency. However, the results of this research need to be proven through drilling as the next stage in the series of searches for clean water sources.
The authors express their gratitude to the Faculty of Sciences, Technology, and Mathematics, Universitas Brawijaya, for funding this research through the Professorship Grant under contract number 06871.20/UN10.F0901/B/PT/2025.
[1] Purwanto, Hamidah, S., Rini, W.D.E. (2022). Identification of aquifer potential by geoelectric method in Gedangsari District, Gunungkidul Regency. International Journal of Sustainable Development and Planning, 17(8): 2551-2559. https://doi.org/10.18280/ijsdp.170823
[2] Hasan, M.F.R., Pradiptiya, A., Setiawan, Y., Agung, P.A.M., Susilo, A., Sunaryo. (2022). Detection of groundwater sources in Lembor village using geoelectrical resistivity method schlumberger configuration. IOP Conference Series: Earth and Environmental Science, 1116(1): 012051. https://doi.org/10.1088/1755-1315/1116/1/012051
[3] Ghafoor, A., Almutairi, H.H., Almoslem, M., et al. (2024). Assessment and modeling of the vulnerability of regional aquifers to anthropogenic perturbations. Journal of Ecological Engineering, 25(7): 398-409. https://doi.org/10.12911/22998993/189233
[4] BPS-Statistics of Malang Regency. (2025). Bantur District in figures 2025. Malang Regency: BPS-Statistics of Malang Regency.
[5] Yang, T., Yang, Z., Qin, Q., Adagunodo, T.A., Zhu, M. (2025). Simulation of the telluric electrical field frequency selection method and its application in mineral water exploration. Water, 17(22): 3314. https://doi.org/10.3390/w17223314
[6] Hasan, M.F.R., Susilo, A., Sunaryo. (2018). Identification of underground river flow pattern using self potential (SP) and resistivity methods for drought mitigation at Druju, Sumbermanjing Wetan, Indonesia. Disaster Advances, 11(5): 25-31.
[7] Pourmorad, S., Kabolizade, M., Ferreira, R., Dimuccio, L.A. (2026). Groundwater potential mapping in structurally complex karst aquifers: Comparing ANN, SVR, and ANN–SVR models in Khuzestan Province, southwestern Iran. Groundwater for Sustainable Development, 34: 101652. https://doi.org/10.1016/j.gsd.2026.101652
[8] Wang, D., Qian, J., Ma, L., Xu, H., Wang, X., Wang, Y. (2022). Integration of multiple hydrogeological survey technologies for exploring the groundwater distribution in karst areas: A case study in Xingfu Spring, Chaohu City, China. Journal of Hydrology, 614: 128637. https://doi.org/10.1016/j.jhydrol.2022.128637
[9] Martel, R., Castellazzi, P., Gloaguen, E., Trépanier, L., Garfias, J. (2018). ERT, GPR, InSAR, and tracer tests to characterize karst aquifer systems under urban areas: The case of Quebec City. Geomorphology, 310: 45-56. https://doi.org/10.1016/j.geomorph.2018.03.003
[10] Şener, A., Pekşen, E., Yolcubal, İ. (2021). Application of square array configuration and electrical resistivity tomography for characterization of the recharge area of a karst aquifer: A case study from Menekşe karst plateau (Kocaeli, Turkey). Journal of Applied Geophysics, 195: 104474. https://doi.org/10.1016/j.jappgeo.2021.104474
[11] Wahid, A., Sunaryo, Susilo, A., Wiyono. (2022). Identification of karstification zoning and aquifer channels in karst basin at Sendang Biru Beach, Malang-Indonesia: A case study. International Journal of Design & Nature and Ecodynamics, 17(3): 391-400. https://doi.org/10.18280/ijdne.170309
[12] Fu, X., Tang, Z., Lv, W., Wang, X., Yan, B. (2018). Exploitation potential of groundwater in Yangzhuang Basin, China under recharge enhancement. International Journal of Heat and Technology, 36(2): 483-493. https://doi.org/10.18280/ijht.360213
[13] Arabameri, A., Rezaei, K., Cerda, A., Lombardo, L., Rodrigo-Comino, J. (2019). GIS-based groundwater potential mapping in Shahroud plain, Iran. A comparison among statistical (bivariate and multivariate), data mining and MCDM approaches. Science of the Total Environment, 658: 160-177. https://doi.org/10.1016/j.scitotenv.2018.12.115
[14] Wu, Q., Li, Y.B., Mi, H.Z., Wang, G., Zhang, Z.Y. (2023). Simulation and observations of audio magnetotelluric measurements over water-covered areas. Minerals, 13(8): 990. https://doi.org/10.3390/min13080990
[15] Hasan, M.F.R., Susilo, A., Suryo, E.A., et al. (2024). Analysis of existence and faults impact on geological disasters using GGMPlus data. IOP Conference Series: Earth and Environmental Science, 1321(1): 012003. https://doi.org/10.1088/1755-1315/1321/1/012003
[16] Hasan, M.F.R., Susilo, A., Suryo, E.A., et al. (2024). Mapping of landslide potential in Payung, Batu City, Indonesia, using Global Gravity Model Plus (GGMplus) data as landslide mitigation. Iraqi Geological Journal, 57(1A): 159-168. https://doi.org/10.46717/igj.57.1a.13ms-2024-1-24
[17] Mohammed, A., Takele, T., Mechal, A., Jothimani, M. (2025). Geospatial and satellite gravity-based assessment of groundwater potential in the Borkena Watershed, Northern Ethiopia. Journal of Hydrology: Regional Studies, 62: 102828. https://doi.org/10.1016/j.ejrh.2025.102828
[18] Gomo, M. (2024). Exploring deeper groundwater in a dolomite aquifer using telluric electric frequency selection method geophysical approach. Groundwater for Sustainable Development, 26: 101265. https://doi.org/10.1016/j.gsd.2024.101265
[19] Hasan, M.F.R., Juwono, A.M., Susilo, A., et al. (2025). Determination of groundwater resources using geoelectrical resistivity method for drought mitigation in Bantur, Malang Regency. IOP Conference Series: Earth and Environmental Science, 1453(1): 012046. https://doi.org/10.1088/1755-1315/1453/1/012046
[20] Hartmann, A., Jasechko, S., Gleeson, T., et al. (2021). Risk of groundwater contamination widely underestimated because of fast flow into aquifers. Proceedings of the National Academy of Sciences of the USA, 118(20): e2024492118. https://doi.org/10.1073/pnas.2024492118
[21] Sun, H., Hu, T., Dai, F., et al. (2026). Characterizing the distribution and flow dynamics of shallow karst fissure-type groundwater in urban environments using multi-geophysical time-lapse monitoring combined with saline tracer tests. Journal of Hydrology, 675: 135560. https://doi.org/10.1016/j.jhydrol.2026.135560
[22] Sujanto, Hadisantono, R., Kusnama, Chaniago, R., Baharuddin, R. (1992). Geological map of the Turen Quadrangle, Java. Bandung: Geological Research and Development Centre.
[23] Susilo, A., Sunaryo, S., Sutanhaji, A.T., Fitriah, F., Hasan, M.F.R. (2017). Identification of underground river flow in Karst Area using geoelectric and self-potential methods in Druju Region, Southern Malang, Indonesia. International Journal of Applied Engineering Research, 12(21): 10731-10738.
[24] Wahyuni, S., Prayitno, G., Elhuda, I., et al. (2024). Innovative geoelectrical methods for comprehensive groundwater evaluation in East Java, Indonesia. Results in Engineering, 24: 103390. https://doi.org/10.1016/j.rineng.2024.103390
[25] Shanghai Weiqi Equipment Technology. (2021). Golden-Rod Groundwater Detector: Operation Manual. Shanghai: Weiqi Equipment Technology Co. Ltd.
[26] Susilo, A., Idmi, M.H., Hasan, M.F.R., Saragih, D.A., Suryo, E.A., Agung, P.A.M. (2023). Mapping weak soil zones using geoelectrical resistivity for bridge construction in Rokan Hulu, Indonesia. International Journal of Design & Nature and Ecodynamics, 18(5): 1103-1109. https://doi.org/10.18280/ijdne.180511
[27] Hirt, C., Claessens, S., Fecher, T., Kuhn, M., Pail, R., Rexer, M. (2013). New ultrahigh-resolution picture of Earth’s gravity field. Geophysical Research Letters, 40(16): 4279-4283. https://doi.org/10.1002/grl.50838
[28] Camacho, M., Alvarez, R. (2021). Geophysical modeling with satellite gravity data: Eigen-6C4 vs. GGM Plus. Engineering, 13(12): 690-706. https://doi.org/10.4236/eng.2021.1312050
[29] Wiguna, I.P.A.P., Rosid, M.S., Saputra, F.R.T. (2024). Comparison of land surface and GGMPlus satellite gravity data results (Case study: The Kalibening Basin). Jurnal Penelitian Pendidikan IPA, 10(8): 4579-4588. https://doi.org/10.29303/jppipa.v10i8.7318
[30] Lghoul, M., Abd-Elhamid, H.F., Zeleňáková, M., Abdelrahman, K., Fnais, M.S., Sbihi, K. (2023). Application of enhanced methods of gravity data analysis for mapping the subsurface structure of the bahira basin in Morocco. Frontiers in Earth Science, 11: 1225714. https://doi.org/10.3389/feart.2023.1225714
[31] Jasechko, S., Perrone, D., Befus, K.M., et al. (2017). Global aquifers dominated by fossil groundwaters but wells vulnerable to modern contamination. Nature Geoscience, 10(6): 425-429. https://doi.org/10.1038/ngeo2943
[32] Binley, A., Hubbard, S.S., Huisman, J.A., et al. (2015). The emergence of hydrogeophysics for improved understanding of subsurface processes over multiple scales. Water Resources Research, 51(6): 3837-3866. https://doi.org/10.1002/2015wr017016
[33] Goldscheider, N., Chen, Z., Auler, A.S., et al. (2020). Global distribution of carbonate rocks and karst water resources. Hydrogeology Journal, 28(5): 1661-1677. https://doi.org/10.1007/s10040-020-02139-5
[34] Pivetta, T., Braitenberg, C., Gabrovšek, F., Gabriel, G., Meurers, B. (2021). Gravity as a tool to improve the hydrologic mass budget in karstic areas. Hydrology and Earth System Sciences, 25(11): 6001-6021. https://doi.org/10.5194/hess-25-6001-2021
[35] Abir, I.A., Rauff, K.O., Iszar, N.I.B., Rabiu, J.A. (2025). Locating karstic void using resistivity and gravity methods in Gua Musang, Kelantan, Malaysia. Jewel Journal of Scientific Research, 10(1): 102-111.
[36] Jacob, T., Bayer, R., Chery, J., Le Moigne, N. (2010). Time-lapse microgravity surveys reveal water storage heterogeneity of a karst aquifer. Journal of Geophysical Research, 115(B6): 402. https://doi.org/10.1029/2009jb006616