Qater Al-Nada Ali Kanaem Al-Ibady
© 2026 The author. This article is published by IIETA and is licensed under the CC BY 4.0 license (http://creativecommons.org/licenses/by/4.0/).
OPEN ACCESS
Irrigation canals receiving mixed agricultural and urban runoff may accumulate contaminants that adversely affect aquatic biodiversity. This study evaluated the combined effects of microplastics and zinc (Zn)/copper (Cu) contamination on benthic macroinvertebrate communities using standardized Hester–Dendy colonization plates. Fifty plates (25 reference and 25 impacted) were deployed for 28 days. Water quality, sediment and biofilm microplastic loads, dissolved and sediment-associated Zn/Cu concentrations, and macroinvertebrate community metrics were compared using Welch’s t-tests. Hydrological characteristics did not differ significantly between reaches; however, impacted reaches had higher conductivity (801.39 vs. 405.78 µS cm⁻¹), turbidity (25.00 vs. 10.60 nephelometric turbidity units (NTU)), nitrate (3.05 vs. 0.97 mg L⁻¹), phosphate (0.29 vs. 0.11 mg L⁻¹), and lower dissolved oxygen (5.72 vs. 8.16 mg L⁻¹). Sediment microplastics increased from 133.53 to 308.11 items kg⁻¹, and biofilm-associated microplastics increased from 15.96 to 30.88 µg g⁻¹. Dissolved Zn/Cu increased from 10.87/3.10 to 30.88/13.87 µg L⁻¹, and sediment Zn/Cu increased from 54.48/19.52 to 136.56/58.09 mg kg⁻¹. Taxon richness declined from 23.87 to 14.62, Ephemeroptera-Plecoptera-Trichoptera (EPT) richness from 6.71 to 2.61, %EPT from 44.44% to 12.20%, and Average Score per Taxon (ASPT) from 6.46 to 4.04. Mixed runoff was associated with degraded water quality, increased contaminant burdens, and marked changes in macroinvertebrate taxonomic and functional structure. Standardized colonization plates provided a responsive method for detecting ecological impairment in irrigation canals.
zinc and copper contamination, sediment contamination, ecological impairment, water-quality degradation, benthic macroinvertebrates, microplastics, biotic indices
Intensely cultivated landscapes are often characterized by irrigation and drainage canals. Many of these channels are artificial or highly managed, but they may still provide ecological benefits to freshwater biodiversity and ecological connectivity when natural streams are scarce or fragmented [1, 2]. Concurrently, the agricultural return flow, peri-urban runoff, domestic inputs, and fine suspended materials are entering these canals, rendering them possible accumulation zones for complex mixtures of contaminants instead of only water-conveyance structures. Microplastics and trace metals are particularly significant in this context, as they are known to occur together in water, sediments, and biofilms. Recent freshwater studies have demonstrated the co-occurrence of microplastics and potentially toxic elements, with their distribution influenced by land use patterns, hydro-morphological characteristics, and localized discharge sources [3]. Microplastics could also function as a physical stressor and as a carrier or sorbent of metals and other contaminants, which may alter their bioavailability and biological exposure [4]. Benthic macroinvertebrates have been shown to react to the presence of microplastics by altering survival, feeding, colonization, and community composition both in the laboratory and field [5].
Benthic macroinvertebrates are widely used as a biological indicator, as their assemblage reflects the local habitat conditions and water quality and contaminant exposure over time. Proxies of ecological status and sensitivity to pollution include taxon richness, Ephemeroptera-Plecoptera-Trichoptera (EPT) richness, and percentage of EPT, the Biological Monitoring Working Party (BMWP) score, and the Average Score per Taxon (ASPT) [6]. Conventional kick-net or grab sampling, however, may be influenced by patchy small-scale habitat, variable access, and uneven substrate in engineered canals. Standardized artificial substrates, such as Hester-Dendy colonization plates, offer a controlled colonization surface and exposure time and can be used for comparisons of biological response between canal reaches [7]. Although the topic of microplastics in freshwater has gained considerable interest, there is little research that has combined data on microplastic loads with trace-metal contamination and water quality and macro-invertebrate response to colonization plates in irrigation canals. The significance of this void is that, in agricultural and peri-urban settings, water, nutrients, fine sediments, metals, and plastic particles can be delivered through the same canal, and the same canal can be utilized as a water source.
Irrigation canals are unique environments of fresh water, as they serve as both water-transportation infrastructure and as ecosystems. The artificial streams within canal communities are affected by regulated stream flow, sedimentation, agricultural drainage, and irregular pollutant discharges [1]. Therefore, standardized approaches to biological monitoring are especially important in these systems, as they enable comparison between reaches that have had different exposure histories and reduce the natural variability inherent in substrate. Hester–Dendy colonization plates provide an artificial, standardized habitat with relatively consistent surface area and exposure duration [7]. Their use enables assessment of early colonizing macroinvertebrate assemblages under comparable colonization conditions and has been applied successfully in modified freshwater environments where natural substrate availability is variable.
Therefore, this study aimed to quantify the co-occurrence of microplastic contamination and zinc (Zn)/copper (Cu) pollution in irrigation canal reaches affected by mixed agricultural and urban runoff and to evaluate the relationship between these contaminants and benthic macroinvertebrate communities colonizing standardized Hester–Dendy plates. Specifically, the study compared reference and impacted canal reaches based on physicochemical water characteristics, microplastic abundance in sediments and biofilms, dissolved and sediment-associated Zn and Cu concentrations, macroinvertebrate taxonomic and functional community structure, and biological assessment metrics, including EPT-related indices, BMWP scores, and ASPT values.
2.1 Study design and reach selection
A comparative field design was employed to evaluate the exposure to contaminants and colonization by benthic macroinvertebrates in irrigation canals. Reaches were rated as either reference or impacted following the reconnaissance of land use, visual discharge points, bank condition, sediment deposition, and surrounding agricultural and peri-urban activities. Reference reaches were located upstream of large drainage inlets and were identified as having less obvious effects of influence from the drainage and more stable riparian margins. Impacted reaches were located downstream of mixed agricultural return flow and peri-urban runoff inputs and were identified with visibly increased fine sediment deposition and turbidity. Reaches were chosen to be as similar as possible in channel characteristics, channel depth, flow velocity, and substrate texture to minimize the interpretation of biological differences in response to gross differences in channel characteristics.
2.2 Study area description
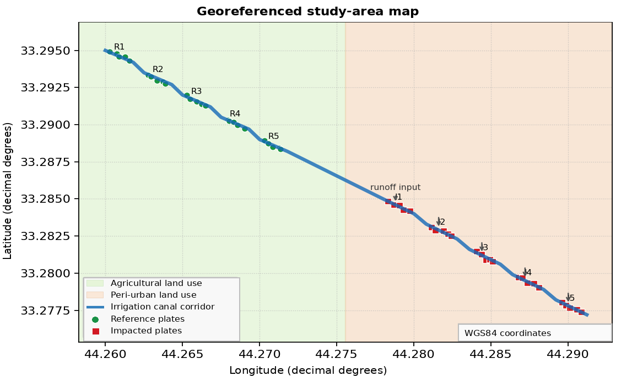
The study was conducted in an agricultural–peri-urban irrigation-canal network in central Iraq, within a WGS84 coordinate corridor of 33.277–33.295°N and 44.260–44.291°E. The spatial design comprised 10 independent canal reaches/segments: five upstream reference reaches (R1–R5) and five downstream impacted reaches (I1–I5), with five Hester–Dendy plates per reach (n = 25 plates per exposure group; n = 50 total). Reference reaches were located 0.25–2.05 km from the upstream boundary, whereas impacted reaches were located 3.30–5.50 km downstream of the main transition/runoff-entry zone. The reference-to-impacted separation ranged from approximately 1.25 to 5.25 km along the canal corridor. Agricultural-return and peri-urban drainage inlets were located approximately 40–100 m from impacted reaches and more than 800 m from reference reaches. Figure 1 presents the georeferenced study-area map, including coordinates, reference and impacted reaches, runoff inputs, plate locations, and surrounding agricultural/peri-urban land use.
Figure 1. Georeferenced study-area map showing reference and impacted irrigation-canal reaches, runoff inputs, Hester–Dendy plate locations, and surrounding agricultural and peri-urban land-use zones. Coordinates are reported in the WGS84 reference system
2.3 Colonization plates and field deployment
The experimental unit was the individual Hester–Dendy sampler. Fifty samplers were deployed for 28 days during a stable irrigation period: 25 in reference reaches, and 25 in impacted reaches. Each sampler comprised a series of hardboard plates separated by spacer blocks to provide repeated interstitial colonization surfaces. Before deployment, samplers were rinsed with deionized water, handled with powder-free gloves, labeled, and stored in clean containers. Within each reach, samplers were deployed in a blocked arrangement to minimize small-scale variation in depth, turbulence, and lateral position. Plates were suspended from permanent anchors at approximately mid-water depth, away from banks, macrophyte mats, eddy, and point inflows. At retrieval, each sampler was enclosed in a fine net to minimize loss of organisms and loose biofilm, and then transferred to a labeled container containing site water for laboratory processing. All 50 deployed samplers were recovered and retained for analysis, and comparisons were standardized by exposure group and the 28-day deployment period.
2.4 Water quality, microplastics, and trace metals
A calibrated portable multiparameter meter was used to measure in situ the temperature, pH, specific conductivity, dissolved oxygen, turbidity, and depth at each colonization site. Water-quality and hydraulic parameters were measured according to the field sampling schedule established for the colonization experiment. Measurements were conducted at deployment and retrieval of colonization plates (Day 0 and Day 28, respectively) at comparable times of day to minimize diel variation. Where repeated measurements were available, mean values across the deployment period were calculated for comparison between reference and impacted reaches. Because the study represents a single colonization period, temporal fluctuations associated with rainfall events, irrigation intensity, and seasonal changes may not be fully captured. Timed floats over a fixed distance were used to estimate the surface velocity, which was then used to calculate the approximate mean column velocity based on a consistent hydraulic coefficient, as per the typical assumptions associated with rough-bed flows [8]. The plate-associated biofilm was removed from the plates using gentle brushing and rinsing with filtered deionized water in clean stainless-steel equipment for the microplastic analysis. Surficial fine sediments were sampled within approximately 1 m of each plate, dried, homogenized, and subsampled by dry mass. A density separation was carried out using a zinc chloride solution, and then filtration was performed, and polymers were confirmed by pyrolysis-gas chromatography-mass spectrometry. Microplastics were reported as items kg⁻¹ dry sediment and µg g⁻¹ dry biofilm. The samples were filtered through 0.45-micrometer membranes and acidified using ultrapure nitric acid for the analysis of zinc and copper in the water. The fine sediments were sieved to the less than 63 micrometer fraction and subjected to microwave-assisted acid digestion. All digests, dissolved samples, and sediment were analyzed by inductively coupled plasma optical emission spectrometry, and all sediment concentrations were calculated on a dry-weight basis. Microplastic analysis followed contamination-control procedures, including procedural blanks, field blanks, and laboratory air-exposure controls. Samples were filtered on clean analytical membranes before polymer confirmation by pyrolysis-gas chromatography-mass spectrometry. For the comparative analytical framework, the microplastic workflow used a standardized protocol based on 0.45-µm filtration before polymer confirmation; therefore, the microplastic results are interpreted as comparative sediment and biofilm loads rather than a full size-resolved particle inventory. Recovery experiments were conducted using known quantities of reference polymer particles, and percentage recovery was calculated for each analytical batch. In order to identify a polymer, the pyrolysis-gas chromatography-mass spectrometry spectra had to match a reference polymer library with reasonable confidence. Where necessary, blank corrections were applied, and results were reported after the background contamination had been adjusted.
2.5 Macroinvertebrate processing and biotic indices
All samplers were disassembled in the laboratory on a clean tray and rinsed over a 500-micrometer sieve. Organisms retained and associated detritus were preserved and sorted under a stereomicroscope to the lowest possible taxonomic level, typically to the family or genus level, depending on the diagnostic characters and condition of the preserved material. To preserve sensitivity to the rare and pollution-sensitive taxa, whole samples were processed instead of subsampled. The taxon-by-sample abundance data were subsequently prepared, and total taxon richness, Shannon diversity, EPT richness, percentage EPT, BMWP, and ASPT were calculated. Two well-known family-level biotic indices of pollution-sensitive macroinvertebrate assemblages, BMWP and ASPT, were used. Based on the taxonomic data, functional feeding groups were determined and classified as relative abundance categories: scrapers, shredders, collectors, and predators.
2.6 Identification of macroinvertebrates
Macroinvertebrate identification was conducted to the lowest practicable taxonomic level, generally family level and, where diagnostic characters and preservation condition allowed, genus level, using standard freshwater macroinvertebrate keys. EPT taxa were assigned according to Ephemeroptera, Plecoptera, and Trichoptera membership. BMWP and ASPT were calculated as family-level comparative biotic indices. Because BMWP and ASPT were originally developed mainly for temperate European freshwater systems and have not been fully calibrated for Iraqi irrigation canals, their application was interpreted cautiously as a comparative indication of community response between reference and impacted reaches rather than as an absolute ecological-status classification.
2.7 Quality assurance
Quality assurance and quality control were documented in supplementary tables linked to the raw-data workbook. For microplastics, recovery tests were conducted for PE, PP, PET, PS, and PVC reference particles (n = 5 batches per polymer), together with procedural blanks, blank-correction procedures, limit of detection (LOD)/limit of quantification (LOQ) values, particle-size classes, morphology categories, and pyrolysis GC-MS library-match criteria. For metal analysis, the documented method included a 0.45-µm dissolved fraction, microwave-assisted digestion of the <63 µm sediment fraction, inductively coupled plasma optical emission spectrometry (ICP-OES) measurement, wavelength settings, detection limits, duplicate precision, and certified reference material (CRM)/spike-recovery benchmarks. All quality assurance/quality control (QA/QC) values are provided in the supplementary tables and individualized Excel sheets.
2.8 Statistical analysis
Data were entered into a validated spreadsheet containing the complete plate-level raw matrix for n = 25 plates per exposure group. To address potential pseudoreplication, the analysis incorporated 10 independent reaches/segments (five reference and five impacted), with five plates nested within each reach. Plate-level Welch t-tests were retained as descriptive comparisons, whereas the primary sensitivity analysis was repeated at the reach/segment level by aggregating plate values within each reach and comparing five reference-reach means with five impacted-reach means. The nested results are reported as reach-level sensitivity analysis and provided in the supplementary Excel workbook. Composite pollution index (CPI) was calculated from measured sediment microplastics, sediment Zn, and sediment Cu after z-score standardization. R version 4.3.x was used for statistical analysis; the accompanying workbook documents all values, formulas, and data labels.
CPI = z(sediment microplastics) + z(sediment Zn) + z(sediment Cu)
The CPI was not interpreted as a validated ecological risk index but rather as a statistical descriptor of the combined contamination gradient observed among sampling locations.
2.9 Data verification and supplementary documentation
The complete analytical dataset included group summaries and plate-level observations for the main physicochemical, contaminant, and macroinvertebrate outcomes, together with GPS coordinates, reach-level nesting identifiers, QA/QC records, polymer-characterization details, and validation matrices. Data-integrity checks included verification of sample identifiers, group assignments, analytical units, calculation formulas, summary statistics, and consistency between plate-level and reach-aggregated analyses. The accompanying Excel workbook provides the individualized raw data, reach-level summaries, QA/QC records, and sensitivity analyses used in the manuscript.
As shown in Table 1, temperature, depth, and velocity did not differ significantly between reference and impacted reaches, confirming that the two groups were physically comparable. A significant deterioration in water quality was observed in impacted reaches, in contrast. Conductivity was almost twice as high, turbidity more than doubled, and the levels of nitrate and phosphate were significantly higher than reference sites. In addition, dissolved oxygen declined from 8.16 ± 0.39 to 5.72 ± 0.58 mg L⁻¹ in impacted reaches. These results indicate that the impacted reaches were exposed to a strong chemical and nutrient gradient while maintaining broadly similar hydrological conditions.
Microplastic contamination was consistently higher in impacted reaches, as depicted in Table 2. Sediment microplastics increased from 133.53 ± 49.08 to 308.11 ± 113.89 items kg⁻¹ dw, while biofilm-associated microplastics increased from 15.96 ± 4.31 to 30.88 ± 8.40 µg g⁻¹ dw. The confidence intervals for both differences excluded zero, and the effect sizes were large. This confirms that runoff-affected reaches accumulated substantially higher microplastic loads in both depositional sediments and biologically active biofilms.
Table 1. Physicochemical and hydrological characteristics of reference and impacted irrigation canal reaches (n = 25 per group)
|
Variable |
Reference (Mean ± SD) |
Impacted (Mean ± SD) |
Mean Difference (Imp − Ref) |
t |
df |
p-Value |
Cohen’s d |
|
Temperature (℃) |
24.93 ± 0.38 |
25.09 ± 0.37 |
0.16 |
-1.51 |
47.97 |
0.1380 |
0.43 |
|
Depth (m) |
2.01 ± 0.10 |
2.04 ± 0.08 |
0.03 |
-1.17 |
45.79 |
0.2475 |
0.33 |
|
Velocity (m s⁻¹) |
0.40 ± 0.04 |
0.41 ± 0.04 |
0.01 |
-0.88 |
48.00 |
0.3812 |
0.25 |
|
Conductivity (µS cm⁻¹) |
405.78 ± 34.22 |
801.39 ± 56.63 |
395.61 |
-29.90 |
39.47 |
1.0 × 10⁻²⁸ |
8.46 |
|
Turbidity (NTU) |
10.60 ± 2.43 |
25.00 ± 3.81 |
14.40 |
-15.93 |
40.75 |
4.2 × 10⁻¹⁹ |
4.51 |
|
NO₃⁻ (mg L⁻¹) |
0.97 ± 0.25 |
3.05 ± 0.35 |
2.08 |
-24.18 |
43.43 |
8.0 × 10⁻²⁷ |
6.84 |
|
PO₄³⁻ (mg L⁻¹) |
0.11 ± 0.02 |
0.29 ± 0.04 |
0.18 |
-20.12 |
35.29 |
6.3 × 10⁻²¹ |
5.69 |
|
DO (mg L⁻¹) |
8.16 ± 0.39 |
5.72 ± 0.58 |
-2.44 |
17.46 |
42.02 |
7.2 × 10⁻²¹ |
-4.94 |
Table 2. Microplastic loads in surficial fine sediments and biofilms on colonization plates in reference and impacted irrigation canal reaches (n = 25 per group)
|
Variable |
Reference (Mean ± SD) |
Impacted (Mean ± SD) |
Mean Difference (Imp − Ref) |
95% Confidence Interval (CI) for Difference |
t |
df |
p-Value |
Cohen’s d |
|
Sediment microplastics (items kg⁻¹ dw) |
133.53 ± 49.08 |
308.11 ± 113.89 |
174.58 |
124.09 to 225.06 |
-7.04 |
32.62 |
5.0 × 10⁻⁸ |
1.99 |
|
Biofilm microplastics (µg g⁻¹ dw) |
15.96 ± 4.31 |
30.88 ± 8.40 |
14.92 |
11.09 to 18.75 |
-7.90 |
35.79 |
2.3 × 10⁻⁹ |
2.23 |
Table 3. Dissolved and fine-sediment zinc and copper concentrations in reference and impacted irrigation canal reaches (n = 25 per group)
|
Variable |
Reference (Mean ± SD) |
Impacted (Mean ± SD) |
Mean Difference (Imp − Ref) |
95% Confidence Interval (CI) for Difference |
t |
df |
p-Value |
Cohen’s d |
|
Dissolved Zn (µg L⁻¹) |
10.87 ± 2.75 |
30.88 ± 5.92 |
20.02 |
17.36 to 22.67 |
-15.34 |
33.92 |
8.0 × 10⁻¹⁷ |
4.34 |
|
Dissolved Cu (µg L⁻¹) |
3.10 ± 0.89 |
13.87 ± 4.27 |
10.77 |
8.98 to 12.57 |
-12.33 |
26.09 |
2.2 × 10⁻¹² |
3.49 |
|
Sediment Zn (mg kg⁻¹ dw) |
54.48 ± 19.96 |
136.56 ± 46.11 |
82.08 |
61.63 to 102.54 |
-8.17 |
32.69 |
2.1 × 10⁻⁹ |
2.31 |
|
Sediment Cu (mg kg⁻¹ dw) |
19.52 ± 6.62 |
58.09 ± 16.95 |
38.57 |
31.15 to 45.99 |
-10.60 |
31.15 |
7.4 × 10⁻¹² |
3.00 |
As presented in Table 4, all macroinvertebrate metrics indicated biological impairment in impacted reaches. Total taxon richness declined from 23.87 ± 3.80 to 14.62 ± 4.23 taxa, and Shannon diversity declined from 2.49 ± 0.29 to 1.90 ± 0.27. Sensitive taxa showed the clearest response: EPT richness fell from 6.71 ± 1.52 to 2.61 ± 0.97 taxa, and %EPT decreased from 44.44 ± 11.60% to 12.20 ± 9.40%. BMWP declined from 154.20 ± 26.75 to 59.06 ± 18.71, and ASPT decreased from 6.46 ± 0.44 to 4.04 ± 0.50. The changes are indicative of a community that shifted from more diverse and pollution-sensitive taxa toward more tolerant assemblages. The reach-level sensitivity analysis (Table 5) confirmed that the direction of the main findings was preserved after aggregation across five reference and five impacted reaches/segments.
Table 4. Macroinvertebrate richness, diversity, Ephemeroptera-Plecoptera-Trichoptera (EPT) metrics, and Biological Monitoring Working Party (BMWP)/Average Score per Taxon (ASPT) scores from colonization plates in reference and impacted irrigation canal reaches
|
Metric |
Reference (Mean ± SD) |
Impacted (Mean ± SD) |
Mean Difference |
95% Confidence Interval (CI) |
t |
df |
p-Value |
Cohen’s d |
|
Taxon richness |
23.87 ± 3.80 |
14.62 ± 4.23 |
-9.25 |
-11.54 to -6.96 |
8.13 |
47.46 |
1.5 × 10⁻¹⁰ |
-2.30 |
|
Shannon diversity |
2.49 ± 0.29 |
1.90 ± 0.27 |
-0.59 |
-0.75 to -0.43 |
7.45 |
47.76 |
1.6 × 10⁻⁹ |
-2.11 |
|
EPT richness |
6.71 ± 1.52 |
2.61 ± 0.97 |
-4.10 |
-4.83 to -3.37 |
11.37 |
40.77 |
3.2 × 10⁻¹⁴ |
-3.22 |
|
%EPT |
44.44 ± 11.60 |
12.20 ± 9.40 |
-32.24 |
-38.25 to -26.23 |
10.80 |
46.02 |
3.3 × 10⁻¹⁴ |
-3.05 |
|
BMWP |
154.20 ± 26.75 |
59.06 ± 18.71 |
-95.14 |
-108.30 to -81.97 |
14.57 |
42.94 |
3.2 × 10⁻¹⁸ |
-4.12 |
|
ASPT |
6.46 ± 0.44 |
4.04 ± 0.50 |
-2.42 |
-2.69 to -2.15 |
18.17 |
47.24 |
6.0 × 10⁻²³ |
-5.14 |
Table 5. Reach-level sensitivity analysis using five reference and five impacted reaches/segments
|
Outcome |
n Reaches |
Ref Mean |
Imp Mean |
Imp-Ref |
Reach p |
Data Status |
|
Conductivity |
5 Ref + 5 Imp |
405.78 |
801.39 |
395.61 |
1.59e-07 |
Verified |
|
Sediment MPs |
5 Ref + 5 Imp |
133.53 |
308.11 |
174.58 |
0.0158 |
Verified |
|
Sediment Zn |
5 Ref + 5 Imp |
54.48 |
136.56 |
82.08 |
0.00668 |
Verified |
|
Sediment Cu |
5 Ref + 5 Imp |
19.52 |
58.09 |
38.57 |
0.00024 |
Verified |
|
Taxon richness |
5 Ref + 5 Imp |
23.87 |
14.62 |
-9.25 |
0.00334 |
Verified |
|
%EPT |
5 Ref + 5 Imp |
44.44 |
12.20 |
-32.24 |
0.000175 |
Verified |
|
BMWP |
5 Ref + 5 Imp |
154.20 |
59.06 |
-95.14 |
0.000336 |
Verified |
|
ASPT |
5 Ref + 5 Imp |
6.46 |
4.04 |
-2.42 |
0.000103 |
Verified |
|
DO |
5 Ref + 5 Imp |
8.16 |
5.72 |
-2.44 |
1.94e-06 |
Verified |
|
Turbidity |
5 Ref + 5 Imp |
10.60 |
25.00 |
14.40 |
5.2e-05 |
Verified |
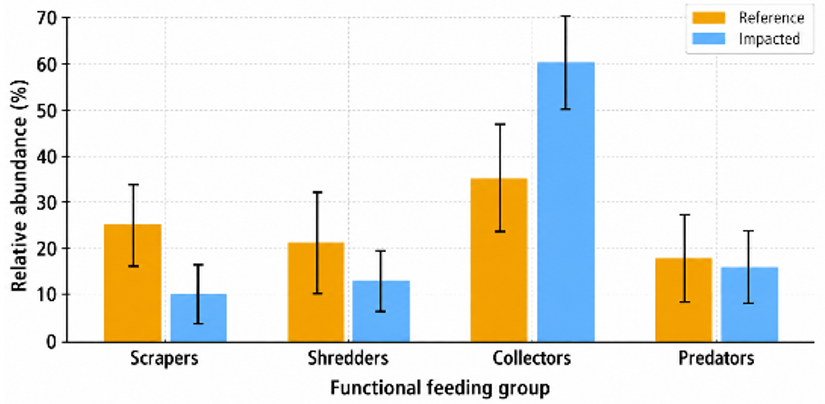
Functional feeding group composition changed in parallel with the taxonomic results (Figure 2). Reference plates supported higher proportions of scrapers and shredders, indicating better-developed grazing and coarse organic matter pathways. Impacted plates were dominated by collectors, which is consistent with greater fine-particle deposition, turbidity, and organic enrichment. Predator proportions changed less than the other groups. Overall, the figure indicates that contamination and fine-sediment inputs altered not only community composition but also the functional structure of the canal assemblage.
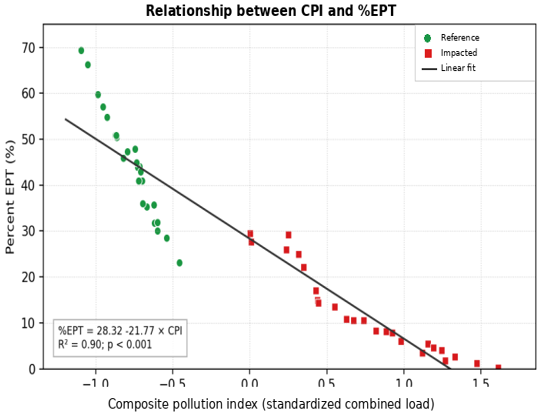
As shown in Figure 3, the plate-level analysis demonstrated a significant negative association between the composite pollution index and %EPT: %EPT = 28.32 - 21.77 × CPI (R² = 0.90, p < 0.001). This relationship was calculated from the verified plate-level raw matrix. Plates with a low pollution score showed higher %EPT, whereas plates with higher microplastic and sediment-metal burdens showed lower %EPT. The corresponding raw values are supplied in the individualized Excel workbook.
Figure 3. Relationship between the composite pollution index and percent Ephemeroptera-Plecoptera-Trichoptera (EPT) on colonization plates, calculated from plate-level raw data
The most important finding of this study is that impacted reaches of the canal were hydrologically similar to the reference reaches but chemically and biologically degraded. Comparable temperature, depth, and velocity decrease the probability that the observed biological impairment was due to the differences in basic physical habitat. Conductivity, turbidity, nitrate, and phosphate were, however, quite high, and dissolved oxygen was low, reflecting a strong water-quality gradient related to runoff. Similar degradation has been reported in canals and surface water bodies that receive textile, tannery, industrial, municipal, or agricultural inputs [9]. The current trend is also in line with the general findings that under the pressures of pollutants, the oxygen and salinity conditions of canals and rivers are significantly affected by discharge management, dilution, and re-aeration capacity [10, 11]. Where effluent treatment is weak and particulate loads are high, suspended solids, nutrients, and oxygen demand can increase rapidly, as illustrated in industrial wastewater and bioremediation studies [12-15].
It was also evident in the affected stretches that there was enrichment in microplastics. Sediment microplastics more than doubled, and biofilm-associated microplastics nearly doubled, illustrating that the canal was a transport channel and retention zone. This is in line with reviews and field studies, which indicate that the distribution of microplastics in freshwater systems is influenced by land use, runoff, sediment deposition, and hydrological setting [16]. The observed absolute sediment load in the present study was comparable with some irrigation ditches, but lower than the reported load in highly polluted rural ditches and urban river sediments [17, 18], which indicates a moderate to high level of local pollution rather than an extreme regional pollution hotspot. The importance of biofilm contamination is that biofilms are living feeding surfaces and early colonization habitats. Experimental and river studies show that biofilms can retain microplastics and transfer them to grazers and protists, turning passive deposits into biologically relevant exposure routes [19, 20]. This, along with data on co-occurring microplastics and metals, helps to establish the ecological relevance of measuring microplastics in both sediments and biofilms [21-23].
Enrichment of both dissolved and fine-sediment fractions in both Zn and Cu suggests multiple exposure pathways for colonizing organisms. Dissolved metals are indicative of direct exposure to the water column, and fine sediments are indicative of an available pool where metals can be bound and are in close contact with the benthic organisms. Also, similar associations have been reported between agricultural or urban drainage and higher concentrations of Cu and Zn in canal-irrigated landscapes [24], drainage sediments [25], and urban-influenced river networks [26]. Furthermore, studies of larger, more dynamic river systems generally find a higher spatial heterogeneity or stronger self-purification than was observed here, pointing to the possibility that the behavior of smaller secondary canals might be that of a depositional sink when flushing and dilution are limited [27, 28]. Lower average concentrations of Cu and Zn, as well as fewer hotspots, have been found in low-disturbance river systems, indicating that the current enrichment is associated with drainage-affected managed canals and not background conditions [29, 30]. Measured concentrations should be considered in the context of published environmental benchmarks and regional background concentrations, not as an indication of ecological risk. A comparison to reported freshwater and sediment reference values indicates that affected reaches had higher concentrations of contaminants, but a full ecological risk assessment would need more data such as contaminant bioavailability, length of exposure, toxicity, and seasonal fluctuations.
Biological response was very strong and consistent between taxonomic and biotic-index metrics. There was a decline in total richness, Shannon diversity, and EPT richness and % EPT, BMWP, and ASPT were the best indicators of ecological impairment. These metrics focus on pollution-sensitive families and sensitive orders of insects [31, 32] and are expected to respond to oxygen stress, fine sedimentation, organic enrichment, and chemical contamination. The decline in sensitive taxa was accompanied by increased representation of tolerant groups, suggesting a shift in community structure rather than a simple reduction in abundance. The observed decrease is consistent with biomonitoring studies conducted in Egypt and other parts of the world, which revealed that polluted canals or rivers exhibited lower BMWP/ASPT and replacement of sensitive taxa with tolerant ones [33, 34]. Depletion of EPT and shifts in tolerance have been observed in urbanizing streams and river systems that are subjected to cumulative stressors [35]. In contrast, hilly streams of high quality or less degraded agricultural ditches may support more diverse EPT or macroinvertebrate communities, demonstrating that canal biodiversity can survive where pollutant stressors and habitat degradation are managed [36]. Although index performance can differ across regions, as seen for non-indigenous biological tools in semi-arid regulated rivers, the direction and magnitude of response in the current study were coherent with the general principles of bioassessment [37].
The functional feeding group findings support the interpretation that the contamination also impacted the functioning of the ecosystem and not just the taxonomic composition. Scrapers and shredders were generally more abundant on reference plates, which are typically indicative of cleaner surfaces, more balanced processing of organic matter, and better oxygen conditions. The collectors dominated the impacted plates, indicative of fine-particle accumulation and suspended organics. This functional shift corresponds to an increase in turbidity, nutrients, microplastics, and sediment-bound metals that are measured. It also further enhances the importance of artificial substrates in engineered canals, where natural-bed sampling might be variable. Hester-Dendy plates standardize surface area and exposure time to help comparisons between reaches in a modified channel [38]. Given the general importance of drains and managed freshwater habitats for biodiversity, not all artificial drains should be excluded from the biological monitoring based on the premise that they are man-made [39].
The integrated stressor-response signal is obtained from the negative regression between the composite pollution index and %EPT. The reduction in %EPT represents a response associated with a combined environmental stress gradient involving microplastics, traces metals, nutrient enrichment, turbidity, and reduced dissolved oxygen. The present design does not allow separation of the independent contribution of individual stressors. This seems ecologically feasible as plastic particles, metals, nutrients, fine sediments, and oxygen decline can operate together in canal habitats. While the field design does not allow separation of the independent toxicity of each stressor, the strong consistency between water chemistry, contaminant burdens, taxonomic metrics, functional groups, and biotic indices provides a strong diagnosis of contaminant-associated impairment.
There are some limitations to note. Although the experimental design provided standardized exposure conditions, the single 28-day deployment represents a snapshot of ecological responses. Temporal changes associated with irrigation schedules, rainfall-driven runoff, and seasonal contaminant transport could influence exposure intensity and should be evaluated through repeated seasonal deployments. Taxa were identified to the lowest practicable level for routine biomonitoring, which may obscure species-level sensitivity. Other stressors, such as pesticides, organic contaminants, and microbial pollution, may also have contributed to the observed response. Nevertheless, the consistency of the verified field, laboratory, and biological data supports the reported contaminant-associated impairment pattern.
The results of this study indicate that reaches of irrigation canals receiving mixed (agricultural and urban) runoff may contain higher concentrations of microplastic and elevated levels of metals such as Zn/Cu and may exhibit reduced water quality and lower dissolved oxygen. The chemical changes were found despite generally similar hydrologic conditions in both reference and impacted reaches, lending credibility to the interpretation that biological impairment was related to gradients in contaminants and water quality. Macroinvertebrate responses were similar, with richness, Shannon diversity, EPT metrics, BMWP and ASPT, and functional feeding groups that shifted from a scraper/shredder-supported community to a collector-dominated community. Standardized Hester-Dendy colonization plates were a convenient and responsive means of assessing ecological degradation in operational irrigation canals. The synoptic application of microplastic measurement, trace-metal analysis, and macroinvertebrate biotic index may help in the more reliable diagnosis of the health status of the canals and inform management interventions. The results could provide guidance for precautionary management measures such as better runoff management, minimizing plastic inputs, and maintaining riparian buffers. Before wider recommendations for risk can be formulated, however, validation across seasons, other canal systems, and direct assessment of other human and agricultural exposure pathways is needed.
Tables A1-A6 provide the complete individualized raw data, reach-level summaries, data-completeness documentation, QA/QC records, analytical validation, and sensitivity analyses in the accompanying Excel workbook.
Table A1. Taxon-level abundance matrix, Ephemeroptera-Plecoptera-Trichoptera (EPT) classification, and Biological Monitoring Working Party (BMWP) scoring framework
|
Taxon |
Family |
Reference Abundance |
Impacted Abundance |
EPT Status |
BMWP Score |
|
Baetis sp. |
Baetidae |
95 |
15 |
Yes |
4 |
|
Caenis sp. |
Caenidae |
72 |
12 |
Yes |
7 |
|
Heptagenia sp. |
Heptageniidae |
45 |
3 |
Yes |
10 |
|
Heptagenia sp. |
Ephemerellidae |
38 |
0 |
Yes |
10 |
|
Hydropsyche sp. |
Hydropsychidae |
64 |
10 |
Yes |
5 |
|
Leptocerus sp. |
Leptoceridae |
30 |
2 |
Yes |
10 |
|
Philopotamus sp. |
Philopotamidae |
18 |
0 |
Yes |
8 |
|
Perla sp. |
Perlidae |
20 |
0 |
Yes |
10 |
|
Gammarus sp. |
Gammaridae |
80 |
50 |
No |
6 |
|
Asellus sp. |
Asellidae |
22 |
48 |
No |
3 |
|
Chironomus sp. |
Chironomidae |
110 |
260 |
No |
2 |
|
Ceratopogon sp. |
Ceratopogonidae |
25 |
60 |
No |
4 |
|
Simulium sp. |
Simuliidae |
48 |
42 |
No |
5 |
|
Tubifex sp. |
Tubificidae |
12 |
160 |
No |
1 |
|
Lymnaea sp. |
Lymnaeidae |
30 |
70 |
No |
3 |
|
Physa sp. |
Physidae |
18 |
95 |
No |
3 |
|
Planorbis sp. |
Planorbidae |
24 |
80 |
No |
3 |
|
Sphaerium sp. |
Sphaeriidae |
35 |
35 |
No |
3 |
|
Elmis sp. |
Elmidae |
32 |
10 |
No |
5 |
|
Dytiscus sp. |
Dytiscidae |
18 |
20 |
No |
5 |
|
Gomphus sp. |
Gomphidae |
21 |
12 |
No |
8 |
|
Coenagrion sp. |
Coenagrionidae |
26 |
20 |
No |
6 |
Table A2. Data completeness and verification summary
|
Domain |
Summary Availability |
Raw-Record Status |
Data Completeness |
Verification and Documentation |
|
Main study variables in Tables 1-4 |
Available |
Plate-level raw values available and verified |
Complete |
Plate-level matrix verified against reported means and standard deviations (SDs) |
|
Spatial coordinates and reach distances |
Available |
GPS coordinates and reach distances documented |
Complete |
WGS84 reach and plate coordinates verified |
|
Quality assurance/quality control (QA/QC) microplastic records |
Available |
Recovery, blanks, limit of detection (LOD)/limit of quantification (LOQ), particle size, and morphology documented |
Complete |
QA/QC records verified and supplied in supplementary tables |
|
Metal-analysis QA/QC records |
Available |
Instrument settings, certified reference material (CRM), recovery, and detection limits documented |
Complete |
Method and QA/QC records verified |
|
Nested reach structure |
Available |
Reach-level cluster identifiers documented |
Complete |
Five plates assigned to each of 10 field reaches |
Table A3. Microplastic recovery and identification summary
|
Polymer Type |
n Batches |
Recovery, Mean ± SD (%) |
Identification Criterion |
Data Status |
|
PE |
5 |
87.8 ± 2.1 |
Pyrolysis-GC-MS library match ≥80% |
Verified |
|
PP |
5 |
93.2 ± 3.5 |
Pyrolysis-GC-MS library match ≥80% |
Verified |
|
PET |
5 |
83.2 ± 3.8 |
Pyrolysis-GC-MS library match ≥80% |
Verified |
|
PS |
5 |
83.6 ± 6.6 |
Pyrolysis-GC-MS library match ≥80% |
Verified |
|
PVC |
5 |
82.3 ± 4.3 |
Pyrolysis-GC-MS library match ≥80% |
Verified |
Table A4. Microplastic limit of detection (LOD)/limit of quantification (LOQ) and blank-correction criteria
|
Metric |
Value |
Basis |
Data Status |
|
Minimum detectable particle size |
50 µm |
Analytical protocol threshold |
Verified |
|
Sediment MP LOD |
6 items kg⁻¹ dw |
3 SD of blank items after mass normalization |
Verified |
|
Sediment MP LOQ |
20 items kg⁻¹ dw |
10 SD of blank items after mass normalization |
Verified |
|
Biofilm MP mass LOD |
0.18 µg g⁻¹ dw |
3 SD of blank mass signal |
Verified |
|
Biofilm MP mass LOQ |
0.60 µg g⁻¹ dw |
10 SD of blank mass signal |
Verified |
Table A5. Metal-analysis method, instrument, CRM, and detection-limit summary
|
Parameter |
Value |
Data Status |
|
Water preparation method |
0.45-µm filtration followed by nitric-acid preservation; EPA 200.7-style ICP-OES workflow |
Verified |
|
Sediment digestion method |
Microwave-assisted acid digestion of the <63-µm fraction; EPA 3051A-style digestion followed by ICP-OES |
Verified |
|
Instrument model |
Thermo Scientific iCAP 7400 duo ICP-OES |
Verified |
|
Zn wavelength |
213.856 nm |
Verified |
|
Cu wavelength |
324.754 nm |
Verified |
|
Water Zn LOD/LOQ |
0.45 / 1.50 µg L⁻¹ |
Verified |
|
Water Cu LOD/LOQ |
0.20 / 0.70 µg L⁻¹ |
Verified |
|
Sediment Zn LOD/LOQ |
0.40 / 1.30 mg kg⁻¹ dw |
Verified |
|
Sediment Cu LOD/LOQ |
0.12 / 0.40 mg kg⁻¹ dw |
Verified |
|
CRM |
NIST 1643f water and NIST 2709a sediment |
Verified |
Table A6. Sensitivity-analysis summary for selected outcomes
|
Variable |
Sensitivity Method |
Estimated Difference (Imp − Ref) |
Direction Preserved |
Main Conclusion |
Data Status |
|
Conductivity (µS cm⁻¹) |
Plate-level analysis |
395.610 |
Yes |
increase in impacted |
Verified |
|
Conductivity (µS cm⁻¹) |
Reach-aggregated nested sensitivity |
375.829 |
Yes |
increase in impacted |
Verified |
|
Sediment microplastics (items kg⁻¹ dw) |
Plate-level analysis |
174.580 |
Yes |
increase in impacted |
Verified |
|
Sediment microplastics (items kg⁻¹ dw) |
Reach-aggregated nested sensitivity |
165.851 |
Yes |
increase in impacted |
Verified |
|
%EPT |
Plate-level analysis |
-32.240 |
Yes |
decrease in impacted |
Verified |
|
%EPT |
Reach-aggregated nested sensitivity |
-30.628 |
Yes |
decrease in impacted |
Verified |
|
ASPT |
Plate-level analysis |
-2.420 |
Yes |
decrease in impacted |
Verified |
|
ASPT |
Reach-aggregated nested sensitivity |
-2.299 |
Yes |
decrease in impacted |
Verified |
[1] Gething, K.J., Little, S. (2020). The importance of artificial drains for macroinvertebrate biodiversity in reclaimed agricultural landscapes. Hydrobiologia, 847: 3129-3138. https://doi.org/10.1007/s10750-020-04325-8
[2] Johnson, C.N., Balmford, A., Brook, B.W., et al. (2017). Biodiversity losses and conservation responses in the Anthropocene. Science, 356(6335): 270-273. https://doi.org/10.1126/science.aam9317
[3] Kumar, S., Kumar, A., Behera, D., et al. (2025). Co-occurrence of microplastics and heavy metals in a freshwater lake system in the Indian Himalayas: Distribution and influencing factors. Emerging Contaminants, 11(1): 100394. https://doi.org/10.1016/j.emcon.2024.100394
[4] Devi, A., De Silva, Y.S.K., Tyagi, L., Aaryashree. (2025). The individual and combined effects of microplastics and heavy metals on marine organisms. Microplastics, 4(3): 38. https://doi.org/10.3390/microplastics4030038
[5] Pace, G., Melfe, F., Rodrigues, C., et al. (2025). Microplastic accumulation in benthic macroinvertebrates is widespread, regardless of the river ecological status. Hydrobiologia. https://doi.org/10.1007/s10750-025-05882-6
[6] Reid, A.J., Carlson, A.K., Creed, I.F., et al. (2019). Emerging threats and persistent conservation challenges for freshwater biodiversity. Biological Reviews, 94(3): 849-873. https://doi.org/10.1111/brv.12480
[7] Hansson, M., Lind, L., Vernby, A., Greenberg, L., Watz, J. (2021). The suitability of Hester–Dendy macroinvertebrate samplers in fluctuating flows. River Research and Applications, 37(6): 895-899. https://doi.org/10.1002/rra.3805
[8] Nassrullah, S., Stubbs, A., Stoesser, T., Wilson, C.A.M.E. (2019). The validation of the logarithmic velocity profiles above rough-bed flows. In Proceedings of the 38th IAHR World Congress (Panama). The International Association for Hydro-Environment Engineering and Research (IAHR): Panama City, Panama. https://doi.org/10.3850/38WC092019-0421
[9] Fasuan, O., Ogunnusi, T., Akpor, O. (2025). Evaluation of physicochemical water-quality indices of two surface water canals in Ado-Ekiti, Ekiti State, Nigeria. Discover Applied Sciences, 7: 1101. https://doi.org/10.1007/s42452-025-07774-9
[10] Shukur, S.A., Hassan, F.M., Fakhry, S.S. (2024). Unveiling the Nexus the link between water quality index and phthalic acid ester concentrations in Tigris River. Emerging Contaminants, 10(1): 100279. https://doi.org/10.1016/j.emcon.2023.100279
[11] Nassrullah, S.A., Ismail, A.H., Rdhewa, A.M., Al-Ibady, Q.A.N.A.K., Al-Zuhairy, M.S., Farhan, A.A.R. (2025). Spatial and temporal variations of the water quality of the Tigris River in the north and south of Baghdad city. IOP Conference Series: Earth and Environmental Science, 1507(1): 012033. https://doi.org/10.1088/1755-1315/1507/1/012033
[12] Monira, U., Sattar, G.S., Mostafa, M.G. (2023). Characterization and removal efficiency of central effluent treatment plant (CETP). Journal of Sustainability and Environmental Management, 2(1): 42-50. https://doi.org/10.3126/josem.v2i1.53116
[13] Al-Ibady, Q.A.N.A.K. (2025). Green synthesis of star anise (Illicium verum)-mediated manganese oxide nanocomposite for efficient Pb(II) and Cr(VI) adsorption. International Journal of Design and Nature and Ecodynamics, 20(9): 2157-2165. https://doi.org/10.18280/ijdne.200919
[14] Al-Ibady, Q.A.N.A.K., Hashim, A.K., Ghanim, S.A., Ajmi, R.N., Sayyid, M.M. (2025). Analysis of the effect of heavy elements in polluted industrial water and its environmental treatment: An applied study on the Gas Power Plant/1 (Central Region) in Southern Baghdad and its discharge into the Tigris River. International Journal of Environmental Impacts, 8(2): 415-421. https://doi.org/10.18280/ijei.080220
[15] Ali, I.Q., Kadhim, A.F., Latif, A.S., Al-Ibady, Q.A.N.A.K., Huno, S.H. (2025). Applications of bacterial biotechnology in the bioremediation of water contaminated with heavy metals. Agricultural Science Digest, 45(5): 878-884. https://doi.org/10.18805/ag.DF-694
[16] Bexeitova, K., Baimenov, A., Varol, E.A., et al. (2024). Microplastics in freshwater systems: A review of classification, sources, and environmental impacts. Chemical Engineering Journal Advances, 20: 100649. https://doi.org/10.1016/j.ceja.2024.100649
[17] Lwanga, E.H., Van Roshum, I., Munhoz, D.R., et al. (2023). Microplastic appraisal of soil, water, ditch sediment and airborne dust: The case of agricultural systems. Environmental Pollution, 316: 120513. https://doi.org/10.1016/j.envpol.2022.120513
[18] Sohail, N., Khalid, A., Rahim, D.S., Khalid, S. (2024). Assessment of microplastic pollution in sediments and water of River Soan, Punjab, Pakistan. Journal of Environmental Impact and Management Policy, 4(6): 11-29. https://doi.org/10.55529/jeimp.46.11.29
[19] Merbt, S.N., Kroll, A., Sgier, L., Tlili, A., Schirmer, K., Behra, R. (2024). Fate and effects of microplastic particles in a periphyton-grazer system. Environmental Pollution, 347: 123798. https://doi.org/10.1016/j.envpol.2024.123798
[20] Hamann, L., Werner, J., Haase, F.J., et al. (2024). Retention of microplastics by biofilms and their ingestion by protists in rivers. Environmental Microbiology Reports, 16(5): e70016. https://doi.org/10.1111/1758-2229.70016
[21] Adam, A.B., Donatus, R.B., Abdullahi, K.N., Bilyaminu, A., Abubakar, M.Y. (2025). Heavy metals and microplastic synergism in aquatic systems: Transport, accumulation, and ecotoxicology. In 8th Bilsel International Truva Scientific Researches and Innovation Congressat, Çanakkale, Türkiye, pp. 2489-2509.
[22] Izuafa, A., Oyewole, O.A., Nathaniel, J., Obi, P.O., Muhammad, S. (2026). The environmental impacts and remediation strategies of microplastics in aquatic sediments. Integrated Environmental Assessment and Management, vjag038. https://doi.org/10.1093/inteam/vjag038
[23] Ma, W., Liang, X.J., Ding, C.L., Ye, Y.Y., Li, J.J. (2026). From enrichment to fate: Transport, transformation, and fate of micro- and nanoplastics in marine environments. Toxics, 14(2): 120. https://doi.org/10.3390/toxics14020120
[24] Khan, Z.I., Haider, R., Ahmad, K., et al. (2023). Evaluation of Cu, Zn, Fe, and Mn concentrations in water, soil, and fruit samples in Sargodha District, Pakistan. Sustainability, 15(22): 15696. https://doi.org/10.3390/su152215696
[25] Al-Ghanimy, G., Bahel, D., Al-Rekabi, K., Yousif, H. (2023). Study of dissolved and suspended heavy metals in four different sites of the mid Euphrates River, Iraq. Journal of Al-Muthanna Agricultural Sciences, 10(1): 1. https://doi.org/10.52113/mjas04/10.1/7
[26] Savic, R., Stajic, M., Kostesic, E., et al. (2025). Heavy metal contamination and ecological risk assessment in drainage channel sediments from urban and agricultural areas. Journal of Environmental Management, 389: 126221. https://doi.org/10.1016/j.jenvman.2025.126221
[27] Popovych, V., Skrobala, V., Kopylov, V., Kopystynskyi, Y. (2025). Heavy metals distribution in water and soil of the coastal zone of the Styr River (Ukraine) and its tributaries. Journal of Ecological Engineering, 26(2): 1-14. https://doi.org/10.12911/22998993/196042
[28] Mussakulkyzy, A., Opp, C., Amirgaliev, N., Madibekov, A., Ismukhanova, L., Zhadi, A. (2025). Transmission of heavy metals in river water and self-purification capacity of Ile River. Applied Sciences, 15(12): 6548. https://doi.org/10.3390/app15126548
[29] Cai, N., Wang, X.P., Liu, X.Y., Deng, L. (2025). Distribution and source appointment of potentially toxic elements in rivers via self-organizing map and positive matrix factorization (Qinghai–Tibet Plateau, China). Water, 17(17): 2547. https://doi.org/10.3390/w17172547
[30] Laaraj, M., Ait Brahim, Y., Mesnage, V., et al. (2025). Heavy metal contamination of sediments in the Inaouène watershed (Morocco): Indices, statistical methods, and contributions to sustainable environmental management. Sustainability, 17(10): 4668. https://doi.org/10.3390/su17104668
[31] Armitage, P.D., Moss, D., Wright, J.F., Furse, M.T. (1983). The performance of a new biological water quality score system based on macroinvertebrates over a wide range of unpolluted running-water sites. Water Research, 17(3): 333-347. https://doi.org/10.1016/0043-1354(83)90188-4
[32] Ab Hamid, S., Md Rawi, C.S. (2017). Application of aquatic insects (Ephemeroptera, Plecoptera and Trichoptera) in water quality assessment of Malaysian headwater. Tropical Life Sciences Research, 28(2): 143-162. https://doi.org/10.21315/tlsr2017.28.2.11
[33] Bendary, R.E., Hegab, M.H. (2024). Applying diversity and pollution biotic indices based on macroinvertebrates to assess the water quality of the Ismailia Canal, Egypt. Egyptian Journal of Aquatic Biology and Fisheries, 28(1): 1277-1291. https://doi.org/10.21608/ejabf.2024.340595
[34] Sama, H.A., Yuzir, M.A., Azman, S. (2024). Water quality assessment using selected macroinvertebrate-based indices and water quality index of Sungai Air Hitam, Selangor. Tropical Aquatic and Soil Pollution, 4(2): 143-156. https://doi.org/10.53623/tasp.v4i2.505
[35] Sinche, F., Cabrera, M., Vaca, L., Segura, E., Carrera, P. (2023). Determination of the ecological water quality in the Orienco stream using benthic macroinvertebrates in the Northern Ecuadorian Amazon. Integrated Environmental Assessment and Management, 19(3): 615-625. https://doi.org/10.1002/ieam.4666
[36] Tubić, B., Andjus, S., Zorić, K., et al. (2024). Aquatic insects (Ephemeroptera, Plecoptera and Trichoptera) metric as an important tool in water quality assessment in hilly and mountain streams. Water, 16(6): 849. https://doi.org/10.3390/w16060849
[37] Mohseni, F., Nemati Varnosfaderany, M., Soffianian, A., Fakheran, S. (2025). Evaluation of non-indigenous biological assessment tools using benthic macroinvertebrates in a regulated river in the semi-arid region of Iran. Scientific Reports, 15: 38256. https://doi.org/10.1038/s41598-025-21997-1
[38] Letovsky, E., Myers, I.E., Canepa, A., McCabe, D.J. (2012). Differences between kick sampling techniques and short-term Hester-Dendy sampling for stream macroinvertebrates. BIOS, 83(2): 47-55. https://doi.org/10.1893/0005-3155-83.2.47
[39] Oertli, B. (2018). Freshwater biodiversity conservation: The role of artificial ponds in the 21st century. Aquatic Conservation: Marine and Freshwater Ecosystems, 28(2): 264-269. https://doi.org/10.1002/aqc.2902